Free Statistics

of Irreproducible Research!

Author's title

Author*The author of this computation has been verified*
R Software Modulerwasp_multipleregression.wasp
Title produced by softwareMultiple Regression
Date of computationWed, 18 Nov 2009 11:46:54 -0700
Cite this page as followsStatistical Computations at FreeStatistics.org, Office for Research Development and Education, URL https://freestatistics.org/blog/index.php?v=date/2009/Nov/18/t1258570092fi8qoix2j7io0tm.htm/, Retrieved Wed, 01 May 2024 20:43:00 +0000
Statistical Computations at FreeStatistics.org, Office for Research Development and Education, URL https://freestatistics.org/blog/index.php?pk=57587, Retrieved Wed, 01 May 2024 20:43:00 +0000
QR Codes:

Original text written by user:
IsPrivate?No (this computation is public)
User-defined keywords
Estimated Impact236
Family? (F = Feedback message, R = changed R code, M = changed R Module, P = changed Parameters, D = changed Data)
-     [Multiple Regression] [Q1 The Seatbeltlaw] [2007-11-14 19:27:43] [8cd6641b921d30ebe00b648d1481bba0]
- RM D  [Multiple Regression] [Seatbelt] [2009-11-12 14:10:54] [b98453cac15ba1066b407e146608df68]
- R  D      [Multiple Regression] [] [2009-11-18 18:46:54] [d5837f25ec8937f9733a894c487f865c] [Current]
Feedback Forum

Post a new message
Dataseries X:
3030.29	101.2
2803.47	101.1
2767.63	100.7
2882.6	100.1
2863.36	99.9
2897.06	99.7
3012.61	99.5
3142.95	99.2
3032.93	99
3045.78	99
3110.52	99.3
3013.24	99.5
2987.1	99.7
2995.55	100
2833.18	100.4
2848.96	100.6
2794.83	100.7
2845.26	100.7
2915.02	100.6
2892.63	100.5
2604.42	100.6
2641.65	100.5
2659.81	100.4
2638.53	100.3
2720.25	100.4
2745.88	100.4
2735.7	100.4
2811.7	100.4
2799.43	100.4
2555.28	100.5
2304.98	100.6
2214.95	100.6
2065.81	100.5
1940.49	100.5
2042.00	100.7
1995.37	101.1
1946.81	101.5
1765.9	101.9
1635.25	102.1
1833.42	102.1
1910.43	102.1
1959.67	102.4
1969.6	102.8
2061.41	103.1
2093.48	103.1
2120.88	102.9
2174.56	102.4
2196.72	101.9
2350.44	101.3
2440.25	100.7
2408.64	100.6
2472.81	101
2407.6	101.5
2454.62	101.9
2448.05	102.1
2497.84	102.3
2645.64	102.5
2756.76	102.9
2849.27	103.6
2921.44	104.3


Summary of computational transaction
Raw Inputview raw input (R code)
Raw Outputview raw output of R engine
Computing time3 seconds
R Server'Gwilym Jenkins' @ 72.249.127.135

\begin{tabular}{lllllllll}
\hline
Summary of computational transaction \tabularnewline
Raw Input & view raw input (R code)  \tabularnewline
Raw Output & view raw output of R engine  \tabularnewline
Computing time & 3 seconds \tabularnewline
R Server & 'Gwilym Jenkins' @ 72.249.127.135 \tabularnewline
\hline
\end{tabular}
%Source: https://freestatistics.org/blog/index.php?pk=57587&T=0

[TABLE]
[ROW][C]Summary of computational transaction[/C][/ROW]
[ROW][C]Raw Input[/C][C]view raw input (R code) [/C][/ROW]
[ROW][C]Raw Output[/C][C]view raw output of R engine [/C][/ROW]
[ROW][C]Computing time[/C][C]3 seconds[/C][/ROW]
[ROW][C]R Server[/C][C]'Gwilym Jenkins' @ 72.249.127.135[/C][/ROW]
[/TABLE]
Source: https://freestatistics.org/blog/index.php?pk=57587&T=0

Globally Unique Identifier (entire table): ba.freestatistics.org/blog/index.php?pk=57587&T=0

As an alternative you can also use a QR Code:  

The GUIDs for individual cells are displayed in the table below:

Summary of computational transaction
Raw Inputview raw input (R code)
Raw Outputview raw output of R engine
Computing time3 seconds
R Server'Gwilym Jenkins' @ 72.249.127.135


Multiple Linear Regression - Estimated Regression Equation
Gzhidx[t] = + 100.445809918502 -0.0003448988264416Bel20[t] + 0.0483895407575485t + e[t]

\begin{tabular}{lllllllll}
\hline
Multiple Linear Regression - Estimated Regression Equation \tabularnewline
Gzhidx[t] =  +  100.445809918502 -0.0003448988264416Bel20[t] +  0.0483895407575485t  + e[t] \tabularnewline
\hline
\end{tabular}
%Source: https://freestatistics.org/blog/index.php?pk=57587&T=1

[TABLE]
[ROW][C]Multiple Linear Regression - Estimated Regression Equation[/C][/ROW]
[ROW][C]Gzhidx[t] =  +  100.445809918502 -0.0003448988264416Bel20[t] +  0.0483895407575485t  + e[t][/C][/ROW]
[/TABLE]
Source: https://freestatistics.org/blog/index.php?pk=57587&T=1

Globally Unique Identifier (entire table): ba.freestatistics.org/blog/index.php?pk=57587&T=1

As an alternative you can also use a QR Code:  

The GUIDs for individual cells are displayed in the table below:

Multiple Linear Regression - Estimated Regression Equation
Gzhidx[t] = + 100.445809918502 -0.0003448988264416Bel20[t] + 0.0483895407575485t + e[t]


Multiple Linear Regression - Ordinary Least Squares
VariableParameterS.D.T-STATH0: parameter = 02-tail p-value1-tail p-value
(Intercept)100.4458099185020.900743111.514300
Bel20-0.00034489882644160.000298-1.15690.2521210.12606
t0.04838954075754850.0068597.05500

\begin{tabular}{lllllllll}
\hline
Multiple Linear Regression - Ordinary Least Squares \tabularnewline
Variable & Parameter & S.D. & T-STATH0: parameter = 0 & 2-tail p-value & 1-tail p-value \tabularnewline
(Intercept) & 100.445809918502 & 0.900743 & 111.5143 & 0 & 0 \tabularnewline
Bel20 & -0.0003448988264416 & 0.000298 & -1.1569 & 0.252121 & 0.12606 \tabularnewline
t & 0.0483895407575485 & 0.006859 & 7.055 & 0 & 0 \tabularnewline
\hline
\end{tabular}
%Source: https://freestatistics.org/blog/index.php?pk=57587&T=2

[TABLE]
[ROW][C]Multiple Linear Regression - Ordinary Least Squares[/C][/ROW]
[ROW][C]Variable[/C][C]Parameter[/C][C]S.D.[/C][C]T-STATH0: parameter = 0[/C][C]2-tail p-value[/C][C]1-tail p-value[/C][/ROW]
[ROW][C](Intercept)[/C][C]100.445809918502[/C][C]0.900743[/C][C]111.5143[/C][C]0[/C][C]0[/C][/ROW]
[ROW][C]Bel20[/C][C]-0.0003448988264416[/C][C]0.000298[/C][C]-1.1569[/C][C]0.252121[/C][C]0.12606[/C][/ROW]
[ROW][C]t[/C][C]0.0483895407575485[/C][C]0.006859[/C][C]7.055[/C][C]0[/C][C]0[/C][/ROW]
[/TABLE]
Source: https://freestatistics.org/blog/index.php?pk=57587&T=2

Globally Unique Identifier (entire table): ba.freestatistics.org/blog/index.php?pk=57587&T=2

As an alternative you can also use a QR Code:  

The GUIDs for individual cells are displayed in the table below:

Multiple Linear Regression - Ordinary Least Squares
VariableParameterS.D.T-STATH0: parameter = 02-tail p-value1-tail p-value
(Intercept)100.4458099185020.900743111.514300
Bel20-0.00034489882644160.000298-1.15690.2521210.12606
t0.04838954075754850.0068597.05500


Multiple Linear Regression - Regression Statistics
Multiple R0.784739150333494
R-squared0.615815534066134
Adjusted R-squared0.6023353773667
F-TEST (value)45.6831139130597
F-TEST (DF numerator)2
F-TEST (DF denominator)57
p-value1.44340095431517e-12
Multiple Linear Regression - Residual Statistics
Residual Standard Deviation0.749246965713169
Sum Squared Residuals31.9981478909323

\begin{tabular}{lllllllll}
\hline
Multiple Linear Regression - Regression Statistics \tabularnewline
Multiple R & 0.784739150333494 \tabularnewline
R-squared & 0.615815534066134 \tabularnewline
Adjusted R-squared & 0.6023353773667 \tabularnewline
F-TEST (value) & 45.6831139130597 \tabularnewline
F-TEST (DF numerator) & 2 \tabularnewline
F-TEST (DF denominator) & 57 \tabularnewline
p-value & 1.44340095431517e-12 \tabularnewline
Multiple Linear Regression - Residual Statistics \tabularnewline
Residual Standard Deviation & 0.749246965713169 \tabularnewline
Sum Squared Residuals & 31.9981478909323 \tabularnewline
\hline
\end{tabular}
%Source: https://freestatistics.org/blog/index.php?pk=57587&T=3

[TABLE]
[ROW][C]Multiple Linear Regression - Regression Statistics[/C][/ROW]
[ROW][C]Multiple R[/C][C]0.784739150333494[/C][/ROW]
[ROW][C]R-squared[/C][C]0.615815534066134[/C][/ROW]
[ROW][C]Adjusted R-squared[/C][C]0.6023353773667[/C][/ROW]
[ROW][C]F-TEST (value)[/C][C]45.6831139130597[/C][/ROW]
[ROW][C]F-TEST (DF numerator)[/C][C]2[/C][/ROW]
[ROW][C]F-TEST (DF denominator)[/C][C]57[/C][/ROW]
[ROW][C]p-value[/C][C]1.44340095431517e-12[/C][/ROW]
[ROW][C]Multiple Linear Regression - Residual Statistics[/C][/ROW]
[ROW][C]Residual Standard Deviation[/C][C]0.749246965713169[/C][/ROW]
[ROW][C]Sum Squared Residuals[/C][C]31.9981478909323[/C][/ROW]
[/TABLE]
Source: https://freestatistics.org/blog/index.php?pk=57587&T=3

Globally Unique Identifier (entire table): ba.freestatistics.org/blog/index.php?pk=57587&T=3

As an alternative you can also use a QR Code:  

The GUIDs for individual cells are displayed in the table below:

Multiple Linear Regression - Regression Statistics
Multiple R0.784739150333494
R-squared0.615815534066134
Adjusted R-squared0.6023353773667
F-TEST (value)45.6831139130597
F-TEST (DF numerator)2
F-TEST (DF denominator)57
p-value1.44340095431517e-12
Multiple Linear Regression - Residual Statistics
Residual Standard Deviation0.749246965713169
Sum Squared Residuals31.9981478909323


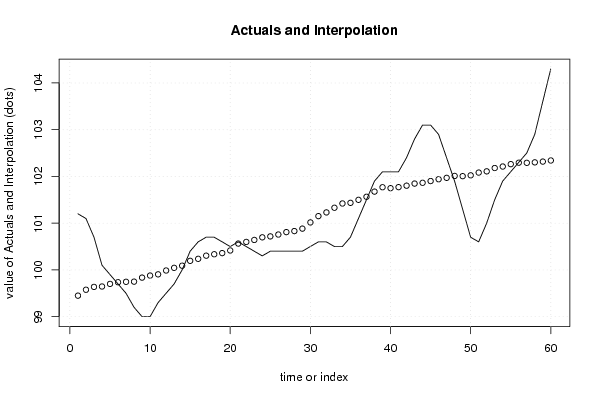
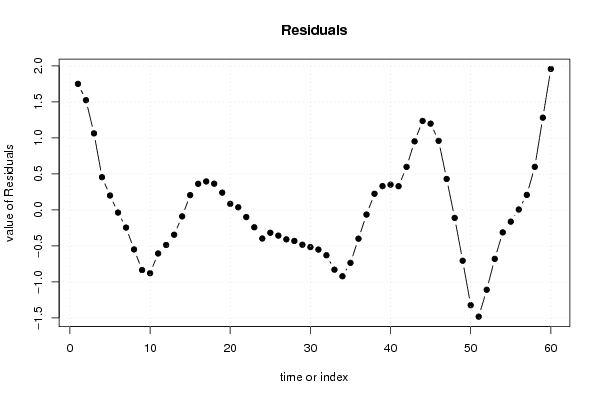
Multiple Linear Regression - Actuals, Interpolation, and Residuals
Time or IndexActualsInterpolationForecastResidualsPrediction Error
1101.299.4490559944821.75094400551790
2101.199.57567548705281.52432451294723
3100.799.636426201751.06357379825002
4100.199.64516272443150.454837275568457
599.999.70018811860980.199811881390184
699.799.7369545689163-0.036954568916286
799.599.7454910502785-0.245491050278510
899.299.7489264779977-0.548926477997658
99999.8352617876403-0.835261787640314
109999.879219378478-0.879219378478088
1199.399.9052801692118-0.60528016921181
1299.599.9872214678056-0.487221467805595
1399.7100.044626663886-0.344626663886324
14100100.090101809560-0.0901018095604436
15100.4100.1944925727670.205507427232691
16100.6100.2374396100440.362560389956380
17100.7100.3044985242760.395501475723556
18100.7100.3354948172170.364505182783457
19100.6100.3598242158420.240175784158466
20100.5100.4159360413230.084063958676896
21100.6100.5637288728490.0362711271506085
22100.5100.599277830299-0.0992778302985136
23100.4100.641404008368-0.241404008367877
24100.3100.697132996152-0.397132996152111
25100.4100.717337404813-0.317337404812844
26100.4100.756887188649-0.356887188648694
27100.4100.808787799459-0.408787799459418
28100.4100.830965029407-0.430965029407405
29100.4100.883586478765-0.483586478765392
30100.5101.016183067999-0.516183067998663
31100.6101.150900785015-0.550900785014549
32100.6101.230341567117-0.630341567116635
33100.5101.330169318850-0.830169318849678
34100.5101.421781580537-0.921781580536887
35100.7101.435160441422-0.735160441422346
36101.1101.499632614457-0.399632614456875
37101.5101.564770442226-0.0647704422264223
38101.9101.6755556296760.224444370324485
39102.1101.7690062021080.330993797892331
40102.1101.7490471424290.350952857570714
41102.1101.7708760245630.329123975437433
42102.4101.8022827471060.59771725289388
43102.8101.8472474425170.952752557482888
44103.1101.8639718220191.23602817798094
45103.1101.9013004574131.19869954258737
46102.9101.9402397703260.959760229674336
47102.4101.9701151420800.429884857920173
48101.9102.010861724843-0.11086172484343
49101.3102.006233418000-0.706233418000384
50100.7102.023647595155-1.32364759515521
51100.6102.082939387817-1.48293938781658
52101102.109196770881-1.10919677088137
53101.5102.180077164111-0.680077164111174
54101.9102.212249562049-0.312249562049432
55102.1102.262905088097-0.162905088096713
56102.3102.2941221162860.00587788371426798
57102.5102.2915356104950.208464389504791
58102.9102.3015999936590.598400006341438
59103.6102.3180829439821.28191705601799
60104.3102.3415811364351.95841886356474

\begin{tabular}{lllllllll}
\hline
Multiple Linear Regression - Actuals, Interpolation, and Residuals \tabularnewline
Time or Index & Actuals & InterpolationForecast & ResidualsPrediction Error \tabularnewline
1 & 101.2 & 99.449055994482 & 1.75094400551790 \tabularnewline
2 & 101.1 & 99.5756754870528 & 1.52432451294723 \tabularnewline
3 & 100.7 & 99.63642620175 & 1.06357379825002 \tabularnewline
4 & 100.1 & 99.6451627244315 & 0.454837275568457 \tabularnewline
5 & 99.9 & 99.7001881186098 & 0.199811881390184 \tabularnewline
6 & 99.7 & 99.7369545689163 & -0.036954568916286 \tabularnewline
7 & 99.5 & 99.7454910502785 & -0.245491050278510 \tabularnewline
8 & 99.2 & 99.7489264779977 & -0.548926477997658 \tabularnewline
9 & 99 & 99.8352617876403 & -0.835261787640314 \tabularnewline
10 & 99 & 99.879219378478 & -0.879219378478088 \tabularnewline
11 & 99.3 & 99.9052801692118 & -0.60528016921181 \tabularnewline
12 & 99.5 & 99.9872214678056 & -0.487221467805595 \tabularnewline
13 & 99.7 & 100.044626663886 & -0.344626663886324 \tabularnewline
14 & 100 & 100.090101809560 & -0.0901018095604436 \tabularnewline
15 & 100.4 & 100.194492572767 & 0.205507427232691 \tabularnewline
16 & 100.6 & 100.237439610044 & 0.362560389956380 \tabularnewline
17 & 100.7 & 100.304498524276 & 0.395501475723556 \tabularnewline
18 & 100.7 & 100.335494817217 & 0.364505182783457 \tabularnewline
19 & 100.6 & 100.359824215842 & 0.240175784158466 \tabularnewline
20 & 100.5 & 100.415936041323 & 0.084063958676896 \tabularnewline
21 & 100.6 & 100.563728872849 & 0.0362711271506085 \tabularnewline
22 & 100.5 & 100.599277830299 & -0.0992778302985136 \tabularnewline
23 & 100.4 & 100.641404008368 & -0.241404008367877 \tabularnewline
24 & 100.3 & 100.697132996152 & -0.397132996152111 \tabularnewline
25 & 100.4 & 100.717337404813 & -0.317337404812844 \tabularnewline
26 & 100.4 & 100.756887188649 & -0.356887188648694 \tabularnewline
27 & 100.4 & 100.808787799459 & -0.408787799459418 \tabularnewline
28 & 100.4 & 100.830965029407 & -0.430965029407405 \tabularnewline
29 & 100.4 & 100.883586478765 & -0.483586478765392 \tabularnewline
30 & 100.5 & 101.016183067999 & -0.516183067998663 \tabularnewline
31 & 100.6 & 101.150900785015 & -0.550900785014549 \tabularnewline
32 & 100.6 & 101.230341567117 & -0.630341567116635 \tabularnewline
33 & 100.5 & 101.330169318850 & -0.830169318849678 \tabularnewline
34 & 100.5 & 101.421781580537 & -0.921781580536887 \tabularnewline
35 & 100.7 & 101.435160441422 & -0.735160441422346 \tabularnewline
36 & 101.1 & 101.499632614457 & -0.399632614456875 \tabularnewline
37 & 101.5 & 101.564770442226 & -0.0647704422264223 \tabularnewline
38 & 101.9 & 101.675555629676 & 0.224444370324485 \tabularnewline
39 & 102.1 & 101.769006202108 & 0.330993797892331 \tabularnewline
40 & 102.1 & 101.749047142429 & 0.350952857570714 \tabularnewline
41 & 102.1 & 101.770876024563 & 0.329123975437433 \tabularnewline
42 & 102.4 & 101.802282747106 & 0.59771725289388 \tabularnewline
43 & 102.8 & 101.847247442517 & 0.952752557482888 \tabularnewline
44 & 103.1 & 101.863971822019 & 1.23602817798094 \tabularnewline
45 & 103.1 & 101.901300457413 & 1.19869954258737 \tabularnewline
46 & 102.9 & 101.940239770326 & 0.959760229674336 \tabularnewline
47 & 102.4 & 101.970115142080 & 0.429884857920173 \tabularnewline
48 & 101.9 & 102.010861724843 & -0.11086172484343 \tabularnewline
49 & 101.3 & 102.006233418000 & -0.706233418000384 \tabularnewline
50 & 100.7 & 102.023647595155 & -1.32364759515521 \tabularnewline
51 & 100.6 & 102.082939387817 & -1.48293938781658 \tabularnewline
52 & 101 & 102.109196770881 & -1.10919677088137 \tabularnewline
53 & 101.5 & 102.180077164111 & -0.680077164111174 \tabularnewline
54 & 101.9 & 102.212249562049 & -0.312249562049432 \tabularnewline
55 & 102.1 & 102.262905088097 & -0.162905088096713 \tabularnewline
56 & 102.3 & 102.294122116286 & 0.00587788371426798 \tabularnewline
57 & 102.5 & 102.291535610495 & 0.208464389504791 \tabularnewline
58 & 102.9 & 102.301599993659 & 0.598400006341438 \tabularnewline
59 & 103.6 & 102.318082943982 & 1.28191705601799 \tabularnewline
60 & 104.3 & 102.341581136435 & 1.95841886356474 \tabularnewline
\hline
\end{tabular}
%Source: https://freestatistics.org/blog/index.php?pk=57587&T=4

[TABLE]
[ROW][C]Multiple Linear Regression - Actuals, Interpolation, and Residuals[/C][/ROW]
[ROW][C]Time or Index[/C][C]Actuals[/C][C]InterpolationForecast[/C][C]ResidualsPrediction Error[/C][/ROW]
[ROW][C]1[/C][C]101.2[/C][C]99.449055994482[/C][C]1.75094400551790[/C][/ROW]
[ROW][C]2[/C][C]101.1[/C][C]99.5756754870528[/C][C]1.52432451294723[/C][/ROW]
[ROW][C]3[/C][C]100.7[/C][C]99.63642620175[/C][C]1.06357379825002[/C][/ROW]
[ROW][C]4[/C][C]100.1[/C][C]99.6451627244315[/C][C]0.454837275568457[/C][/ROW]
[ROW][C]5[/C][C]99.9[/C][C]99.7001881186098[/C][C]0.199811881390184[/C][/ROW]
[ROW][C]6[/C][C]99.7[/C][C]99.7369545689163[/C][C]-0.036954568916286[/C][/ROW]
[ROW][C]7[/C][C]99.5[/C][C]99.7454910502785[/C][C]-0.245491050278510[/C][/ROW]
[ROW][C]8[/C][C]99.2[/C][C]99.7489264779977[/C][C]-0.548926477997658[/C][/ROW]
[ROW][C]9[/C][C]99[/C][C]99.8352617876403[/C][C]-0.835261787640314[/C][/ROW]
[ROW][C]10[/C][C]99[/C][C]99.879219378478[/C][C]-0.879219378478088[/C][/ROW]
[ROW][C]11[/C][C]99.3[/C][C]99.9052801692118[/C][C]-0.60528016921181[/C][/ROW]
[ROW][C]12[/C][C]99.5[/C][C]99.9872214678056[/C][C]-0.487221467805595[/C][/ROW]
[ROW][C]13[/C][C]99.7[/C][C]100.044626663886[/C][C]-0.344626663886324[/C][/ROW]
[ROW][C]14[/C][C]100[/C][C]100.090101809560[/C][C]-0.0901018095604436[/C][/ROW]
[ROW][C]15[/C][C]100.4[/C][C]100.194492572767[/C][C]0.205507427232691[/C][/ROW]
[ROW][C]16[/C][C]100.6[/C][C]100.237439610044[/C][C]0.362560389956380[/C][/ROW]
[ROW][C]17[/C][C]100.7[/C][C]100.304498524276[/C][C]0.395501475723556[/C][/ROW]
[ROW][C]18[/C][C]100.7[/C][C]100.335494817217[/C][C]0.364505182783457[/C][/ROW]
[ROW][C]19[/C][C]100.6[/C][C]100.359824215842[/C][C]0.240175784158466[/C][/ROW]
[ROW][C]20[/C][C]100.5[/C][C]100.415936041323[/C][C]0.084063958676896[/C][/ROW]
[ROW][C]21[/C][C]100.6[/C][C]100.563728872849[/C][C]0.0362711271506085[/C][/ROW]
[ROW][C]22[/C][C]100.5[/C][C]100.599277830299[/C][C]-0.0992778302985136[/C][/ROW]
[ROW][C]23[/C][C]100.4[/C][C]100.641404008368[/C][C]-0.241404008367877[/C][/ROW]
[ROW][C]24[/C][C]100.3[/C][C]100.697132996152[/C][C]-0.397132996152111[/C][/ROW]
[ROW][C]25[/C][C]100.4[/C][C]100.717337404813[/C][C]-0.317337404812844[/C][/ROW]
[ROW][C]26[/C][C]100.4[/C][C]100.756887188649[/C][C]-0.356887188648694[/C][/ROW]
[ROW][C]27[/C][C]100.4[/C][C]100.808787799459[/C][C]-0.408787799459418[/C][/ROW]
[ROW][C]28[/C][C]100.4[/C][C]100.830965029407[/C][C]-0.430965029407405[/C][/ROW]
[ROW][C]29[/C][C]100.4[/C][C]100.883586478765[/C][C]-0.483586478765392[/C][/ROW]
[ROW][C]30[/C][C]100.5[/C][C]101.016183067999[/C][C]-0.516183067998663[/C][/ROW]
[ROW][C]31[/C][C]100.6[/C][C]101.150900785015[/C][C]-0.550900785014549[/C][/ROW]
[ROW][C]32[/C][C]100.6[/C][C]101.230341567117[/C][C]-0.630341567116635[/C][/ROW]
[ROW][C]33[/C][C]100.5[/C][C]101.330169318850[/C][C]-0.830169318849678[/C][/ROW]
[ROW][C]34[/C][C]100.5[/C][C]101.421781580537[/C][C]-0.921781580536887[/C][/ROW]
[ROW][C]35[/C][C]100.7[/C][C]101.435160441422[/C][C]-0.735160441422346[/C][/ROW]
[ROW][C]36[/C][C]101.1[/C][C]101.499632614457[/C][C]-0.399632614456875[/C][/ROW]
[ROW][C]37[/C][C]101.5[/C][C]101.564770442226[/C][C]-0.0647704422264223[/C][/ROW]
[ROW][C]38[/C][C]101.9[/C][C]101.675555629676[/C][C]0.224444370324485[/C][/ROW]
[ROW][C]39[/C][C]102.1[/C][C]101.769006202108[/C][C]0.330993797892331[/C][/ROW]
[ROW][C]40[/C][C]102.1[/C][C]101.749047142429[/C][C]0.350952857570714[/C][/ROW]
[ROW][C]41[/C][C]102.1[/C][C]101.770876024563[/C][C]0.329123975437433[/C][/ROW]
[ROW][C]42[/C][C]102.4[/C][C]101.802282747106[/C][C]0.59771725289388[/C][/ROW]
[ROW][C]43[/C][C]102.8[/C][C]101.847247442517[/C][C]0.952752557482888[/C][/ROW]
[ROW][C]44[/C][C]103.1[/C][C]101.863971822019[/C][C]1.23602817798094[/C][/ROW]
[ROW][C]45[/C][C]103.1[/C][C]101.901300457413[/C][C]1.19869954258737[/C][/ROW]
[ROW][C]46[/C][C]102.9[/C][C]101.940239770326[/C][C]0.959760229674336[/C][/ROW]
[ROW][C]47[/C][C]102.4[/C][C]101.970115142080[/C][C]0.429884857920173[/C][/ROW]
[ROW][C]48[/C][C]101.9[/C][C]102.010861724843[/C][C]-0.11086172484343[/C][/ROW]
[ROW][C]49[/C][C]101.3[/C][C]102.006233418000[/C][C]-0.706233418000384[/C][/ROW]
[ROW][C]50[/C][C]100.7[/C][C]102.023647595155[/C][C]-1.32364759515521[/C][/ROW]
[ROW][C]51[/C][C]100.6[/C][C]102.082939387817[/C][C]-1.48293938781658[/C][/ROW]
[ROW][C]52[/C][C]101[/C][C]102.109196770881[/C][C]-1.10919677088137[/C][/ROW]
[ROW][C]53[/C][C]101.5[/C][C]102.180077164111[/C][C]-0.680077164111174[/C][/ROW]
[ROW][C]54[/C][C]101.9[/C][C]102.212249562049[/C][C]-0.312249562049432[/C][/ROW]
[ROW][C]55[/C][C]102.1[/C][C]102.262905088097[/C][C]-0.162905088096713[/C][/ROW]
[ROW][C]56[/C][C]102.3[/C][C]102.294122116286[/C][C]0.00587788371426798[/C][/ROW]
[ROW][C]57[/C][C]102.5[/C][C]102.291535610495[/C][C]0.208464389504791[/C][/ROW]
[ROW][C]58[/C][C]102.9[/C][C]102.301599993659[/C][C]0.598400006341438[/C][/ROW]
[ROW][C]59[/C][C]103.6[/C][C]102.318082943982[/C][C]1.28191705601799[/C][/ROW]
[ROW][C]60[/C][C]104.3[/C][C]102.341581136435[/C][C]1.95841886356474[/C][/ROW]
[/TABLE]
Source: https://freestatistics.org/blog/index.php?pk=57587&T=4

Globally Unique Identifier (entire table): ba.freestatistics.org/blog/index.php?pk=57587&T=4

As an alternative you can also use a QR Code:  

The GUIDs for individual cells are displayed in the table below:

Multiple Linear Regression - Actuals, Interpolation, and Residuals
Time or IndexActualsInterpolationForecastResidualsPrediction Error
1101.299.4490559944821.75094400551790
2101.199.57567548705281.52432451294723
3100.799.636426201751.06357379825002
4100.199.64516272443150.454837275568457
599.999.70018811860980.199811881390184
699.799.7369545689163-0.036954568916286
799.599.7454910502785-0.245491050278510
899.299.7489264779977-0.548926477997658
99999.8352617876403-0.835261787640314
109999.879219378478-0.879219378478088
1199.399.9052801692118-0.60528016921181
1299.599.9872214678056-0.487221467805595
1399.7100.044626663886-0.344626663886324
14100100.090101809560-0.0901018095604436
15100.4100.1944925727670.205507427232691
16100.6100.2374396100440.362560389956380
17100.7100.3044985242760.395501475723556
18100.7100.3354948172170.364505182783457
19100.6100.3598242158420.240175784158466
20100.5100.4159360413230.084063958676896
21100.6100.5637288728490.0362711271506085
22100.5100.599277830299-0.0992778302985136
23100.4100.641404008368-0.241404008367877
24100.3100.697132996152-0.397132996152111
25100.4100.717337404813-0.317337404812844
26100.4100.756887188649-0.356887188648694
27100.4100.808787799459-0.408787799459418
28100.4100.830965029407-0.430965029407405
29100.4100.883586478765-0.483586478765392
30100.5101.016183067999-0.516183067998663
31100.6101.150900785015-0.550900785014549
32100.6101.230341567117-0.630341567116635
33100.5101.330169318850-0.830169318849678
34100.5101.421781580537-0.921781580536887
35100.7101.435160441422-0.735160441422346
36101.1101.499632614457-0.399632614456875
37101.5101.564770442226-0.0647704422264223
38101.9101.6755556296760.224444370324485
39102.1101.7690062021080.330993797892331
40102.1101.7490471424290.350952857570714
41102.1101.7708760245630.329123975437433
42102.4101.8022827471060.59771725289388
43102.8101.8472474425170.952752557482888
44103.1101.8639718220191.23602817798094
45103.1101.9013004574131.19869954258737
46102.9101.9402397703260.959760229674336
47102.4101.9701151420800.429884857920173
48101.9102.010861724843-0.11086172484343
49101.3102.006233418000-0.706233418000384
50100.7102.023647595155-1.32364759515521
51100.6102.082939387817-1.48293938781658
52101102.109196770881-1.10919677088137
53101.5102.180077164111-0.680077164111174
54101.9102.212249562049-0.312249562049432
55102.1102.262905088097-0.162905088096713
56102.3102.2941221162860.00587788371426798
57102.5102.2915356104950.208464389504791
58102.9102.3015999936590.598400006341438
59103.6102.3180829439821.28191705601799
60104.3102.3415811364351.95841886356474


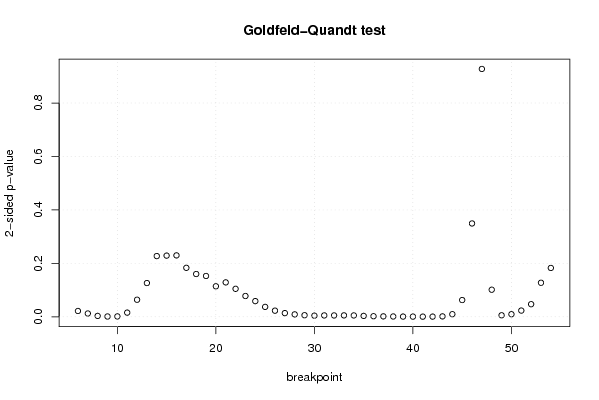
Goldfeld-Quandt test for Heteroskedasticity
p-valuesAlternative Hypothesis
breakpoint indexgreater2-sidedless
60.01077684023396610.02155368046793220.989223159766034
70.006088385543836470.01217677108767290.993911614456163
80.001557836979212210.003115673958424430.998442163020788
90.000477287048735820.000954574097471640.999522712951264
100.0006452737890066020.001290547578013200.999354726210993
110.00770018717991870.01540037435983740.992299812820081
120.03182092030402360.06364184060804730.968179079695976
130.063088048509260.126176097018520.93691195149074
140.1135605888406540.2271211776813070.886439411159346
150.1144095042501120.2288190085002240.885590495749888
160.1148537746301690.2297075492603380.885146225369831
170.09156668952549150.1831333790509830.908433310474508
180.07998741641361220.1599748328272240.920012583586388
190.07631387499791860.1526277499958370.923686125002081
200.05702269338783430.1140453867756690.942977306612166
210.06432044483470240.1286408896694050.935679555165298
220.05228276336969430.1045655267393890.947717236630306
230.03882948607239950.0776589721447990.9611705139276
240.02925491821368680.05850983642737360.970745081786313
250.01843102724968150.03686205449936300.981568972750319
260.01137816182473250.0227563236494650.988621838175267
270.006785875364278570.01357175072855710.993214124635721
280.004442584864004670.008885169728009350.995557415135995
290.002848267183087000.005696534366173990.997151732816913
300.002049175323561740.004098350647123490.997950824676438
310.002506658165574110.005013316331148220.997493341834426
320.002455747743702030.004911495487404070.997544252256298
330.002546287332872570.005092574665745130.997453712667127
340.002485791903143520.004971583806287040.997514208096856
350.001585968727751840.003171937455503690.998414031272248
360.000973376920175360.001946753840350720.999026623079825
370.0006926263984477900.001385252796895580.999307373601552
380.0004742259847176920.0009484519694353850.999525774015282
390.0002994262712528420.0005988525425056840.999700573728747
400.000225661256582650.00045132251316530.999774338743417
410.0001744509487001170.0003489018974002340.9998255490513
420.0002260309887097890.0004520619774195780.99977396901129
430.0006938449139843430.001387689827968690.999306155086016
440.004761683054405480.009523366108810970.995238316945595
450.03124037855946890.06248075711893770.968759621440531
460.1746178381170560.3492356762341120.825382161882944
470.5362260594843850.927547881031230.463773940515615
480.9494177330948740.1011645338102510.0505822669051257
490.9972655104624710.005468979075057950.00273448953752898
500.9952904538022950.009419092395410170.00470954619770509
510.988442029761420.02311594047716090.0115579702385804
520.9765265866704270.04694682665914690.0234734133295734
530.9364122645395780.1271754709208430.0635877354604216
540.9087016459192440.1825967081615130.0912983540807564

\begin{tabular}{lllllllll}
\hline
Goldfeld-Quandt test for Heteroskedasticity \tabularnewline
p-values & Alternative Hypothesis \tabularnewline
breakpoint index & greater & 2-sided & less \tabularnewline
6 & 0.0107768402339661 & 0.0215536804679322 & 0.989223159766034 \tabularnewline
7 & 0.00608838554383647 & 0.0121767710876729 & 0.993911614456163 \tabularnewline
8 & 0.00155783697921221 & 0.00311567395842443 & 0.998442163020788 \tabularnewline
9 & 0.00047728704873582 & 0.00095457409747164 & 0.999522712951264 \tabularnewline
10 & 0.000645273789006602 & 0.00129054757801320 & 0.999354726210993 \tabularnewline
11 & 0.0077001871799187 & 0.0154003743598374 & 0.992299812820081 \tabularnewline
12 & 0.0318209203040236 & 0.0636418406080473 & 0.968179079695976 \tabularnewline
13 & 0.06308804850926 & 0.12617609701852 & 0.93691195149074 \tabularnewline
14 & 0.113560588840654 & 0.227121177681307 & 0.886439411159346 \tabularnewline
15 & 0.114409504250112 & 0.228819008500224 & 0.885590495749888 \tabularnewline
16 & 0.114853774630169 & 0.229707549260338 & 0.885146225369831 \tabularnewline
17 & 0.0915666895254915 & 0.183133379050983 & 0.908433310474508 \tabularnewline
18 & 0.0799874164136122 & 0.159974832827224 & 0.920012583586388 \tabularnewline
19 & 0.0763138749979186 & 0.152627749995837 & 0.923686125002081 \tabularnewline
20 & 0.0570226933878343 & 0.114045386775669 & 0.942977306612166 \tabularnewline
21 & 0.0643204448347024 & 0.128640889669405 & 0.935679555165298 \tabularnewline
22 & 0.0522827633696943 & 0.104565526739389 & 0.947717236630306 \tabularnewline
23 & 0.0388294860723995 & 0.077658972144799 & 0.9611705139276 \tabularnewline
24 & 0.0292549182136868 & 0.0585098364273736 & 0.970745081786313 \tabularnewline
25 & 0.0184310272496815 & 0.0368620544993630 & 0.981568972750319 \tabularnewline
26 & 0.0113781618247325 & 0.022756323649465 & 0.988621838175267 \tabularnewline
27 & 0.00678587536427857 & 0.0135717507285571 & 0.993214124635721 \tabularnewline
28 & 0.00444258486400467 & 0.00888516972800935 & 0.995557415135995 \tabularnewline
29 & 0.00284826718308700 & 0.00569653436617399 & 0.997151732816913 \tabularnewline
30 & 0.00204917532356174 & 0.00409835064712349 & 0.997950824676438 \tabularnewline
31 & 0.00250665816557411 & 0.00501331633114822 & 0.997493341834426 \tabularnewline
32 & 0.00245574774370203 & 0.00491149548740407 & 0.997544252256298 \tabularnewline
33 & 0.00254628733287257 & 0.00509257466574513 & 0.997453712667127 \tabularnewline
34 & 0.00248579190314352 & 0.00497158380628704 & 0.997514208096856 \tabularnewline
35 & 0.00158596872775184 & 0.00317193745550369 & 0.998414031272248 \tabularnewline
36 & 0.00097337692017536 & 0.00194675384035072 & 0.999026623079825 \tabularnewline
37 & 0.000692626398447790 & 0.00138525279689558 & 0.999307373601552 \tabularnewline
38 & 0.000474225984717692 & 0.000948451969435385 & 0.999525774015282 \tabularnewline
39 & 0.000299426271252842 & 0.000598852542505684 & 0.999700573728747 \tabularnewline
40 & 0.00022566125658265 & 0.0004513225131653 & 0.999774338743417 \tabularnewline
41 & 0.000174450948700117 & 0.000348901897400234 & 0.9998255490513 \tabularnewline
42 & 0.000226030988709789 & 0.000452061977419578 & 0.99977396901129 \tabularnewline
43 & 0.000693844913984343 & 0.00138768982796869 & 0.999306155086016 \tabularnewline
44 & 0.00476168305440548 & 0.00952336610881097 & 0.995238316945595 \tabularnewline
45 & 0.0312403785594689 & 0.0624807571189377 & 0.968759621440531 \tabularnewline
46 & 0.174617838117056 & 0.349235676234112 & 0.825382161882944 \tabularnewline
47 & 0.536226059484385 & 0.92754788103123 & 0.463773940515615 \tabularnewline
48 & 0.949417733094874 & 0.101164533810251 & 0.0505822669051257 \tabularnewline
49 & 0.997265510462471 & 0.00546897907505795 & 0.00273448953752898 \tabularnewline
50 & 0.995290453802295 & 0.00941909239541017 & 0.00470954619770509 \tabularnewline
51 & 0.98844202976142 & 0.0231159404771609 & 0.0115579702385804 \tabularnewline
52 & 0.976526586670427 & 0.0469468266591469 & 0.0234734133295734 \tabularnewline
53 & 0.936412264539578 & 0.127175470920843 & 0.0635877354604216 \tabularnewline
54 & 0.908701645919244 & 0.182596708161513 & 0.0912983540807564 \tabularnewline
\hline
\end{tabular}
%Source: https://freestatistics.org/blog/index.php?pk=57587&T=5

[TABLE]
[ROW][C]Goldfeld-Quandt test for Heteroskedasticity[/C][/ROW]
[ROW][C]p-values[/C][C]Alternative Hypothesis[/C][/ROW]
[ROW][C]breakpoint index[/C][C]greater[/C][C]2-sided[/C][C]less[/C][/ROW]
[ROW][C]6[/C][C]0.0107768402339661[/C][C]0.0215536804679322[/C][C]0.989223159766034[/C][/ROW]
[ROW][C]7[/C][C]0.00608838554383647[/C][C]0.0121767710876729[/C][C]0.993911614456163[/C][/ROW]
[ROW][C]8[/C][C]0.00155783697921221[/C][C]0.00311567395842443[/C][C]0.998442163020788[/C][/ROW]
[ROW][C]9[/C][C]0.00047728704873582[/C][C]0.00095457409747164[/C][C]0.999522712951264[/C][/ROW]
[ROW][C]10[/C][C]0.000645273789006602[/C][C]0.00129054757801320[/C][C]0.999354726210993[/C][/ROW]
[ROW][C]11[/C][C]0.0077001871799187[/C][C]0.0154003743598374[/C][C]0.992299812820081[/C][/ROW]
[ROW][C]12[/C][C]0.0318209203040236[/C][C]0.0636418406080473[/C][C]0.968179079695976[/C][/ROW]
[ROW][C]13[/C][C]0.06308804850926[/C][C]0.12617609701852[/C][C]0.93691195149074[/C][/ROW]
[ROW][C]14[/C][C]0.113560588840654[/C][C]0.227121177681307[/C][C]0.886439411159346[/C][/ROW]
[ROW][C]15[/C][C]0.114409504250112[/C][C]0.228819008500224[/C][C]0.885590495749888[/C][/ROW]
[ROW][C]16[/C][C]0.114853774630169[/C][C]0.229707549260338[/C][C]0.885146225369831[/C][/ROW]
[ROW][C]17[/C][C]0.0915666895254915[/C][C]0.183133379050983[/C][C]0.908433310474508[/C][/ROW]
[ROW][C]18[/C][C]0.0799874164136122[/C][C]0.159974832827224[/C][C]0.920012583586388[/C][/ROW]
[ROW][C]19[/C][C]0.0763138749979186[/C][C]0.152627749995837[/C][C]0.923686125002081[/C][/ROW]
[ROW][C]20[/C][C]0.0570226933878343[/C][C]0.114045386775669[/C][C]0.942977306612166[/C][/ROW]
[ROW][C]21[/C][C]0.0643204448347024[/C][C]0.128640889669405[/C][C]0.935679555165298[/C][/ROW]
[ROW][C]22[/C][C]0.0522827633696943[/C][C]0.104565526739389[/C][C]0.947717236630306[/C][/ROW]
[ROW][C]23[/C][C]0.0388294860723995[/C][C]0.077658972144799[/C][C]0.9611705139276[/C][/ROW]
[ROW][C]24[/C][C]0.0292549182136868[/C][C]0.0585098364273736[/C][C]0.970745081786313[/C][/ROW]
[ROW][C]25[/C][C]0.0184310272496815[/C][C]0.0368620544993630[/C][C]0.981568972750319[/C][/ROW]
[ROW][C]26[/C][C]0.0113781618247325[/C][C]0.022756323649465[/C][C]0.988621838175267[/C][/ROW]
[ROW][C]27[/C][C]0.00678587536427857[/C][C]0.0135717507285571[/C][C]0.993214124635721[/C][/ROW]
[ROW][C]28[/C][C]0.00444258486400467[/C][C]0.00888516972800935[/C][C]0.995557415135995[/C][/ROW]
[ROW][C]29[/C][C]0.00284826718308700[/C][C]0.00569653436617399[/C][C]0.997151732816913[/C][/ROW]
[ROW][C]30[/C][C]0.00204917532356174[/C][C]0.00409835064712349[/C][C]0.997950824676438[/C][/ROW]
[ROW][C]31[/C][C]0.00250665816557411[/C][C]0.00501331633114822[/C][C]0.997493341834426[/C][/ROW]
[ROW][C]32[/C][C]0.00245574774370203[/C][C]0.00491149548740407[/C][C]0.997544252256298[/C][/ROW]
[ROW][C]33[/C][C]0.00254628733287257[/C][C]0.00509257466574513[/C][C]0.997453712667127[/C][/ROW]
[ROW][C]34[/C][C]0.00248579190314352[/C][C]0.00497158380628704[/C][C]0.997514208096856[/C][/ROW]
[ROW][C]35[/C][C]0.00158596872775184[/C][C]0.00317193745550369[/C][C]0.998414031272248[/C][/ROW]
[ROW][C]36[/C][C]0.00097337692017536[/C][C]0.00194675384035072[/C][C]0.999026623079825[/C][/ROW]
[ROW][C]37[/C][C]0.000692626398447790[/C][C]0.00138525279689558[/C][C]0.999307373601552[/C][/ROW]
[ROW][C]38[/C][C]0.000474225984717692[/C][C]0.000948451969435385[/C][C]0.999525774015282[/C][/ROW]
[ROW][C]39[/C][C]0.000299426271252842[/C][C]0.000598852542505684[/C][C]0.999700573728747[/C][/ROW]
[ROW][C]40[/C][C]0.00022566125658265[/C][C]0.0004513225131653[/C][C]0.999774338743417[/C][/ROW]
[ROW][C]41[/C][C]0.000174450948700117[/C][C]0.000348901897400234[/C][C]0.9998255490513[/C][/ROW]
[ROW][C]42[/C][C]0.000226030988709789[/C][C]0.000452061977419578[/C][C]0.99977396901129[/C][/ROW]
[ROW][C]43[/C][C]0.000693844913984343[/C][C]0.00138768982796869[/C][C]0.999306155086016[/C][/ROW]
[ROW][C]44[/C][C]0.00476168305440548[/C][C]0.00952336610881097[/C][C]0.995238316945595[/C][/ROW]
[ROW][C]45[/C][C]0.0312403785594689[/C][C]0.0624807571189377[/C][C]0.968759621440531[/C][/ROW]
[ROW][C]46[/C][C]0.174617838117056[/C][C]0.349235676234112[/C][C]0.825382161882944[/C][/ROW]
[ROW][C]47[/C][C]0.536226059484385[/C][C]0.92754788103123[/C][C]0.463773940515615[/C][/ROW]
[ROW][C]48[/C][C]0.949417733094874[/C][C]0.101164533810251[/C][C]0.0505822669051257[/C][/ROW]
[ROW][C]49[/C][C]0.997265510462471[/C][C]0.00546897907505795[/C][C]0.00273448953752898[/C][/ROW]
[ROW][C]50[/C][C]0.995290453802295[/C][C]0.00941909239541017[/C][C]0.00470954619770509[/C][/ROW]
[ROW][C]51[/C][C]0.98844202976142[/C][C]0.0231159404771609[/C][C]0.0115579702385804[/C][/ROW]
[ROW][C]52[/C][C]0.976526586670427[/C][C]0.0469468266591469[/C][C]0.0234734133295734[/C][/ROW]
[ROW][C]53[/C][C]0.936412264539578[/C][C]0.127175470920843[/C][C]0.0635877354604216[/C][/ROW]
[ROW][C]54[/C][C]0.908701645919244[/C][C]0.182596708161513[/C][C]0.0912983540807564[/C][/ROW]
[/TABLE]
Source: https://freestatistics.org/blog/index.php?pk=57587&T=5

Globally Unique Identifier (entire table): ba.freestatistics.org/blog/index.php?pk=57587&T=5

As an alternative you can also use a QR Code:  

The GUIDs for individual cells are displayed in the table below:

Goldfeld-Quandt test for Heteroskedasticity
p-valuesAlternative Hypothesis
breakpoint indexgreater2-sidedless
60.01077684023396610.02155368046793220.989223159766034
70.006088385543836470.01217677108767290.993911614456163
80.001557836979212210.003115673958424430.998442163020788
90.000477287048735820.000954574097471640.999522712951264
100.0006452737890066020.001290547578013200.999354726210993
110.00770018717991870.01540037435983740.992299812820081
120.03182092030402360.06364184060804730.968179079695976
130.063088048509260.126176097018520.93691195149074
140.1135605888406540.2271211776813070.886439411159346
150.1144095042501120.2288190085002240.885590495749888
160.1148537746301690.2297075492603380.885146225369831
170.09156668952549150.1831333790509830.908433310474508
180.07998741641361220.1599748328272240.920012583586388
190.07631387499791860.1526277499958370.923686125002081
200.05702269338783430.1140453867756690.942977306612166
210.06432044483470240.1286408896694050.935679555165298
220.05228276336969430.1045655267393890.947717236630306
230.03882948607239950.0776589721447990.9611705139276
240.02925491821368680.05850983642737360.970745081786313
250.01843102724968150.03686205449936300.981568972750319
260.01137816182473250.0227563236494650.988621838175267
270.006785875364278570.01357175072855710.993214124635721
280.004442584864004670.008885169728009350.995557415135995
290.002848267183087000.005696534366173990.997151732816913
300.002049175323561740.004098350647123490.997950824676438
310.002506658165574110.005013316331148220.997493341834426
320.002455747743702030.004911495487404070.997544252256298
330.002546287332872570.005092574665745130.997453712667127
340.002485791903143520.004971583806287040.997514208096856
350.001585968727751840.003171937455503690.998414031272248
360.000973376920175360.001946753840350720.999026623079825
370.0006926263984477900.001385252796895580.999307373601552
380.0004742259847176920.0009484519694353850.999525774015282
390.0002994262712528420.0005988525425056840.999700573728747
400.000225661256582650.00045132251316530.999774338743417
410.0001744509487001170.0003489018974002340.9998255490513
420.0002260309887097890.0004520619774195780.99977396901129
430.0006938449139843430.001387689827968690.999306155086016
440.004761683054405480.009523366108810970.995238316945595
450.03124037855946890.06248075711893770.968759621440531
460.1746178381170560.3492356762341120.825382161882944
470.5362260594843850.927547881031230.463773940515615
480.9494177330948740.1011645338102510.0505822669051257
490.9972655104624710.005468979075057950.00273448953752898
500.9952904538022950.009419092395410170.00470954619770509
510.988442029761420.02311594047716090.0115579702385804
520.9765265866704270.04694682665914690.0234734133295734
530.9364122645395780.1271754709208430.0635877354604216
540.9087016459192440.1825967081615130.0912983540807564


Meta Analysis of Goldfeld-Quandt test for Heteroskedasticity
Description# significant tests% significant testsOK/NOK
1% type I error level220.448979591836735NOK
5% type I error level300.612244897959184NOK
10% type I error level340.693877551020408NOK

\begin{tabular}{lllllllll}
\hline
Meta Analysis of Goldfeld-Quandt test for Heteroskedasticity \tabularnewline
Description & # significant tests & % significant tests & OK/NOK \tabularnewline
1% type I error level & 22 & 0.448979591836735 & NOK \tabularnewline
5% type I error level & 30 & 0.612244897959184 & NOK \tabularnewline
10% type I error level & 34 & 0.693877551020408 & NOK \tabularnewline
\hline
\end{tabular}
%Source: https://freestatistics.org/blog/index.php?pk=57587&T=6

[TABLE]
[ROW][C]Meta Analysis of Goldfeld-Quandt test for Heteroskedasticity[/C][/ROW]
[ROW][C]Description[/C][C]# significant tests[/C][C]% significant tests[/C][C]OK/NOK[/C][/ROW]
[ROW][C]1% type I error level[/C][C]22[/C][C]0.448979591836735[/C][C]NOK[/C][/ROW]
[ROW][C]5% type I error level[/C][C]30[/C][C]0.612244897959184[/C][C]NOK[/C][/ROW]
[ROW][C]10% type I error level[/C][C]34[/C][C]0.693877551020408[/C][C]NOK[/C][/ROW]
[/TABLE]
Source: https://freestatistics.org/blog/index.php?pk=57587&T=6

Globally Unique Identifier (entire table): ba.freestatistics.org/blog/index.php?pk=57587&T=6

As an alternative you can also use a QR Code:  

The GUIDs for individual cells are displayed in the table below:

Meta Analysis of Goldfeld-Quandt test for Heteroskedasticity
Description# significant tests% significant testsOK/NOK
1% type I error level220.448979591836735NOK
5% type I error level300.612244897959184NOK
10% type I error level340.693877551020408NOK


Parameters (Session):
par1 = 1 ; par2 = Include Monthly Dummies ; par3 = Linear Trend ;
Parameters (R input):
par1 = 2 ; par2 = Do not include Seasonal Dummies ; par3 = Linear Trend ;
R code (references can be found in the software module):
library(lattice)
library(lmtest)
n25 <- 25 #minimum number of obs. for Goldfeld-Quandt test
par1 <- as.numeric(par1)
x <- t(y)
k <- length(x[1,])
n <- length(x[,1])
x1 <- cbind(x[,par1], x[,1:k!=par1])
mycolnames <- c(colnames(x)[par1], colnames(x)[1:k!=par1])
colnames(x1) <- mycolnames #colnames(x)[par1]
x <- x1
if (par3 == 'First Differences'){
x2 <- array(0, dim=c(n-1,k), dimnames=list(1:(n-1), paste('(1-B)',colnames(x),sep='')))
for (i in 1:n-1) {
for (j in 1:k) {
x2[i,j] <- x[i+1,j] - x[i,j]
}
}
x <- x2
}
if (par2 == 'Include Monthly Dummies'){
x2 <- array(0, dim=c(n,11), dimnames=list(1:n, paste('M', seq(1:11), sep ='')))
for (i in 1:11){
x2[seq(i,n,12),i] <- 1
}
x <- cbind(x, x2)
}
if (par2 == 'Include Quarterly Dummies'){
x2 <- array(0, dim=c(n,3), dimnames=list(1:n, paste('Q', seq(1:3), sep ='')))
for (i in 1:3){
x2[seq(i,n,4),i] <- 1
}
x <- cbind(x, x2)
}
k <- length(x[1,])
if (par3 == 'Linear Trend'){
x <- cbind(x, c(1:n))
colnames(x)[k+1] <- 't'
}
x
k <- length(x[1,])
df <- as.data.frame(x)
(mylm <- lm(df))
(mysum <- summary(mylm))
if (n > n25) {
kp3 <- k + 3
nmkm3 <- n - k - 3
gqarr <- array(NA, dim=c(nmkm3-kp3+1,3))
numgqtests <- 0
numsignificant1 <- 0
numsignificant5 <- 0
numsignificant10 <- 0
for (mypoint in kp3:nmkm3) {
j <- 0
numgqtests <- numgqtests + 1
for (myalt in c('greater', 'two.sided', 'less')) {
j <- j + 1
gqarr[mypoint-kp3+1,j] <- gqtest(mylm, point=mypoint, alternative=myalt)$p.value
}
if (gqarr[mypoint-kp3+1,2] < 0.01) numsignificant1 <- numsignificant1 + 1
if (gqarr[mypoint-kp3+1,2] < 0.05) numsignificant5 <- numsignificant5 + 1
if (gqarr[mypoint-kp3+1,2] < 0.10) numsignificant10 <- numsignificant10 + 1
}
gqarr
}
bitmap(file='test0.png')
plot(x[,1], type='l', main='Actuals and Interpolation', ylab='value of Actuals and Interpolation (dots)', xlab='time or index')
points(x[,1]-mysum$resid)
grid()
dev.off()
bitmap(file='test1.png')
plot(mysum$resid, type='b', pch=19, main='Residuals', ylab='value of Residuals', xlab='time or index')
grid()
dev.off()
bitmap(file='test2.png')
hist(mysum$resid, main='Residual Histogram', xlab='values of Residuals')
grid()
dev.off()
bitmap(file='test3.png')
densityplot(~mysum$resid,col='black',main='Residual Density Plot', xlab='values of Residuals')
dev.off()
bitmap(file='test4.png')
qqnorm(mysum$resid, main='Residual Normal Q-Q Plot')
qqline(mysum$resid)
grid()
dev.off()
(myerror <- as.ts(mysum$resid))
bitmap(file='test5.png')
dum <- cbind(lag(myerror,k=1),myerror)
dum
dum1 <- dum[2:length(myerror),]
dum1
z <- as.data.frame(dum1)
z
plot(z,main=paste('Residual Lag plot, lowess, and regression line'), ylab='values of Residuals', xlab='lagged values of Residuals')
lines(lowess(z))
abline(lm(z))
grid()
dev.off()
bitmap(file='test6.png')
acf(mysum$resid, lag.max=length(mysum$resid)/2, main='Residual Autocorrelation Function')
grid()
dev.off()
bitmap(file='test7.png')
pacf(mysum$resid, lag.max=length(mysum$resid)/2, main='Residual Partial Autocorrelation Function')
grid()
dev.off()
bitmap(file='test8.png')
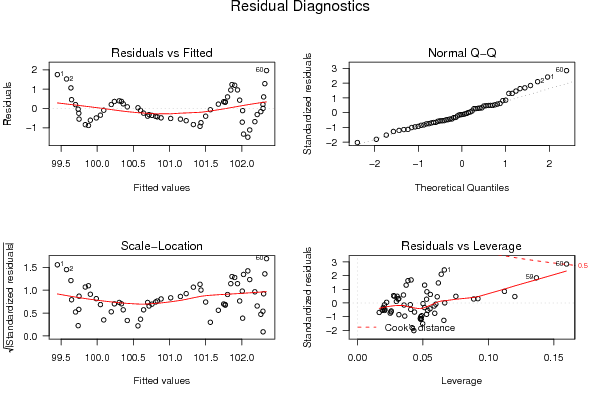
opar <- par(mfrow = c(2,2), oma = c(0, 0, 1.1, 0))
plot(mylm, las = 1, sub='Residual Diagnostics')
par(opar)
dev.off()
if (n > n25) {
bitmap(file='test9.png')
plot(kp3:nmkm3,gqarr[,2], main='Goldfeld-Quandt test',ylab='2-sided p-value',xlab='breakpoint')
grid()
dev.off()
}
load(file='createtable')
a<-table.start()
a<-table.row.start(a)
a<-table.element(a, 'Multiple Linear Regression - Estimated Regression Equation', 1, TRUE)
a<-table.row.end(a)
myeq <- colnames(x)[1]
myeq <- paste(myeq, '[t] = ', sep='')
for (i in 1:k){
if (mysum$coefficients[i,1] > 0) myeq <- paste(myeq, '+', '')
myeq <- paste(myeq, mysum$coefficients[i,1], sep=' ')
if (rownames(mysum$coefficients)[i] != '(Intercept)') {
myeq <- paste(myeq, rownames(mysum$coefficients)[i], sep='')
if (rownames(mysum$coefficients)[i] != 't') myeq <- paste(myeq, '[t]', sep='')
}
}
myeq <- paste(myeq, ' + e[t]')
a<-table.row.start(a)
a<-table.element(a, myeq)
a<-table.row.end(a)
a<-table.end(a)
table.save(a,file='mytable1.tab')
a<-table.start()
a<-table.row.start(a)
a<-table.element(a,hyperlink('ols1.htm','Multiple Linear Regression - Ordinary Least Squares',''), 6, TRUE)
a<-table.row.end(a)
a<-table.row.start(a)
a<-table.element(a,'Variable',header=TRUE)
a<-table.element(a,'Parameter',header=TRUE)
a<-table.element(a,'S.D.',header=TRUE)
a<-table.element(a,'T-STAT
H0: parameter = 0',header=TRUE)
a<-table.element(a,'2-tail p-value',header=TRUE)
a<-table.element(a,'1-tail p-value',header=TRUE)
a<-table.row.end(a)
for (i in 1:k){
a<-table.row.start(a)
a<-table.element(a,rownames(mysum$coefficients)[i],header=TRUE)
a<-table.element(a,mysum$coefficients[i,1])
a<-table.element(a, round(mysum$coefficients[i,2],6))
a<-table.element(a, round(mysum$coefficients[i,3],4))
a<-table.element(a, round(mysum$coefficients[i,4],6))
a<-table.element(a, round(mysum$coefficients[i,4]/2,6))
a<-table.row.end(a)
}
a<-table.end(a)
table.save(a,file='mytable2.tab')
a<-table.start()
a<-table.row.start(a)
a<-table.element(a, 'Multiple Linear Regression - Regression Statistics', 2, TRUE)
a<-table.row.end(a)
a<-table.row.start(a)
a<-table.element(a, 'Multiple R',1,TRUE)
a<-table.element(a, sqrt(mysum$r.squared))
a<-table.row.end(a)
a<-table.row.start(a)
a<-table.element(a, 'R-squared',1,TRUE)
a<-table.element(a, mysum$r.squared)
a<-table.row.end(a)
a<-table.row.start(a)
a<-table.element(a, 'Adjusted R-squared',1,TRUE)
a<-table.element(a, mysum$adj.r.squared)
a<-table.row.end(a)
a<-table.row.start(a)
a<-table.element(a, 'F-TEST (value)',1,TRUE)
a<-table.element(a, mysum$fstatistic[1])
a<-table.row.end(a)
a<-table.row.start(a)
a<-table.element(a, 'F-TEST (DF numerator)',1,TRUE)
a<-table.element(a, mysum$fstatistic[2])
a<-table.row.end(a)
a<-table.row.start(a)
a<-table.element(a, 'F-TEST (DF denominator)',1,TRUE)
a<-table.element(a, mysum$fstatistic[3])
a<-table.row.end(a)
a<-table.row.start(a)
a<-table.element(a, 'p-value',1,TRUE)
a<-table.element(a, 1-pf(mysum$fstatistic[1],mysum$fstatistic[2],mysum$fstatistic[3]))
a<-table.row.end(a)
a<-table.row.start(a)
a<-table.element(a, 'Multiple Linear Regression - Residual Statistics', 2, TRUE)
a<-table.row.end(a)
a<-table.row.start(a)
a<-table.element(a, 'Residual Standard Deviation',1,TRUE)
a<-table.element(a, mysum$sigma)
a<-table.row.end(a)
a<-table.row.start(a)
a<-table.element(a, 'Sum Squared Residuals',1,TRUE)
a<-table.element(a, sum(myerror*myerror))
a<-table.row.end(a)
a<-table.end(a)
table.save(a,file='mytable3.tab')
a<-table.start()
a<-table.row.start(a)
a<-table.element(a, 'Multiple Linear Regression - Actuals, Interpolation, and Residuals', 4, TRUE)
a<-table.row.end(a)
a<-table.row.start(a)
a<-table.element(a, 'Time or Index', 1, TRUE)
a<-table.element(a, 'Actuals', 1, TRUE)
a<-table.element(a, 'Interpolation
Forecast', 1, TRUE)
a<-table.element(a, 'Residuals
Prediction Error', 1, TRUE)
a<-table.row.end(a)
for (i in 1:n) {
a<-table.row.start(a)
a<-table.element(a,i, 1, TRUE)
a<-table.element(a,x[i])
a<-table.element(a,x[i]-mysum$resid[i])
a<-table.element(a,mysum$resid[i])
a<-table.row.end(a)
}
a<-table.end(a)
table.save(a,file='mytable4.tab')
if (n > n25) {
a<-table.start()
a<-table.row.start(a)
a<-table.element(a,'Goldfeld-Quandt test for Heteroskedasticity',4,TRUE)
a<-table.row.end(a)
a<-table.row.start(a)
a<-table.element(a,'p-values',header=TRUE)
a<-table.element(a,'Alternative Hypothesis',3,header=TRUE)
a<-table.row.end(a)
a<-table.row.start(a)
a<-table.element(a,'breakpoint index',header=TRUE)
a<-table.element(a,'greater',header=TRUE)
a<-table.element(a,'2-sided',header=TRUE)
a<-table.element(a,'less',header=TRUE)
a<-table.row.end(a)
for (mypoint in kp3:nmkm3) {
a<-table.row.start(a)
a<-table.element(a,mypoint,header=TRUE)
a<-table.element(a,gqarr[mypoint-kp3+1,1])
a<-table.element(a,gqarr[mypoint-kp3+1,2])
a<-table.element(a,gqarr[mypoint-kp3+1,3])
a<-table.row.end(a)
}
a<-table.end(a)
table.save(a,file='mytable5.tab')
a<-table.start()
a<-table.row.start(a)
a<-table.element(a,'Meta Analysis of Goldfeld-Quandt test for Heteroskedasticity',4,TRUE)
a<-table.row.end(a)
a<-table.row.start(a)
a<-table.element(a,'Description',header=TRUE)
a<-table.element(a,'# significant tests',header=TRUE)
a<-table.element(a,'% significant tests',header=TRUE)
a<-table.element(a,'OK/NOK',header=TRUE)
a<-table.row.end(a)
a<-table.row.start(a)
a<-table.element(a,'1% type I error level',header=TRUE)
a<-table.element(a,numsignificant1)
a<-table.element(a,numsignificant1/numgqtests)
if (numsignificant1/numgqtests < 0.01) dum <- 'OK' else dum <- 'NOK'
a<-table.element(a,dum)
a<-table.row.end(a)
a<-table.row.start(a)
a<-table.element(a,'5% type I error level',header=TRUE)
a<-table.element(a,numsignificant5)
a<-table.element(a,numsignificant5/numgqtests)
if (numsignificant5/numgqtests < 0.05) dum <- 'OK' else dum <- 'NOK'
a<-table.element(a,dum)
a<-table.row.end(a)
a<-table.row.start(a)
a<-table.element(a,'10% type I error level',header=TRUE)
a<-table.element(a,numsignificant10)
a<-table.element(a,numsignificant10/numgqtests)
if (numsignificant10/numgqtests < 0.1) dum <- 'OK' else dum <- 'NOK'
a<-table.element(a,dum)
a<-table.row.end(a)
a<-table.end(a)
table.save(a,file='mytable6.tab')
}