Free Statistics

of Irreproducible Research!

Author's title

Author*The author of this computation has been verified*
R Software Modulerwasp_multipleregression.wasp
Title produced by softwareMultiple Regression
Date of computationWed, 18 Nov 2009 11:21:38 -0700
Cite this page as followsStatistical Computations at FreeStatistics.org, Office for Research Development and Education, URL https://freestatistics.org/blog/index.php?v=date/2009/Nov/18/t12585686045ffna0wkavad4b7.htm/, Retrieved Sat, 04 May 2024 06:49:04 +0000
Statistical Computations at FreeStatistics.org, Office for Research Development and Education, URL https://freestatistics.org/blog/index.php?pk=57578, Retrieved Sat, 04 May 2024 06:49:04 +0000
QR Codes:

Original text written by user:
IsPrivate?No (this computation is public)
User-defined keywords
Estimated Impact159
Family? (F = Feedback message, R = changed R code, M = changed R Module, P = changed Parameters, D = changed Data)
-     [Multiple Regression] [Q1 The Seatbeltlaw] [2007-11-14 19:27:43] [8cd6641b921d30ebe00b648d1481bba0]
- RM D  [Multiple Regression] [Seatbelt] [2009-11-12 14:06:21] [b98453cac15ba1066b407e146608df68]
-    D      [Multiple Regression] [SHw WS7] [2009-11-18 18:21:38] [d9efc2d105d810fc0b0ac636e31105d1] [Current]
-    D        [Multiple Regression] [REVIEW 7] [2009-11-24 20:27:08] [309ee52d0058ff0a6f7eec15e07b2d9f]
Feedback Forum

Post a new message
Dataseries X:
627	356
696	386
825	444
677	387
656	327
785	448
412	225
352	182
839	460
729	411
696	342
641	361
695	377
638	331
762	428
635	340
721	352
854	461
418	221
367	198
824	422
687	329
601	320
676	375
740	364
691	351
683	380
594	319
729	322
731	386
386	221
331	187
707	344
715	342
657	365
653	313
642	356
643	337
718	389
654	326
632	343
731	357
392	220
344	228
792	391
852	425
649	332
629	298
685	360
617	326
715	325
715	393
629	301
916	426
531	265
357	210
917	429
828	440
708	357
858	431


Summary of computational transaction
Raw Inputview raw input (R code)
Raw Outputview raw output of R engine
Computing time3 seconds
R Server'Gwilym Jenkins' @ 72.249.127.135

\begin{tabular}{lllllllll}
\hline
Summary of computational transaction \tabularnewline
Raw Input & view raw input (R code)  \tabularnewline
Raw Output & view raw output of R engine  \tabularnewline
Computing time & 3 seconds \tabularnewline
R Server & 'Gwilym Jenkins' @ 72.249.127.135 \tabularnewline
\hline
\end{tabular}
%Source: https://freestatistics.org/blog/index.php?pk=57578&T=0

[TABLE]
[ROW][C]Summary of computational transaction[/C][/ROW]
[ROW][C]Raw Input[/C][C]view raw input (R code) [/C][/ROW]
[ROW][C]Raw Output[/C][C]view raw output of R engine [/C][/ROW]
[ROW][C]Computing time[/C][C]3 seconds[/C][/ROW]
[ROW][C]R Server[/C][C]'Gwilym Jenkins' @ 72.249.127.135[/C][/ROW]
[/TABLE]
Source: https://freestatistics.org/blog/index.php?pk=57578&T=0

Globally Unique Identifier (entire table): ba.freestatistics.org/blog/index.php?pk=57578&T=0

As an alternative you can also use a QR Code:  

The GUIDs for individual cells are displayed in the table below:

Summary of computational transaction
Raw Inputview raw input (R code)
Raw Outputview raw output of R engine
Computing time3 seconds
R Server'Gwilym Jenkins' @ 72.249.127.135


Multiple Linear Regression - Estimated Regression Equation
Y[t] = + 186.680604490460 + 1.33076756412887X[t] -13.2908466500560M1[t] -13.1412155346012M2[t] + 7.03775201508341M3[t] -25.940348843195M4[t] + 23.5231157596390M5[t] + 37.4036877698205M6[t] -92.6131162897724M7[t] -131.963506840643M8[t] + 55.695729371469M9[t] + 27.5699702049618M10[t] -11.8235252685434M11[t] + 0.87495693625875t + e[t]

\begin{tabular}{lllllllll}
\hline
Multiple Linear Regression - Estimated Regression Equation \tabularnewline
Y[t] =  +  186.680604490460 +  1.33076756412887X[t] -13.2908466500560M1[t] -13.1412155346012M2[t] +  7.03775201508341M3[t] -25.940348843195M4[t] +  23.5231157596390M5[t] +  37.4036877698205M6[t] -92.6131162897724M7[t] -131.963506840643M8[t] +  55.695729371469M9[t] +  27.5699702049618M10[t] -11.8235252685434M11[t] +  0.87495693625875t  + e[t] \tabularnewline
\hline
\end{tabular}
%Source: https://freestatistics.org/blog/index.php?pk=57578&T=1

[TABLE]
[ROW][C]Multiple Linear Regression - Estimated Regression Equation[/C][/ROW]
[ROW][C]Y[t] =  +  186.680604490460 +  1.33076756412887X[t] -13.2908466500560M1[t] -13.1412155346012M2[t] +  7.03775201508341M3[t] -25.940348843195M4[t] +  23.5231157596390M5[t] +  37.4036877698205M6[t] -92.6131162897724M7[t] -131.963506840643M8[t] +  55.695729371469M9[t] +  27.5699702049618M10[t] -11.8235252685434M11[t] +  0.87495693625875t  + e[t][/C][/ROW]
[/TABLE]
Source: https://freestatistics.org/blog/index.php?pk=57578&T=1

Globally Unique Identifier (entire table): ba.freestatistics.org/blog/index.php?pk=57578&T=1

As an alternative you can also use a QR Code:  

The GUIDs for individual cells are displayed in the table below:

Multiple Linear Regression - Estimated Regression Equation
Y[t] = + 186.680604490460 + 1.33076756412887X[t] -13.2908466500560M1[t] -13.1412155346012M2[t] + 7.03775201508341M3[t] -25.940348843195M4[t] + 23.5231157596390M5[t] + 37.4036877698205M6[t] -92.6131162897724M7[t] -131.963506840643M8[t] + 55.695729371469M9[t] + 27.5699702049618M10[t] -11.8235252685434M11[t] + 0.87495693625875t + e[t]


Multiple Linear Regression - Ordinary Least Squares
VariableParameterS.D.T-STATH0: parameter = 02-tail p-value1-tail p-value
(Intercept)186.68060449046058.684013.18110.0026280.001314
X1.330767564128870.1528218.70800
M1-13.290846650056023.460541-0.56650.5737950.286897
M2-13.141215534601223.478299-0.55970.5783880.289194
M37.0377520150834124.0145460.29310.7707930.385396
M4-25.94034884319523.362433-1.11030.2726210.136311
M523.523115759639023.7172360.99180.3264760.163238
M637.403687769820524.9799631.49730.1411340.070567
M7-92.613116289772430.236008-3.0630.0036560.001828
M8-131.96350684064333.249812-3.96880.0002510.000126
M955.69572937146924.6316592.26110.0285240.014262
M1027.569970204961823.806861.15810.2528140.126407
M11-11.823525268543423.327587-0.50680.6146830.307342
t0.874956936258750.281233.11120.0031980.001599

\begin{tabular}{lllllllll}
\hline
Multiple Linear Regression - Ordinary Least Squares \tabularnewline
Variable & Parameter & S.D. & T-STATH0: parameter = 0 & 2-tail p-value & 1-tail p-value \tabularnewline
(Intercept) & 186.680604490460 & 58.68401 & 3.1811 & 0.002628 & 0.001314 \tabularnewline
X & 1.33076756412887 & 0.152821 & 8.708 & 0 & 0 \tabularnewline
M1 & -13.2908466500560 & 23.460541 & -0.5665 & 0.573795 & 0.286897 \tabularnewline
M2 & -13.1412155346012 & 23.478299 & -0.5597 & 0.578388 & 0.289194 \tabularnewline
M3 & 7.03775201508341 & 24.014546 & 0.2931 & 0.770793 & 0.385396 \tabularnewline
M4 & -25.940348843195 & 23.362433 & -1.1103 & 0.272621 & 0.136311 \tabularnewline
M5 & 23.5231157596390 & 23.717236 & 0.9918 & 0.326476 & 0.163238 \tabularnewline
M6 & 37.4036877698205 & 24.979963 & 1.4973 & 0.141134 & 0.070567 \tabularnewline
M7 & -92.6131162897724 & 30.236008 & -3.063 & 0.003656 & 0.001828 \tabularnewline
M8 & -131.963506840643 & 33.249812 & -3.9688 & 0.000251 & 0.000126 \tabularnewline
M9 & 55.695729371469 & 24.631659 & 2.2611 & 0.028524 & 0.014262 \tabularnewline
M10 & 27.5699702049618 & 23.80686 & 1.1581 & 0.252814 & 0.126407 \tabularnewline
M11 & -11.8235252685434 & 23.327587 & -0.5068 & 0.614683 & 0.307342 \tabularnewline
t & 0.87495693625875 & 0.28123 & 3.1112 & 0.003198 & 0.001599 \tabularnewline
\hline
\end{tabular}
%Source: https://freestatistics.org/blog/index.php?pk=57578&T=2

[TABLE]
[ROW][C]Multiple Linear Regression - Ordinary Least Squares[/C][/ROW]
[ROW][C]Variable[/C][C]Parameter[/C][C]S.D.[/C][C]T-STATH0: parameter = 0[/C][C]2-tail p-value[/C][C]1-tail p-value[/C][/ROW]
[ROW][C](Intercept)[/C][C]186.680604490460[/C][C]58.68401[/C][C]3.1811[/C][C]0.002628[/C][C]0.001314[/C][/ROW]
[ROW][C]X[/C][C]1.33076756412887[/C][C]0.152821[/C][C]8.708[/C][C]0[/C][C]0[/C][/ROW]
[ROW][C]M1[/C][C]-13.2908466500560[/C][C]23.460541[/C][C]-0.5665[/C][C]0.573795[/C][C]0.286897[/C][/ROW]
[ROW][C]M2[/C][C]-13.1412155346012[/C][C]23.478299[/C][C]-0.5597[/C][C]0.578388[/C][C]0.289194[/C][/ROW]
[ROW][C]M3[/C][C]7.03775201508341[/C][C]24.014546[/C][C]0.2931[/C][C]0.770793[/C][C]0.385396[/C][/ROW]
[ROW][C]M4[/C][C]-25.940348843195[/C][C]23.362433[/C][C]-1.1103[/C][C]0.272621[/C][C]0.136311[/C][/ROW]
[ROW][C]M5[/C][C]23.5231157596390[/C][C]23.717236[/C][C]0.9918[/C][C]0.326476[/C][C]0.163238[/C][/ROW]
[ROW][C]M6[/C][C]37.4036877698205[/C][C]24.979963[/C][C]1.4973[/C][C]0.141134[/C][C]0.070567[/C][/ROW]
[ROW][C]M7[/C][C]-92.6131162897724[/C][C]30.236008[/C][C]-3.063[/C][C]0.003656[/C][C]0.001828[/C][/ROW]
[ROW][C]M8[/C][C]-131.963506840643[/C][C]33.249812[/C][C]-3.9688[/C][C]0.000251[/C][C]0.000126[/C][/ROW]
[ROW][C]M9[/C][C]55.695729371469[/C][C]24.631659[/C][C]2.2611[/C][C]0.028524[/C][C]0.014262[/C][/ROW]
[ROW][C]M10[/C][C]27.5699702049618[/C][C]23.80686[/C][C]1.1581[/C][C]0.252814[/C][C]0.126407[/C][/ROW]
[ROW][C]M11[/C][C]-11.8235252685434[/C][C]23.327587[/C][C]-0.5068[/C][C]0.614683[/C][C]0.307342[/C][/ROW]
[ROW][C]t[/C][C]0.87495693625875[/C][C]0.28123[/C][C]3.1112[/C][C]0.003198[/C][C]0.001599[/C][/ROW]
[/TABLE]
Source: https://freestatistics.org/blog/index.php?pk=57578&T=2

Globally Unique Identifier (entire table): ba.freestatistics.org/blog/index.php?pk=57578&T=2

As an alternative you can also use a QR Code:  

The GUIDs for individual cells are displayed in the table below:

Multiple Linear Regression - Ordinary Least Squares
VariableParameterS.D.T-STATH0: parameter = 02-tail p-value1-tail p-value
(Intercept)186.68060449046058.684013.18110.0026280.001314
X1.330767564128870.1528218.70800
M1-13.290846650056023.460541-0.56650.5737950.286897
M2-13.141215534601223.478299-0.55970.5783880.289194
M37.0377520150834124.0145460.29310.7707930.385396
M4-25.94034884319523.362433-1.11030.2726210.136311
M523.523115759639023.7172360.99180.3264760.163238
M637.403687769820524.9799631.49730.1411340.070567
M7-92.613116289772430.236008-3.0630.0036560.001828
M8-131.96350684064333.249812-3.96880.0002510.000126
M955.69572937146924.6316592.26110.0285240.014262
M1027.569970204961823.806861.15810.2528140.126407
M11-11.823525268543423.327587-0.50680.6146830.307342
t0.874956936258750.281233.11120.0031980.001599


Multiple Linear Regression - Regression Statistics
Multiple R0.974557674504662
R-squared0.949762660935936
Adjusted R-squared0.935565152070004
F-TEST (value)66.8964302050912
F-TEST (DF numerator)13
F-TEST (DF denominator)46
p-value0
Multiple Linear Regression - Residual Statistics
Residual Standard Deviation36.7556804677554
Sum Squared Residuals62145.082145796

\begin{tabular}{lllllllll}
\hline
Multiple Linear Regression - Regression Statistics \tabularnewline
Multiple R & 0.974557674504662 \tabularnewline
R-squared & 0.949762660935936 \tabularnewline
Adjusted R-squared & 0.935565152070004 \tabularnewline
F-TEST (value) & 66.8964302050912 \tabularnewline
F-TEST (DF numerator) & 13 \tabularnewline
F-TEST (DF denominator) & 46 \tabularnewline
p-value & 0 \tabularnewline
Multiple Linear Regression - Residual Statistics \tabularnewline
Residual Standard Deviation & 36.7556804677554 \tabularnewline
Sum Squared Residuals & 62145.082145796 \tabularnewline
\hline
\end{tabular}
%Source: https://freestatistics.org/blog/index.php?pk=57578&T=3

[TABLE]
[ROW][C]Multiple Linear Regression - Regression Statistics[/C][/ROW]
[ROW][C]Multiple R[/C][C]0.974557674504662[/C][/ROW]
[ROW][C]R-squared[/C][C]0.949762660935936[/C][/ROW]
[ROW][C]Adjusted R-squared[/C][C]0.935565152070004[/C][/ROW]
[ROW][C]F-TEST (value)[/C][C]66.8964302050912[/C][/ROW]
[ROW][C]F-TEST (DF numerator)[/C][C]13[/C][/ROW]
[ROW][C]F-TEST (DF denominator)[/C][C]46[/C][/ROW]
[ROW][C]p-value[/C][C]0[/C][/ROW]
[ROW][C]Multiple Linear Regression - Residual Statistics[/C][/ROW]
[ROW][C]Residual Standard Deviation[/C][C]36.7556804677554[/C][/ROW]
[ROW][C]Sum Squared Residuals[/C][C]62145.082145796[/C][/ROW]
[/TABLE]
Source: https://freestatistics.org/blog/index.php?pk=57578&T=3

Globally Unique Identifier (entire table): ba.freestatistics.org/blog/index.php?pk=57578&T=3

As an alternative you can also use a QR Code:  

The GUIDs for individual cells are displayed in the table below:

Multiple Linear Regression - Regression Statistics
Multiple R0.974557674504662
R-squared0.949762660935936
Adjusted R-squared0.935565152070004
F-TEST (value)66.8964302050912
F-TEST (DF numerator)13
F-TEST (DF denominator)46
p-value0
Multiple Linear Regression - Residual Statistics
Residual Standard Deviation36.7556804677554
Sum Squared Residuals62145.082145796


Multiple Linear Regression - Actuals, Interpolation, and Residuals
Time or IndexActualsInterpolationForecastResidualsPrediction Error
1627648.01796760654-21.0179676065400
2696688.9655825821197.03441741788135
3825787.20402578753637.7959742124637
4677679.247130710171-2.24713071017142
5656649.7394984015326.26050159846768
6785825.517902607565-40.5179026075653
7412399.61488868349412.3851113165059
8352303.91644981134248.0835501886583
9839862.404025787536-23.4040257875364
10729769.945612914973-40.9456129149735
11696639.60411245283556.3958875471646
12641677.587178376086-36.5871783760859
13695686.463569688358.53643031164946
14638626.27284979013611.7271502098637
15762776.41122799658-14.4112279965795
16635627.200538431227.79946156878024
17721693.50817073985927.4918292601411
18854853.3173641763450.682635823654558
19418404.79130166208413.2086983379163
20367335.70821407250831.2917859274916
21824822.3343415857441.66565841425553
22687671.32215589151215.6778441084884
23601620.826709277105-19.8267092771054
24676706.717407508995-30.717407508995
25740679.6630745897860.3369254102197
26691663.38768430781927.6123156921814
27683723.033868153499-40.033868153499
28594609.753902819619-15.7539028196186
29729664.08462705109864.915372948902
30731764.009280101786-33.0092801017856
31386415.290784897189-29.2907848971887
32331331.569254102196-0.569254102195894
33707729.033954818798-22.0339548187980
34715699.12161746029215.8783825397082
35657691.210732898009-34.2107328980093
36653634.7093017681118.2906982318896
37642679.516417311854-37.5164173118544
38643655.25642164512-12.2564216451195
39718745.510259465764-27.5102594657638
40654629.56875900362624.4312409963743
41632702.530229132909-70.530229132909
42731735.916503977154-4.91650397715351
43392424.459500568165-32.4595005681648
44344396.630207466584-52.6302074665843
45792802.07951356796-10.0795135679596
46852820.07480851809231.9251914819075
47649657.794886516862-8.79488651686172
48629625.2472715412823.75272845871757
49685695.338970803475-10.3389708034748
50617651.117461674807-34.117461674807
51715670.84061859662144.1593814033786
52715729.229669035365-14.2296690353646
53629657.137474674602-28.1374746746018
54916838.2389491371577.7610508628499
55531494.84352418906936.1564758109313
56357383.17587454737-26.1758745473697
57917863.14816423996153.8518357600385
58828850.53580521513-22.5358052151305
59708701.5635588551886.43644114481169
60858812.73884080552645.2611591944736

\begin{tabular}{lllllllll}
\hline
Multiple Linear Regression - Actuals, Interpolation, and Residuals \tabularnewline
Time or Index & Actuals & InterpolationForecast & ResidualsPrediction Error \tabularnewline
1 & 627 & 648.01796760654 & -21.0179676065400 \tabularnewline
2 & 696 & 688.965582582119 & 7.03441741788135 \tabularnewline
3 & 825 & 787.204025787536 & 37.7959742124637 \tabularnewline
4 & 677 & 679.247130710171 & -2.24713071017142 \tabularnewline
5 & 656 & 649.739498401532 & 6.26050159846768 \tabularnewline
6 & 785 & 825.517902607565 & -40.5179026075653 \tabularnewline
7 & 412 & 399.614888683494 & 12.3851113165059 \tabularnewline
8 & 352 & 303.916449811342 & 48.0835501886583 \tabularnewline
9 & 839 & 862.404025787536 & -23.4040257875364 \tabularnewline
10 & 729 & 769.945612914973 & -40.9456129149735 \tabularnewline
11 & 696 & 639.604112452835 & 56.3958875471646 \tabularnewline
12 & 641 & 677.587178376086 & -36.5871783760859 \tabularnewline
13 & 695 & 686.46356968835 & 8.53643031164946 \tabularnewline
14 & 638 & 626.272849790136 & 11.7271502098637 \tabularnewline
15 & 762 & 776.41122799658 & -14.4112279965795 \tabularnewline
16 & 635 & 627.20053843122 & 7.79946156878024 \tabularnewline
17 & 721 & 693.508170739859 & 27.4918292601411 \tabularnewline
18 & 854 & 853.317364176345 & 0.682635823654558 \tabularnewline
19 & 418 & 404.791301662084 & 13.2086983379163 \tabularnewline
20 & 367 & 335.708214072508 & 31.2917859274916 \tabularnewline
21 & 824 & 822.334341585744 & 1.66565841425553 \tabularnewline
22 & 687 & 671.322155891512 & 15.6778441084884 \tabularnewline
23 & 601 & 620.826709277105 & -19.8267092771054 \tabularnewline
24 & 676 & 706.717407508995 & -30.717407508995 \tabularnewline
25 & 740 & 679.66307458978 & 60.3369254102197 \tabularnewline
26 & 691 & 663.387684307819 & 27.6123156921814 \tabularnewline
27 & 683 & 723.033868153499 & -40.033868153499 \tabularnewline
28 & 594 & 609.753902819619 & -15.7539028196186 \tabularnewline
29 & 729 & 664.084627051098 & 64.915372948902 \tabularnewline
30 & 731 & 764.009280101786 & -33.0092801017856 \tabularnewline
31 & 386 & 415.290784897189 & -29.2907848971887 \tabularnewline
32 & 331 & 331.569254102196 & -0.569254102195894 \tabularnewline
33 & 707 & 729.033954818798 & -22.0339548187980 \tabularnewline
34 & 715 & 699.121617460292 & 15.8783825397082 \tabularnewline
35 & 657 & 691.210732898009 & -34.2107328980093 \tabularnewline
36 & 653 & 634.70930176811 & 18.2906982318896 \tabularnewline
37 & 642 & 679.516417311854 & -37.5164173118544 \tabularnewline
38 & 643 & 655.25642164512 & -12.2564216451195 \tabularnewline
39 & 718 & 745.510259465764 & -27.5102594657638 \tabularnewline
40 & 654 & 629.568759003626 & 24.4312409963743 \tabularnewline
41 & 632 & 702.530229132909 & -70.530229132909 \tabularnewline
42 & 731 & 735.916503977154 & -4.91650397715351 \tabularnewline
43 & 392 & 424.459500568165 & -32.4595005681648 \tabularnewline
44 & 344 & 396.630207466584 & -52.6302074665843 \tabularnewline
45 & 792 & 802.07951356796 & -10.0795135679596 \tabularnewline
46 & 852 & 820.074808518092 & 31.9251914819075 \tabularnewline
47 & 649 & 657.794886516862 & -8.79488651686172 \tabularnewline
48 & 629 & 625.247271541282 & 3.75272845871757 \tabularnewline
49 & 685 & 695.338970803475 & -10.3389708034748 \tabularnewline
50 & 617 & 651.117461674807 & -34.117461674807 \tabularnewline
51 & 715 & 670.840618596621 & 44.1593814033786 \tabularnewline
52 & 715 & 729.229669035365 & -14.2296690353646 \tabularnewline
53 & 629 & 657.137474674602 & -28.1374746746018 \tabularnewline
54 & 916 & 838.23894913715 & 77.7610508628499 \tabularnewline
55 & 531 & 494.843524189069 & 36.1564758109313 \tabularnewline
56 & 357 & 383.17587454737 & -26.1758745473697 \tabularnewline
57 & 917 & 863.148164239961 & 53.8518357600385 \tabularnewline
58 & 828 & 850.53580521513 & -22.5358052151305 \tabularnewline
59 & 708 & 701.563558855188 & 6.43644114481169 \tabularnewline
60 & 858 & 812.738840805526 & 45.2611591944736 \tabularnewline
\hline
\end{tabular}
%Source: https://freestatistics.org/blog/index.php?pk=57578&T=4

[TABLE]
[ROW][C]Multiple Linear Regression - Actuals, Interpolation, and Residuals[/C][/ROW]
[ROW][C]Time or Index[/C][C]Actuals[/C][C]InterpolationForecast[/C][C]ResidualsPrediction Error[/C][/ROW]
[ROW][C]1[/C][C]627[/C][C]648.01796760654[/C][C]-21.0179676065400[/C][/ROW]
[ROW][C]2[/C][C]696[/C][C]688.965582582119[/C][C]7.03441741788135[/C][/ROW]
[ROW][C]3[/C][C]825[/C][C]787.204025787536[/C][C]37.7959742124637[/C][/ROW]
[ROW][C]4[/C][C]677[/C][C]679.247130710171[/C][C]-2.24713071017142[/C][/ROW]
[ROW][C]5[/C][C]656[/C][C]649.739498401532[/C][C]6.26050159846768[/C][/ROW]
[ROW][C]6[/C][C]785[/C][C]825.517902607565[/C][C]-40.5179026075653[/C][/ROW]
[ROW][C]7[/C][C]412[/C][C]399.614888683494[/C][C]12.3851113165059[/C][/ROW]
[ROW][C]8[/C][C]352[/C][C]303.916449811342[/C][C]48.0835501886583[/C][/ROW]
[ROW][C]9[/C][C]839[/C][C]862.404025787536[/C][C]-23.4040257875364[/C][/ROW]
[ROW][C]10[/C][C]729[/C][C]769.945612914973[/C][C]-40.9456129149735[/C][/ROW]
[ROW][C]11[/C][C]696[/C][C]639.604112452835[/C][C]56.3958875471646[/C][/ROW]
[ROW][C]12[/C][C]641[/C][C]677.587178376086[/C][C]-36.5871783760859[/C][/ROW]
[ROW][C]13[/C][C]695[/C][C]686.46356968835[/C][C]8.53643031164946[/C][/ROW]
[ROW][C]14[/C][C]638[/C][C]626.272849790136[/C][C]11.7271502098637[/C][/ROW]
[ROW][C]15[/C][C]762[/C][C]776.41122799658[/C][C]-14.4112279965795[/C][/ROW]
[ROW][C]16[/C][C]635[/C][C]627.20053843122[/C][C]7.79946156878024[/C][/ROW]
[ROW][C]17[/C][C]721[/C][C]693.508170739859[/C][C]27.4918292601411[/C][/ROW]
[ROW][C]18[/C][C]854[/C][C]853.317364176345[/C][C]0.682635823654558[/C][/ROW]
[ROW][C]19[/C][C]418[/C][C]404.791301662084[/C][C]13.2086983379163[/C][/ROW]
[ROW][C]20[/C][C]367[/C][C]335.708214072508[/C][C]31.2917859274916[/C][/ROW]
[ROW][C]21[/C][C]824[/C][C]822.334341585744[/C][C]1.66565841425553[/C][/ROW]
[ROW][C]22[/C][C]687[/C][C]671.322155891512[/C][C]15.6778441084884[/C][/ROW]
[ROW][C]23[/C][C]601[/C][C]620.826709277105[/C][C]-19.8267092771054[/C][/ROW]
[ROW][C]24[/C][C]676[/C][C]706.717407508995[/C][C]-30.717407508995[/C][/ROW]
[ROW][C]25[/C][C]740[/C][C]679.66307458978[/C][C]60.3369254102197[/C][/ROW]
[ROW][C]26[/C][C]691[/C][C]663.387684307819[/C][C]27.6123156921814[/C][/ROW]
[ROW][C]27[/C][C]683[/C][C]723.033868153499[/C][C]-40.033868153499[/C][/ROW]
[ROW][C]28[/C][C]594[/C][C]609.753902819619[/C][C]-15.7539028196186[/C][/ROW]
[ROW][C]29[/C][C]729[/C][C]664.084627051098[/C][C]64.915372948902[/C][/ROW]
[ROW][C]30[/C][C]731[/C][C]764.009280101786[/C][C]-33.0092801017856[/C][/ROW]
[ROW][C]31[/C][C]386[/C][C]415.290784897189[/C][C]-29.2907848971887[/C][/ROW]
[ROW][C]32[/C][C]331[/C][C]331.569254102196[/C][C]-0.569254102195894[/C][/ROW]
[ROW][C]33[/C][C]707[/C][C]729.033954818798[/C][C]-22.0339548187980[/C][/ROW]
[ROW][C]34[/C][C]715[/C][C]699.121617460292[/C][C]15.8783825397082[/C][/ROW]
[ROW][C]35[/C][C]657[/C][C]691.210732898009[/C][C]-34.2107328980093[/C][/ROW]
[ROW][C]36[/C][C]653[/C][C]634.70930176811[/C][C]18.2906982318896[/C][/ROW]
[ROW][C]37[/C][C]642[/C][C]679.516417311854[/C][C]-37.5164173118544[/C][/ROW]
[ROW][C]38[/C][C]643[/C][C]655.25642164512[/C][C]-12.2564216451195[/C][/ROW]
[ROW][C]39[/C][C]718[/C][C]745.510259465764[/C][C]-27.5102594657638[/C][/ROW]
[ROW][C]40[/C][C]654[/C][C]629.568759003626[/C][C]24.4312409963743[/C][/ROW]
[ROW][C]41[/C][C]632[/C][C]702.530229132909[/C][C]-70.530229132909[/C][/ROW]
[ROW][C]42[/C][C]731[/C][C]735.916503977154[/C][C]-4.91650397715351[/C][/ROW]
[ROW][C]43[/C][C]392[/C][C]424.459500568165[/C][C]-32.4595005681648[/C][/ROW]
[ROW][C]44[/C][C]344[/C][C]396.630207466584[/C][C]-52.6302074665843[/C][/ROW]
[ROW][C]45[/C][C]792[/C][C]802.07951356796[/C][C]-10.0795135679596[/C][/ROW]
[ROW][C]46[/C][C]852[/C][C]820.074808518092[/C][C]31.9251914819075[/C][/ROW]
[ROW][C]47[/C][C]649[/C][C]657.794886516862[/C][C]-8.79488651686172[/C][/ROW]
[ROW][C]48[/C][C]629[/C][C]625.247271541282[/C][C]3.75272845871757[/C][/ROW]
[ROW][C]49[/C][C]685[/C][C]695.338970803475[/C][C]-10.3389708034748[/C][/ROW]
[ROW][C]50[/C][C]617[/C][C]651.117461674807[/C][C]-34.117461674807[/C][/ROW]
[ROW][C]51[/C][C]715[/C][C]670.840618596621[/C][C]44.1593814033786[/C][/ROW]
[ROW][C]52[/C][C]715[/C][C]729.229669035365[/C][C]-14.2296690353646[/C][/ROW]
[ROW][C]53[/C][C]629[/C][C]657.137474674602[/C][C]-28.1374746746018[/C][/ROW]
[ROW][C]54[/C][C]916[/C][C]838.23894913715[/C][C]77.7610508628499[/C][/ROW]
[ROW][C]55[/C][C]531[/C][C]494.843524189069[/C][C]36.1564758109313[/C][/ROW]
[ROW][C]56[/C][C]357[/C][C]383.17587454737[/C][C]-26.1758745473697[/C][/ROW]
[ROW][C]57[/C][C]917[/C][C]863.148164239961[/C][C]53.8518357600385[/C][/ROW]
[ROW][C]58[/C][C]828[/C][C]850.53580521513[/C][C]-22.5358052151305[/C][/ROW]
[ROW][C]59[/C][C]708[/C][C]701.563558855188[/C][C]6.43644114481169[/C][/ROW]
[ROW][C]60[/C][C]858[/C][C]812.738840805526[/C][C]45.2611591944736[/C][/ROW]
[/TABLE]
Source: https://freestatistics.org/blog/index.php?pk=57578&T=4

Globally Unique Identifier (entire table): ba.freestatistics.org/blog/index.php?pk=57578&T=4

As an alternative you can also use a QR Code:  

The GUIDs for individual cells are displayed in the table below:

Multiple Linear Regression - Actuals, Interpolation, and Residuals
Time or IndexActualsInterpolationForecastResidualsPrediction Error
1627648.01796760654-21.0179676065400
2696688.9655825821197.03441741788135
3825787.20402578753637.7959742124637
4677679.247130710171-2.24713071017142
5656649.7394984015326.26050159846768
6785825.517902607565-40.5179026075653
7412399.61488868349412.3851113165059
8352303.91644981134248.0835501886583
9839862.404025787536-23.4040257875364
10729769.945612914973-40.9456129149735
11696639.60411245283556.3958875471646
12641677.587178376086-36.5871783760859
13695686.463569688358.53643031164946
14638626.27284979013611.7271502098637
15762776.41122799658-14.4112279965795
16635627.200538431227.79946156878024
17721693.50817073985927.4918292601411
18854853.3173641763450.682635823654558
19418404.79130166208413.2086983379163
20367335.70821407250831.2917859274916
21824822.3343415857441.66565841425553
22687671.32215589151215.6778441084884
23601620.826709277105-19.8267092771054
24676706.717407508995-30.717407508995
25740679.6630745897860.3369254102197
26691663.38768430781927.6123156921814
27683723.033868153499-40.033868153499
28594609.753902819619-15.7539028196186
29729664.08462705109864.915372948902
30731764.009280101786-33.0092801017856
31386415.290784897189-29.2907848971887
32331331.569254102196-0.569254102195894
33707729.033954818798-22.0339548187980
34715699.12161746029215.8783825397082
35657691.210732898009-34.2107328980093
36653634.7093017681118.2906982318896
37642679.516417311854-37.5164173118544
38643655.25642164512-12.2564216451195
39718745.510259465764-27.5102594657638
40654629.56875900362624.4312409963743
41632702.530229132909-70.530229132909
42731735.916503977154-4.91650397715351
43392424.459500568165-32.4595005681648
44344396.630207466584-52.6302074665843
45792802.07951356796-10.0795135679596
46852820.07480851809231.9251914819075
47649657.794886516862-8.79488651686172
48629625.2472715412823.75272845871757
49685695.338970803475-10.3389708034748
50617651.117461674807-34.117461674807
51715670.84061859662144.1593814033786
52715729.229669035365-14.2296690353646
53629657.137474674602-28.1374746746018
54916838.2389491371577.7610508628499
55531494.84352418906936.1564758109313
56357383.17587454737-26.1758745473697
57917863.14816423996153.8518357600385
58828850.53580521513-22.5358052151305
59708701.5635588551886.43644114481169
60858812.73884080552645.2611591944736


Goldfeld-Quandt test for Heteroskedasticity
p-valuesAlternative Hypothesis
breakpoint indexgreater2-sidedless
170.2527573249266020.5055146498532030.747242675073398
180.1621874228219150.3243748456438310.837812577178085
190.0819385932111430.1638771864222860.918061406788857
200.06638633156090320.1327726631218060.933613668439097
210.04073908786712550.0814781757342510.959260912132874
220.04402123479727810.08804246959455620.955978765202722
230.1349886677586980.2699773355173950.865011332241302
240.09100279261799730.1820055852359950.908997207382003
250.1662751207935090.3325502415870170.833724879206491
260.1384315077988510.2768630155977030.861568492201149
270.1855424998230620.3710849996461250.814457500176938
280.1323872353215590.2647744706431170.867612764678441
290.4333002077484410.8666004154968830.566699792251559
300.3928048512527350.785609702505470.607195148747265
310.393066956273790.786133912547580.60693304372621
320.5067743220664870.9864513558670260.493225677933513
330.416961115837340.833922231674680.58303888416266
340.3992532838759780.7985065677519550.600746716124022
350.3749241178733370.7498482357466740.625075882126663
360.3725554309364130.7451108618728250.627444569063587
370.3230096693469810.6460193386939610.67699033065302
380.3117783347987140.6235566695974280.688221665201286
390.2739758122799600.5479516245599190.72602418772004
400.4174443383601150.834888676720230.582555661639885
410.4475061307092290.8950122614184580.552493869290771
420.3996824764647260.7993649529294520.600317523535274
430.352053423978860.704106847957720.64794657602114

\begin{tabular}{lllllllll}
\hline
Goldfeld-Quandt test for Heteroskedasticity \tabularnewline
p-values & Alternative Hypothesis \tabularnewline
breakpoint index & greater & 2-sided & less \tabularnewline
17 & 0.252757324926602 & 0.505514649853203 & 0.747242675073398 \tabularnewline
18 & 0.162187422821915 & 0.324374845643831 & 0.837812577178085 \tabularnewline
19 & 0.081938593211143 & 0.163877186422286 & 0.918061406788857 \tabularnewline
20 & 0.0663863315609032 & 0.132772663121806 & 0.933613668439097 \tabularnewline
21 & 0.0407390878671255 & 0.081478175734251 & 0.959260912132874 \tabularnewline
22 & 0.0440212347972781 & 0.0880424695945562 & 0.955978765202722 \tabularnewline
23 & 0.134988667758698 & 0.269977335517395 & 0.865011332241302 \tabularnewline
24 & 0.0910027926179973 & 0.182005585235995 & 0.908997207382003 \tabularnewline
25 & 0.166275120793509 & 0.332550241587017 & 0.833724879206491 \tabularnewline
26 & 0.138431507798851 & 0.276863015597703 & 0.861568492201149 \tabularnewline
27 & 0.185542499823062 & 0.371084999646125 & 0.814457500176938 \tabularnewline
28 & 0.132387235321559 & 0.264774470643117 & 0.867612764678441 \tabularnewline
29 & 0.433300207748441 & 0.866600415496883 & 0.566699792251559 \tabularnewline
30 & 0.392804851252735 & 0.78560970250547 & 0.607195148747265 \tabularnewline
31 & 0.39306695627379 & 0.78613391254758 & 0.60693304372621 \tabularnewline
32 & 0.506774322066487 & 0.986451355867026 & 0.493225677933513 \tabularnewline
33 & 0.41696111583734 & 0.83392223167468 & 0.58303888416266 \tabularnewline
34 & 0.399253283875978 & 0.798506567751955 & 0.600746716124022 \tabularnewline
35 & 0.374924117873337 & 0.749848235746674 & 0.625075882126663 \tabularnewline
36 & 0.372555430936413 & 0.745110861872825 & 0.627444569063587 \tabularnewline
37 & 0.323009669346981 & 0.646019338693961 & 0.67699033065302 \tabularnewline
38 & 0.311778334798714 & 0.623556669597428 & 0.688221665201286 \tabularnewline
39 & 0.273975812279960 & 0.547951624559919 & 0.72602418772004 \tabularnewline
40 & 0.417444338360115 & 0.83488867672023 & 0.582555661639885 \tabularnewline
41 & 0.447506130709229 & 0.895012261418458 & 0.552493869290771 \tabularnewline
42 & 0.399682476464726 & 0.799364952929452 & 0.600317523535274 \tabularnewline
43 & 0.35205342397886 & 0.70410684795772 & 0.64794657602114 \tabularnewline
\hline
\end{tabular}
%Source: https://freestatistics.org/blog/index.php?pk=57578&T=5

[TABLE]
[ROW][C]Goldfeld-Quandt test for Heteroskedasticity[/C][/ROW]
[ROW][C]p-values[/C][C]Alternative Hypothesis[/C][/ROW]
[ROW][C]breakpoint index[/C][C]greater[/C][C]2-sided[/C][C]less[/C][/ROW]
[ROW][C]17[/C][C]0.252757324926602[/C][C]0.505514649853203[/C][C]0.747242675073398[/C][/ROW]
[ROW][C]18[/C][C]0.162187422821915[/C][C]0.324374845643831[/C][C]0.837812577178085[/C][/ROW]
[ROW][C]19[/C][C]0.081938593211143[/C][C]0.163877186422286[/C][C]0.918061406788857[/C][/ROW]
[ROW][C]20[/C][C]0.0663863315609032[/C][C]0.132772663121806[/C][C]0.933613668439097[/C][/ROW]
[ROW][C]21[/C][C]0.0407390878671255[/C][C]0.081478175734251[/C][C]0.959260912132874[/C][/ROW]
[ROW][C]22[/C][C]0.0440212347972781[/C][C]0.0880424695945562[/C][C]0.955978765202722[/C][/ROW]
[ROW][C]23[/C][C]0.134988667758698[/C][C]0.269977335517395[/C][C]0.865011332241302[/C][/ROW]
[ROW][C]24[/C][C]0.0910027926179973[/C][C]0.182005585235995[/C][C]0.908997207382003[/C][/ROW]
[ROW][C]25[/C][C]0.166275120793509[/C][C]0.332550241587017[/C][C]0.833724879206491[/C][/ROW]
[ROW][C]26[/C][C]0.138431507798851[/C][C]0.276863015597703[/C][C]0.861568492201149[/C][/ROW]
[ROW][C]27[/C][C]0.185542499823062[/C][C]0.371084999646125[/C][C]0.814457500176938[/C][/ROW]
[ROW][C]28[/C][C]0.132387235321559[/C][C]0.264774470643117[/C][C]0.867612764678441[/C][/ROW]
[ROW][C]29[/C][C]0.433300207748441[/C][C]0.866600415496883[/C][C]0.566699792251559[/C][/ROW]
[ROW][C]30[/C][C]0.392804851252735[/C][C]0.78560970250547[/C][C]0.607195148747265[/C][/ROW]
[ROW][C]31[/C][C]0.39306695627379[/C][C]0.78613391254758[/C][C]0.60693304372621[/C][/ROW]
[ROW][C]32[/C][C]0.506774322066487[/C][C]0.986451355867026[/C][C]0.493225677933513[/C][/ROW]
[ROW][C]33[/C][C]0.41696111583734[/C][C]0.83392223167468[/C][C]0.58303888416266[/C][/ROW]
[ROW][C]34[/C][C]0.399253283875978[/C][C]0.798506567751955[/C][C]0.600746716124022[/C][/ROW]
[ROW][C]35[/C][C]0.374924117873337[/C][C]0.749848235746674[/C][C]0.625075882126663[/C][/ROW]
[ROW][C]36[/C][C]0.372555430936413[/C][C]0.745110861872825[/C][C]0.627444569063587[/C][/ROW]
[ROW][C]37[/C][C]0.323009669346981[/C][C]0.646019338693961[/C][C]0.67699033065302[/C][/ROW]
[ROW][C]38[/C][C]0.311778334798714[/C][C]0.623556669597428[/C][C]0.688221665201286[/C][/ROW]
[ROW][C]39[/C][C]0.273975812279960[/C][C]0.547951624559919[/C][C]0.72602418772004[/C][/ROW]
[ROW][C]40[/C][C]0.417444338360115[/C][C]0.83488867672023[/C][C]0.582555661639885[/C][/ROW]
[ROW][C]41[/C][C]0.447506130709229[/C][C]0.895012261418458[/C][C]0.552493869290771[/C][/ROW]
[ROW][C]42[/C][C]0.399682476464726[/C][C]0.799364952929452[/C][C]0.600317523535274[/C][/ROW]
[ROW][C]43[/C][C]0.35205342397886[/C][C]0.70410684795772[/C][C]0.64794657602114[/C][/ROW]
[/TABLE]
Source: https://freestatistics.org/blog/index.php?pk=57578&T=5

Globally Unique Identifier (entire table): ba.freestatistics.org/blog/index.php?pk=57578&T=5

As an alternative you can also use a QR Code:  

The GUIDs for individual cells are displayed in the table below:

Goldfeld-Quandt test for Heteroskedasticity
p-valuesAlternative Hypothesis
breakpoint indexgreater2-sidedless
170.2527573249266020.5055146498532030.747242675073398
180.1621874228219150.3243748456438310.837812577178085
190.0819385932111430.1638771864222860.918061406788857
200.06638633156090320.1327726631218060.933613668439097
210.04073908786712550.0814781757342510.959260912132874
220.04402123479727810.08804246959455620.955978765202722
230.1349886677586980.2699773355173950.865011332241302
240.09100279261799730.1820055852359950.908997207382003
250.1662751207935090.3325502415870170.833724879206491
260.1384315077988510.2768630155977030.861568492201149
270.1855424998230620.3710849996461250.814457500176938
280.1323872353215590.2647744706431170.867612764678441
290.4333002077484410.8666004154968830.566699792251559
300.3928048512527350.785609702505470.607195148747265
310.393066956273790.786133912547580.60693304372621
320.5067743220664870.9864513558670260.493225677933513
330.416961115837340.833922231674680.58303888416266
340.3992532838759780.7985065677519550.600746716124022
350.3749241178733370.7498482357466740.625075882126663
360.3725554309364130.7451108618728250.627444569063587
370.3230096693469810.6460193386939610.67699033065302
380.3117783347987140.6235566695974280.688221665201286
390.2739758122799600.5479516245599190.72602418772004
400.4174443383601150.834888676720230.582555661639885
410.4475061307092290.8950122614184580.552493869290771
420.3996824764647260.7993649529294520.600317523535274
430.352053423978860.704106847957720.64794657602114


Meta Analysis of Goldfeld-Quandt test for Heteroskedasticity
Description# significant tests% significant testsOK/NOK
1% type I error level00OK
5% type I error level00OK
10% type I error level20.0740740740740741OK

\begin{tabular}{lllllllll}
\hline
Meta Analysis of Goldfeld-Quandt test for Heteroskedasticity \tabularnewline
Description & # significant tests & % significant tests & OK/NOK \tabularnewline
1% type I error level & 0 & 0 & OK \tabularnewline
5% type I error level & 0 & 0 & OK \tabularnewline
10% type I error level & 2 & 0.0740740740740741 & OK \tabularnewline
\hline
\end{tabular}
%Source: https://freestatistics.org/blog/index.php?pk=57578&T=6

[TABLE]
[ROW][C]Meta Analysis of Goldfeld-Quandt test for Heteroskedasticity[/C][/ROW]
[ROW][C]Description[/C][C]# significant tests[/C][C]% significant tests[/C][C]OK/NOK[/C][/ROW]
[ROW][C]1% type I error level[/C][C]0[/C][C]0[/C][C]OK[/C][/ROW]
[ROW][C]5% type I error level[/C][C]0[/C][C]0[/C][C]OK[/C][/ROW]
[ROW][C]10% type I error level[/C][C]2[/C][C]0.0740740740740741[/C][C]OK[/C][/ROW]
[/TABLE]
Source: https://freestatistics.org/blog/index.php?pk=57578&T=6

Globally Unique Identifier (entire table): ba.freestatistics.org/blog/index.php?pk=57578&T=6

As an alternative you can also use a QR Code:  

The GUIDs for individual cells are displayed in the table below:

Meta Analysis of Goldfeld-Quandt test for Heteroskedasticity
Description# significant tests% significant testsOK/NOK
1% type I error level00OK
5% type I error level00OK
10% type I error level20.0740740740740741OK


Parameters (Session):
par1 = 1 ; par2 = Include Monthly Dummies ; par3 = Linear Trend ;
Parameters (R input):
par1 = 1 ; par2 = Include Monthly Dummies ; par3 = Linear Trend ;
R code (references can be found in the software module):
library(lattice)
library(lmtest)
n25 <- 25 #minimum number of obs. for Goldfeld-Quandt test
par1 <- as.numeric(par1)
x <- t(y)
k <- length(x[1,])
n <- length(x[,1])
x1 <- cbind(x[,par1], x[,1:k!=par1])
mycolnames <- c(colnames(x)[par1], colnames(x)[1:k!=par1])
colnames(x1) <- mycolnames #colnames(x)[par1]
x <- x1
if (par3 == 'First Differences'){
x2 <- array(0, dim=c(n-1,k), dimnames=list(1:(n-1), paste('(1-B)',colnames(x),sep='')))
for (i in 1:n-1) {
for (j in 1:k) {
x2[i,j] <- x[i+1,j] - x[i,j]
}
}
x <- x2
}
if (par2 == 'Include Monthly Dummies'){
x2 <- array(0, dim=c(n,11), dimnames=list(1:n, paste('M', seq(1:11), sep ='')))
for (i in 1:11){
x2[seq(i,n,12),i] <- 1
}
x <- cbind(x, x2)
}
if (par2 == 'Include Quarterly Dummies'){
x2 <- array(0, dim=c(n,3), dimnames=list(1:n, paste('Q', seq(1:3), sep ='')))
for (i in 1:3){
x2[seq(i,n,4),i] <- 1
}
x <- cbind(x, x2)
}
k <- length(x[1,])
if (par3 == 'Linear Trend'){
x <- cbind(x, c(1:n))
colnames(x)[k+1] <- 't'
}
x
k <- length(x[1,])
df <- as.data.frame(x)
(mylm <- lm(df))
(mysum <- summary(mylm))
if (n > n25) {
kp3 <- k + 3
nmkm3 <- n - k - 3
gqarr <- array(NA, dim=c(nmkm3-kp3+1,3))
numgqtests <- 0
numsignificant1 <- 0
numsignificant5 <- 0
numsignificant10 <- 0
for (mypoint in kp3:nmkm3) {
j <- 0
numgqtests <- numgqtests + 1
for (myalt in c('greater', 'two.sided', 'less')) {
j <- j + 1
gqarr[mypoint-kp3+1,j] <- gqtest(mylm, point=mypoint, alternative=myalt)$p.value
}
if (gqarr[mypoint-kp3+1,2] < 0.01) numsignificant1 <- numsignificant1 + 1
if (gqarr[mypoint-kp3+1,2] < 0.05) numsignificant5 <- numsignificant5 + 1
if (gqarr[mypoint-kp3+1,2] < 0.10) numsignificant10 <- numsignificant10 + 1
}
gqarr
}
bitmap(file='test0.png')
plot(x[,1], type='l', main='Actuals and Interpolation', ylab='value of Actuals and Interpolation (dots)', xlab='time or index')
points(x[,1]-mysum$resid)
grid()
dev.off()
bitmap(file='test1.png')
plot(mysum$resid, type='b', pch=19, main='Residuals', ylab='value of Residuals', xlab='time or index')
grid()
dev.off()
bitmap(file='test2.png')
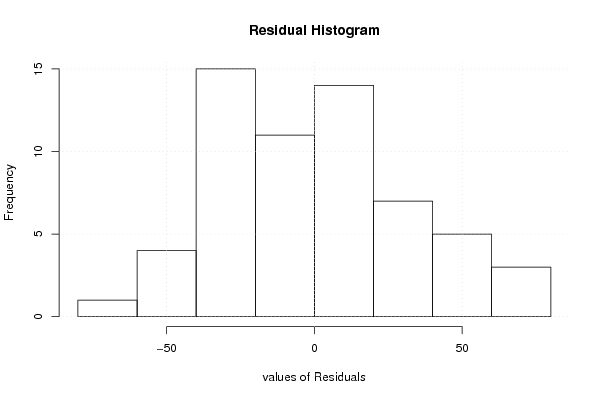
hist(mysum$resid, main='Residual Histogram', xlab='values of Residuals')
grid()
dev.off()
bitmap(file='test3.png')
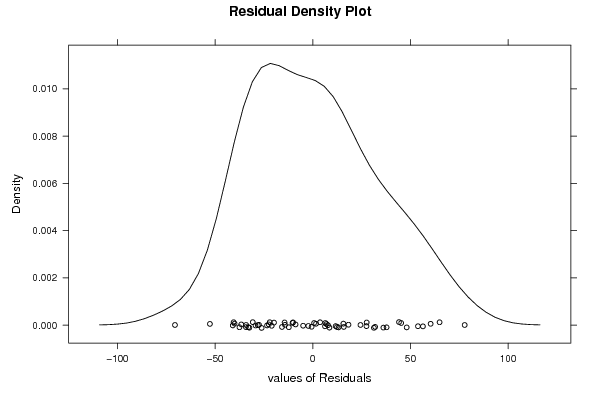
densityplot(~mysum$resid,col='black',main='Residual Density Plot', xlab='values of Residuals')
dev.off()
bitmap(file='test4.png')
qqnorm(mysum$resid, main='Residual Normal Q-Q Plot')
qqline(mysum$resid)
grid()
dev.off()
(myerror <- as.ts(mysum$resid))
bitmap(file='test5.png')
dum <- cbind(lag(myerror,k=1),myerror)
dum
dum1 <- dum[2:length(myerror),]
dum1
z <- as.data.frame(dum1)
z
plot(z,main=paste('Residual Lag plot, lowess, and regression line'), ylab='values of Residuals', xlab='lagged values of Residuals')
lines(lowess(z))
abline(lm(z))
grid()
dev.off()
bitmap(file='test6.png')
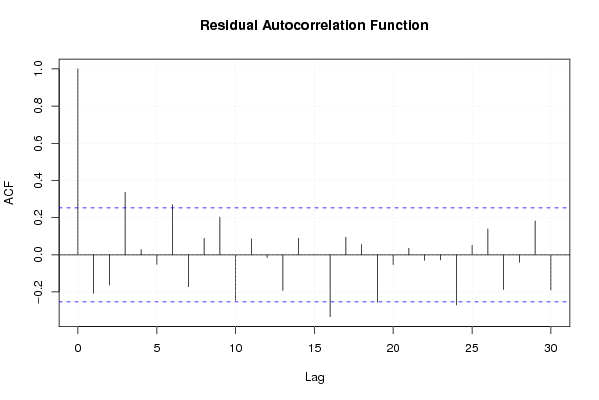
acf(mysum$resid, lag.max=length(mysum$resid)/2, main='Residual Autocorrelation Function')
grid()
dev.off()
bitmap(file='test7.png')
pacf(mysum$resid, lag.max=length(mysum$resid)/2, main='Residual Partial Autocorrelation Function')
grid()
dev.off()
bitmap(file='test8.png')
opar <- par(mfrow = c(2,2), oma = c(0, 0, 1.1, 0))
plot(mylm, las = 1, sub='Residual Diagnostics')
par(opar)
dev.off()
if (n > n25) {
bitmap(file='test9.png')
plot(kp3:nmkm3,gqarr[,2], main='Goldfeld-Quandt test',ylab='2-sided p-value',xlab='breakpoint')
grid()
dev.off()
}
load(file='createtable')
a<-table.start()
a<-table.row.start(a)
a<-table.element(a, 'Multiple Linear Regression - Estimated Regression Equation', 1, TRUE)
a<-table.row.end(a)
myeq <- colnames(x)[1]
myeq <- paste(myeq, '[t] = ', sep='')
for (i in 1:k){
if (mysum$coefficients[i,1] > 0) myeq <- paste(myeq, '+', '')
myeq <- paste(myeq, mysum$coefficients[i,1], sep=' ')
if (rownames(mysum$coefficients)[i] != '(Intercept)') {
myeq <- paste(myeq, rownames(mysum$coefficients)[i], sep='')
if (rownames(mysum$coefficients)[i] != 't') myeq <- paste(myeq, '[t]', sep='')
}
}
myeq <- paste(myeq, ' + e[t]')
a<-table.row.start(a)
a<-table.element(a, myeq)
a<-table.row.end(a)
a<-table.end(a)
table.save(a,file='mytable1.tab')
a<-table.start()
a<-table.row.start(a)
a<-table.element(a,hyperlink('ols1.htm','Multiple Linear Regression - Ordinary Least Squares',''), 6, TRUE)
a<-table.row.end(a)
a<-table.row.start(a)
a<-table.element(a,'Variable',header=TRUE)
a<-table.element(a,'Parameter',header=TRUE)
a<-table.element(a,'S.D.',header=TRUE)
a<-table.element(a,'T-STAT
H0: parameter = 0',header=TRUE)
a<-table.element(a,'2-tail p-value',header=TRUE)
a<-table.element(a,'1-tail p-value',header=TRUE)
a<-table.row.end(a)
for (i in 1:k){
a<-table.row.start(a)
a<-table.element(a,rownames(mysum$coefficients)[i],header=TRUE)
a<-table.element(a,mysum$coefficients[i,1])
a<-table.element(a, round(mysum$coefficients[i,2],6))
a<-table.element(a, round(mysum$coefficients[i,3],4))
a<-table.element(a, round(mysum$coefficients[i,4],6))
a<-table.element(a, round(mysum$coefficients[i,4]/2,6))
a<-table.row.end(a)
}
a<-table.end(a)
table.save(a,file='mytable2.tab')
a<-table.start()
a<-table.row.start(a)
a<-table.element(a, 'Multiple Linear Regression - Regression Statistics', 2, TRUE)
a<-table.row.end(a)
a<-table.row.start(a)
a<-table.element(a, 'Multiple R',1,TRUE)
a<-table.element(a, sqrt(mysum$r.squared))
a<-table.row.end(a)
a<-table.row.start(a)
a<-table.element(a, 'R-squared',1,TRUE)
a<-table.element(a, mysum$r.squared)
a<-table.row.end(a)
a<-table.row.start(a)
a<-table.element(a, 'Adjusted R-squared',1,TRUE)
a<-table.element(a, mysum$adj.r.squared)
a<-table.row.end(a)
a<-table.row.start(a)
a<-table.element(a, 'F-TEST (value)',1,TRUE)
a<-table.element(a, mysum$fstatistic[1])
a<-table.row.end(a)
a<-table.row.start(a)
a<-table.element(a, 'F-TEST (DF numerator)',1,TRUE)
a<-table.element(a, mysum$fstatistic[2])
a<-table.row.end(a)
a<-table.row.start(a)
a<-table.element(a, 'F-TEST (DF denominator)',1,TRUE)
a<-table.element(a, mysum$fstatistic[3])
a<-table.row.end(a)
a<-table.row.start(a)
a<-table.element(a, 'p-value',1,TRUE)
a<-table.element(a, 1-pf(mysum$fstatistic[1],mysum$fstatistic[2],mysum$fstatistic[3]))
a<-table.row.end(a)
a<-table.row.start(a)
a<-table.element(a, 'Multiple Linear Regression - Residual Statistics', 2, TRUE)
a<-table.row.end(a)
a<-table.row.start(a)
a<-table.element(a, 'Residual Standard Deviation',1,TRUE)
a<-table.element(a, mysum$sigma)
a<-table.row.end(a)
a<-table.row.start(a)
a<-table.element(a, 'Sum Squared Residuals',1,TRUE)
a<-table.element(a, sum(myerror*myerror))
a<-table.row.end(a)
a<-table.end(a)
table.save(a,file='mytable3.tab')
a<-table.start()
a<-table.row.start(a)
a<-table.element(a, 'Multiple Linear Regression - Actuals, Interpolation, and Residuals', 4, TRUE)
a<-table.row.end(a)
a<-table.row.start(a)
a<-table.element(a, 'Time or Index', 1, TRUE)
a<-table.element(a, 'Actuals', 1, TRUE)
a<-table.element(a, 'Interpolation
Forecast', 1, TRUE)
a<-table.element(a, 'Residuals
Prediction Error', 1, TRUE)
a<-table.row.end(a)
for (i in 1:n) {
a<-table.row.start(a)
a<-table.element(a,i, 1, TRUE)
a<-table.element(a,x[i])
a<-table.element(a,x[i]-mysum$resid[i])
a<-table.element(a,mysum$resid[i])
a<-table.row.end(a)
}
a<-table.end(a)
table.save(a,file='mytable4.tab')
if (n > n25) {
a<-table.start()
a<-table.row.start(a)
a<-table.element(a,'Goldfeld-Quandt test for Heteroskedasticity',4,TRUE)
a<-table.row.end(a)
a<-table.row.start(a)
a<-table.element(a,'p-values',header=TRUE)
a<-table.element(a,'Alternative Hypothesis',3,header=TRUE)
a<-table.row.end(a)
a<-table.row.start(a)
a<-table.element(a,'breakpoint index',header=TRUE)
a<-table.element(a,'greater',header=TRUE)
a<-table.element(a,'2-sided',header=TRUE)
a<-table.element(a,'less',header=TRUE)
a<-table.row.end(a)
for (mypoint in kp3:nmkm3) {
a<-table.row.start(a)
a<-table.element(a,mypoint,header=TRUE)
a<-table.element(a,gqarr[mypoint-kp3+1,1])
a<-table.element(a,gqarr[mypoint-kp3+1,2])
a<-table.element(a,gqarr[mypoint-kp3+1,3])
a<-table.row.end(a)
}
a<-table.end(a)
table.save(a,file='mytable5.tab')
a<-table.start()
a<-table.row.start(a)
a<-table.element(a,'Meta Analysis of Goldfeld-Quandt test for Heteroskedasticity',4,TRUE)
a<-table.row.end(a)
a<-table.row.start(a)
a<-table.element(a,'Description',header=TRUE)
a<-table.element(a,'# significant tests',header=TRUE)
a<-table.element(a,'% significant tests',header=TRUE)
a<-table.element(a,'OK/NOK',header=TRUE)
a<-table.row.end(a)
a<-table.row.start(a)
a<-table.element(a,'1% type I error level',header=TRUE)
a<-table.element(a,numsignificant1)
a<-table.element(a,numsignificant1/numgqtests)
if (numsignificant1/numgqtests < 0.01) dum <- 'OK' else dum <- 'NOK'
a<-table.element(a,dum)
a<-table.row.end(a)
a<-table.row.start(a)
a<-table.element(a,'5% type I error level',header=TRUE)
a<-table.element(a,numsignificant5)
a<-table.element(a,numsignificant5/numgqtests)
if (numsignificant5/numgqtests < 0.05) dum <- 'OK' else dum <- 'NOK'
a<-table.element(a,dum)
a<-table.row.end(a)
a<-table.row.start(a)
a<-table.element(a,'10% type I error level',header=TRUE)
a<-table.element(a,numsignificant10)
a<-table.element(a,numsignificant10/numgqtests)
if (numsignificant10/numgqtests < 0.1) dum <- 'OK' else dum <- 'NOK'
a<-table.element(a,dum)
a<-table.row.end(a)
a<-table.end(a)
table.save(a,file='mytable6.tab')
}