Free Statistics

of Irreproducible Research!

Author's title

Author*The author of this computation has been verified*
R Software Modulerwasp_multipleregression.wasp
Title produced by softwareMultiple Regression
Date of computationWed, 18 Nov 2009 10:51:37 -0700
Cite this page as followsStatistical Computations at FreeStatistics.org, Office for Research Development and Education, URL https://freestatistics.org/blog/index.php?v=date/2009/Nov/18/t1258566979xie77iujj9rgwwg.htm/, Retrieved Wed, 01 May 2024 14:31:10 +0000
Statistical Computations at FreeStatistics.org, Office for Research Development and Education, URL https://freestatistics.org/blog/index.php?pk=57557, Retrieved Wed, 01 May 2024 14:31:10 +0000
QR Codes:

Original text written by user:
IsPrivate?No (this computation is public)
User-defined keywords
Estimated Impact160
Family? (F = Feedback message, R = changed R code, M = changed R Module, P = changed Parameters, D = changed Data)
-     [Multiple Regression] [Q1 The Seatbeltlaw] [2007-11-14 19:27:43] [8cd6641b921d30ebe00b648d1481bba0]
- RM D  [Multiple Regression] [Seatbelt] [2009-11-12 14:10:54] [b98453cac15ba1066b407e146608df68]
- R  D      [Multiple Regression] [] [2009-11-18 17:51:37] [d5837f25ec8937f9733a894c487f865c] [Current]
Feedback Forum

Post a new message
Dataseries X:
2863,36	99.9	2882,6	2767,63	2803,47	3030,29
2897,06	99.7	2863,36	2882,6	2767,63	2803,47
3012,61	99.5	2897,06	2863,36	2882,6	2767,63
3142,95	99.2	3012,61	2897,06	2863,36	2882,6
3032,93	99	3142,95	3012,61	2897,06	2863,36
3045,78	99	3032,93	3142,95	3012,61	2897,06
3110,52	99.3	3045,78	3032,93	3142,95	3012,61
3013,24	99.5	3110,52	3045,78	3032,93	3142,95
2987,1	99.7	3013,24	3110,52	3045,78	3032,93
2995,55	100	2987,1	3013,24	3110,52	3045,78
2833,18	100.4	2995,55	2987,1	3013,24	3110,52
2848,96	100.6	2833,18	2995,55	2987,1	3013,24
2794,83	100.7	2848,96	2833,18	2995,55	2987,1
2845,26	100.7	2794,83	2848,96	2833,18	2995,55
2915,02	100.6	2845,26	2794,83	2848,96	2833,18
2892,63	100.5	2915,02	2845,26	2794,83	2848,96
2604,42	100.6	2892,63	2915,02	2845,26	2794,83
2641,65	100.5	2604,42	2892,63	2915,02	2845,26
2659,81	100.4	2641,65	2604,42	2892,63	2915,02
2638,53	100.3	2659,81	2641,65	2604,42	2892,63
2720,25	100.4	2638,53	2659,81	2641,65	2604,42
2745,88	100.4	2720,25	2638,53	2659,81	2641,65
2735,7	100.4	2745,88	2720,25	2638,53	2659,81
2811,7	100.4	2735,7	2745,88	2720,25	2638,53
2799,43	100.4	2811,7	2735,7	2745,88	2720,25
2555,28	100.5	2799,43	2811,7	2735,7	2745,88
2304,98	100.6	2555,28	2799,43	2811,7	2735,7
2214,95	100.6	2304,98	2555,28	2799,43	2811,7
2065,81	100.5	2214,95	2304,98	2555,28	2799,43
1940,49	100.5	2065,81	2214,95	2304,98	2555,28
2042	        100.7	1940,49	2065,81	2214,95	2304,98
1995,37	101.1	2042	        1940,49	2065,81	2214,95
1946,81	101.5	1995,37	2042	        1940,49	2065,81
1765,9	101.9	1946,81	1995,37	2042	        1940,49
1635,25	102.1	1765,9	1946,81	1995,37	2042
1833,42	102.1	1635,25	1765,9	1946,81	1995,37
1910,43	102.1	1833,42	1635,25	1765,9	1946,81
1959,67	102.4	1910,43	1833,42	1635,25	1765,9
1969,6	102.8	1959,67	1910,43	1833,42	1635,25
2061,41	103.1	1969,6	1959,67	1910,43	1833,42
2093,48	103.1	2061,41	1969,6	1959,67	1910,43
2120,88	102.9	2093,48	2061,41	1969,6	1959,67
2174,56	102.4	2120,88	2093,48	2061,41	1969,6
2196,72	101.9	2174,56	2120,88	2093,48	2061,41
2350,44	101.3	2196,72	2174,56	2120,88	2093,48
2440,25	100.7	2350,44	2196,72	2174,56	2120,88
2408,64	100.6	2440,25	2350,44	2196,72	2174,56
2472,81	101	2408,64	2440,25	2350,44	2196,72
2407,6	101.5	2472,81	2408,64	2440,25	2350,44
2454,62	101.9	2407,6	2472,81	2408,64	2440,25
2448,05	102.1	2454,62	2407,6	2472,81	2408,64
2497,84	102.3	2448,05	2454,62	2407,6	2472,81
2645,64	102.5	2497,84	2448,05	2454,62	2407,6
2756,76	102.9	2645,64	2497,84	2448,05	2454,62
2849,27	103.6	2756,76	2645,64	2497,84	2448,05
2921,44	104.3	2849,27	2756,76	2645,64	2497,84


Summary of computational transaction
Raw Inputview raw input (R code)
Raw Outputview raw output of R engine
Computing time4 seconds
R Server'Gwilym Jenkins' @ 72.249.127.135

\begin{tabular}{lllllllll}
\hline
Summary of computational transaction \tabularnewline
Raw Input & view raw input (R code)  \tabularnewline
Raw Output & view raw output of R engine  \tabularnewline
Computing time & 4 seconds \tabularnewline
R Server & 'Gwilym Jenkins' @ 72.249.127.135 \tabularnewline
\hline
\end{tabular}
%Source: https://freestatistics.org/blog/index.php?pk=57557&T=0

[TABLE]
[ROW][C]Summary of computational transaction[/C][/ROW]
[ROW][C]Raw Input[/C][C]view raw input (R code) [/C][/ROW]
[ROW][C]Raw Output[/C][C]view raw output of R engine [/C][/ROW]
[ROW][C]Computing time[/C][C]4 seconds[/C][/ROW]
[ROW][C]R Server[/C][C]'Gwilym Jenkins' @ 72.249.127.135[/C][/ROW]
[/TABLE]
Source: https://freestatistics.org/blog/index.php?pk=57557&T=0

Globally Unique Identifier (entire table): ba.freestatistics.org/blog/index.php?pk=57557&T=0

As an alternative you can also use a QR Code:  

The GUIDs for individual cells are displayed in the table below:

Summary of computational transaction
Raw Inputview raw input (R code)
Raw Outputview raw output of R engine
Computing time4 seconds
R Server'Gwilym Jenkins' @ 72.249.127.135


Multiple Linear Regression - Estimated Regression Equation
Bel20[t] = -1092.78270532526 + 12.5769027972356Gzhind[t] + 1.54924150207039Y1[t] -0.763672660876186Y2[t] + 0.338991410113042Y3[t] -0.141990563713654Y4[t] -199.107040330143M1[t] -101.49182241988M2[t] -148.393128332664M3[t] -88.7734804200535M4[t] -218.605515568737M5[t] -65.3177530628458M6[t] -88.7273869252064M7[t] -167.702931515144M8[t] -49.6419680958159M9[t] -175.368415813703M10[t] -187.01519336378M11[t] -0.282093134491550t + e[t]

\begin{tabular}{lllllllll}
\hline
Multiple Linear Regression - Estimated Regression Equation \tabularnewline
Bel20[t] =  -1092.78270532526 +  12.5769027972356Gzhind[t] +  1.54924150207039Y1[t] -0.763672660876186Y2[t] +  0.338991410113042Y3[t] -0.141990563713654Y4[t] -199.107040330143M1[t] -101.49182241988M2[t] -148.393128332664M3[t] -88.7734804200535M4[t] -218.605515568737M5[t] -65.3177530628458M6[t] -88.7273869252064M7[t] -167.702931515144M8[t] -49.6419680958159M9[t] -175.368415813703M10[t] -187.01519336378M11[t] -0.282093134491550t  + e[t] \tabularnewline
\hline
\end{tabular}
%Source: https://freestatistics.org/blog/index.php?pk=57557&T=1

[TABLE]
[ROW][C]Multiple Linear Regression - Estimated Regression Equation[/C][/ROW]
[ROW][C]Bel20[t] =  -1092.78270532526 +  12.5769027972356Gzhind[t] +  1.54924150207039Y1[t] -0.763672660876186Y2[t] +  0.338991410113042Y3[t] -0.141990563713654Y4[t] -199.107040330143M1[t] -101.49182241988M2[t] -148.393128332664M3[t] -88.7734804200535M4[t] -218.605515568737M5[t] -65.3177530628458M6[t] -88.7273869252064M7[t] -167.702931515144M8[t] -49.6419680958159M9[t] -175.368415813703M10[t] -187.01519336378M11[t] -0.282093134491550t  + e[t][/C][/ROW]
[/TABLE]
Source: https://freestatistics.org/blog/index.php?pk=57557&T=1

Globally Unique Identifier (entire table): ba.freestatistics.org/blog/index.php?pk=57557&T=1

As an alternative you can also use a QR Code:  

The GUIDs for individual cells are displayed in the table below:

Multiple Linear Regression - Estimated Regression Equation
Bel20[t] = -1092.78270532526 + 12.5769027972356Gzhind[t] + 1.54924150207039Y1[t] -0.763672660876186Y2[t] + 0.338991410113042Y3[t] -0.141990563713654Y4[t] -199.107040330143M1[t] -101.49182241988M2[t] -148.393128332664M3[t] -88.7734804200535M4[t] -218.605515568737M5[t] -65.3177530628458M6[t] -88.7273869252064M7[t] -167.702931515144M8[t] -49.6419680958159M9[t] -175.368415813703M10[t] -187.01519336378M11[t] -0.282093134491550t + e[t]


Multiple Linear Regression - Ordinary Least Squares
VariableParameterS.D.T-STATH0: parameter = 02-tail p-value1-tail p-value
(Intercept)-1092.782705325262068.766542-0.52820.6004120.300206
Gzhind12.576902797235620.3265030.61870.5397770.269888
Y11.549241502070390.1613629.60100
Y2-0.7636726608761860.29179-2.61720.0126560.006328
Y30.3389914101130420.2818921.20260.2365870.118293
Y4-0.1419905637136540.162602-0.87320.3880180.194009
M1-199.10704033014370.766654-2.81360.0077160.003858
M2-101.4918224198867.987818-1.49280.1437480.071874
M3-148.39312833266463.416287-2.340.0246380.012319
M4-88.773480420053563.122114-1.40640.1677380.083869
M5-218.60551556873764.554411-3.38640.0016580.000829
M6-65.317753062845862.930493-1.03790.305860.15293
M7-88.727386925206465.533452-1.35390.1837580.091879
M8-167.70293151514468.114055-2.46210.0184620.009231
M9-49.641968095815966.70994-0.74410.4613650.230682
M10-175.36841581370368.657013-2.55430.0147730.007386
M11-187.0151933637866.91962-2.79460.0080990.00405
t-0.2820931344915501.512973-0.18640.8530840.426542

\begin{tabular}{lllllllll}
\hline
Multiple Linear Regression - Ordinary Least Squares \tabularnewline
Variable & Parameter & S.D. & T-STATH0: parameter = 0 & 2-tail p-value & 1-tail p-value \tabularnewline
(Intercept) & -1092.78270532526 & 2068.766542 & -0.5282 & 0.600412 & 0.300206 \tabularnewline
Gzhind & 12.5769027972356 & 20.326503 & 0.6187 & 0.539777 & 0.269888 \tabularnewline
Y1 & 1.54924150207039 & 0.161362 & 9.601 & 0 & 0 \tabularnewline
Y2 & -0.763672660876186 & 0.29179 & -2.6172 & 0.012656 & 0.006328 \tabularnewline
Y3 & 0.338991410113042 & 0.281892 & 1.2026 & 0.236587 & 0.118293 \tabularnewline
Y4 & -0.141990563713654 & 0.162602 & -0.8732 & 0.388018 & 0.194009 \tabularnewline
M1 & -199.107040330143 & 70.766654 & -2.8136 & 0.007716 & 0.003858 \tabularnewline
M2 & -101.49182241988 & 67.987818 & -1.4928 & 0.143748 & 0.071874 \tabularnewline
M3 & -148.393128332664 & 63.416287 & -2.34 & 0.024638 & 0.012319 \tabularnewline
M4 & -88.7734804200535 & 63.122114 & -1.4064 & 0.167738 & 0.083869 \tabularnewline
M5 & -218.605515568737 & 64.554411 & -3.3864 & 0.001658 & 0.000829 \tabularnewline
M6 & -65.3177530628458 & 62.930493 & -1.0379 & 0.30586 & 0.15293 \tabularnewline
M7 & -88.7273869252064 & 65.533452 & -1.3539 & 0.183758 & 0.091879 \tabularnewline
M8 & -167.702931515144 & 68.114055 & -2.4621 & 0.018462 & 0.009231 \tabularnewline
M9 & -49.6419680958159 & 66.70994 & -0.7441 & 0.461365 & 0.230682 \tabularnewline
M10 & -175.368415813703 & 68.657013 & -2.5543 & 0.014773 & 0.007386 \tabularnewline
M11 & -187.01519336378 & 66.91962 & -2.7946 & 0.008099 & 0.00405 \tabularnewline
t & -0.282093134491550 & 1.512973 & -0.1864 & 0.853084 & 0.426542 \tabularnewline
\hline
\end{tabular}
%Source: https://freestatistics.org/blog/index.php?pk=57557&T=2

[TABLE]
[ROW][C]Multiple Linear Regression - Ordinary Least Squares[/C][/ROW]
[ROW][C]Variable[/C][C]Parameter[/C][C]S.D.[/C][C]T-STATH0: parameter = 0[/C][C]2-tail p-value[/C][C]1-tail p-value[/C][/ROW]
[ROW][C](Intercept)[/C][C]-1092.78270532526[/C][C]2068.766542[/C][C]-0.5282[/C][C]0.600412[/C][C]0.300206[/C][/ROW]
[ROW][C]Gzhind[/C][C]12.5769027972356[/C][C]20.326503[/C][C]0.6187[/C][C]0.539777[/C][C]0.269888[/C][/ROW]
[ROW][C]Y1[/C][C]1.54924150207039[/C][C]0.161362[/C][C]9.601[/C][C]0[/C][C]0[/C][/ROW]
[ROW][C]Y2[/C][C]-0.763672660876186[/C][C]0.29179[/C][C]-2.6172[/C][C]0.012656[/C][C]0.006328[/C][/ROW]
[ROW][C]Y3[/C][C]0.338991410113042[/C][C]0.281892[/C][C]1.2026[/C][C]0.236587[/C][C]0.118293[/C][/ROW]
[ROW][C]Y4[/C][C]-0.141990563713654[/C][C]0.162602[/C][C]-0.8732[/C][C]0.388018[/C][C]0.194009[/C][/ROW]
[ROW][C]M1[/C][C]-199.107040330143[/C][C]70.766654[/C][C]-2.8136[/C][C]0.007716[/C][C]0.003858[/C][/ROW]
[ROW][C]M2[/C][C]-101.49182241988[/C][C]67.987818[/C][C]-1.4928[/C][C]0.143748[/C][C]0.071874[/C][/ROW]
[ROW][C]M3[/C][C]-148.393128332664[/C][C]63.416287[/C][C]-2.34[/C][C]0.024638[/C][C]0.012319[/C][/ROW]
[ROW][C]M4[/C][C]-88.7734804200535[/C][C]63.122114[/C][C]-1.4064[/C][C]0.167738[/C][C]0.083869[/C][/ROW]
[ROW][C]M5[/C][C]-218.605515568737[/C][C]64.554411[/C][C]-3.3864[/C][C]0.001658[/C][C]0.000829[/C][/ROW]
[ROW][C]M6[/C][C]-65.3177530628458[/C][C]62.930493[/C][C]-1.0379[/C][C]0.30586[/C][C]0.15293[/C][/ROW]
[ROW][C]M7[/C][C]-88.7273869252064[/C][C]65.533452[/C][C]-1.3539[/C][C]0.183758[/C][C]0.091879[/C][/ROW]
[ROW][C]M8[/C][C]-167.702931515144[/C][C]68.114055[/C][C]-2.4621[/C][C]0.018462[/C][C]0.009231[/C][/ROW]
[ROW][C]M9[/C][C]-49.6419680958159[/C][C]66.70994[/C][C]-0.7441[/C][C]0.461365[/C][C]0.230682[/C][/ROW]
[ROW][C]M10[/C][C]-175.368415813703[/C][C]68.657013[/C][C]-2.5543[/C][C]0.014773[/C][C]0.007386[/C][/ROW]
[ROW][C]M11[/C][C]-187.01519336378[/C][C]66.91962[/C][C]-2.7946[/C][C]0.008099[/C][C]0.00405[/C][/ROW]
[ROW][C]t[/C][C]-0.282093134491550[/C][C]1.512973[/C][C]-0.1864[/C][C]0.853084[/C][C]0.426542[/C][/ROW]
[/TABLE]
Source: https://freestatistics.org/blog/index.php?pk=57557&T=2

Globally Unique Identifier (entire table): ba.freestatistics.org/blog/index.php?pk=57557&T=2

As an alternative you can also use a QR Code:  

The GUIDs for individual cells are displayed in the table below:

Multiple Linear Regression - Ordinary Least Squares
VariableParameterS.D.T-STATH0: parameter = 02-tail p-value1-tail p-value
(Intercept)-1092.782705325262068.766542-0.52820.6004120.300206
Gzhind12.576902797235620.3265030.61870.5397770.269888
Y11.549241502070390.1613629.60100
Y2-0.7636726608761860.29179-2.61720.0126560.006328
Y30.3389914101130420.2818921.20260.2365870.118293
Y4-0.1419905637136540.162602-0.87320.3880180.194009
M1-199.10704033014370.766654-2.81360.0077160.003858
M2-101.4918224198867.987818-1.49280.1437480.071874
M3-148.39312833266463.416287-2.340.0246380.012319
M4-88.773480420053563.122114-1.40640.1677380.083869
M5-218.60551556873764.554411-3.38640.0016580.000829
M6-65.317753062845862.930493-1.03790.305860.15293
M7-88.727386925206465.533452-1.35390.1837580.091879
M8-167.70293151514468.114055-2.46210.0184620.009231
M9-49.641968095815966.70994-0.74410.4613650.230682
M10-175.36841581370368.657013-2.55430.0147730.007386
M11-187.0151933637866.91962-2.79460.0080990.00405
t-0.2820931344915501.512973-0.18640.8530840.426542


Multiple Linear Regression - Regression Statistics
Multiple R0.982311884103085
R-squared0.964936637650153
Adjusted R-squared0.949250396598906
F-TEST (value)61.5148418603080
F-TEST (DF numerator)17
F-TEST (DF denominator)38
p-value0
Multiple Linear Regression - Residual Statistics
Residual Standard Deviation91.233745581805
Sum Squared Residuals316296.660649649

\begin{tabular}{lllllllll}
\hline
Multiple Linear Regression - Regression Statistics \tabularnewline
Multiple R & 0.982311884103085 \tabularnewline
R-squared & 0.964936637650153 \tabularnewline
Adjusted R-squared & 0.949250396598906 \tabularnewline
F-TEST (value) & 61.5148418603080 \tabularnewline
F-TEST (DF numerator) & 17 \tabularnewline
F-TEST (DF denominator) & 38 \tabularnewline
p-value & 0 \tabularnewline
Multiple Linear Regression - Residual Statistics \tabularnewline
Residual Standard Deviation & 91.233745581805 \tabularnewline
Sum Squared Residuals & 316296.660649649 \tabularnewline
\hline
\end{tabular}
%Source: https://freestatistics.org/blog/index.php?pk=57557&T=3

[TABLE]
[ROW][C]Multiple Linear Regression - Regression Statistics[/C][/ROW]
[ROW][C]Multiple R[/C][C]0.982311884103085[/C][/ROW]
[ROW][C]R-squared[/C][C]0.964936637650153[/C][/ROW]
[ROW][C]Adjusted R-squared[/C][C]0.949250396598906[/C][/ROW]
[ROW][C]F-TEST (value)[/C][C]61.5148418603080[/C][/ROW]
[ROW][C]F-TEST (DF numerator)[/C][C]17[/C][/ROW]
[ROW][C]F-TEST (DF denominator)[/C][C]38[/C][/ROW]
[ROW][C]p-value[/C][C]0[/C][/ROW]
[ROW][C]Multiple Linear Regression - Residual Statistics[/C][/ROW]
[ROW][C]Residual Standard Deviation[/C][C]91.233745581805[/C][/ROW]
[ROW][C]Sum Squared Residuals[/C][C]316296.660649649[/C][/ROW]
[/TABLE]
Source: https://freestatistics.org/blog/index.php?pk=57557&T=3

Globally Unique Identifier (entire table): ba.freestatistics.org/blog/index.php?pk=57557&T=3

As an alternative you can also use a QR Code:  

The GUIDs for individual cells are displayed in the table below:

Multiple Linear Regression - Regression Statistics
Multiple R0.982311884103085
R-squared0.964936637650153
Adjusted R-squared0.949250396598906
F-TEST (value)61.5148418603080
F-TEST (DF numerator)17
F-TEST (DF denominator)38
p-value0
Multiple Linear Regression - Residual Statistics
Residual Standard Deviation91.233745581805
Sum Squared Residuals316296.660649649


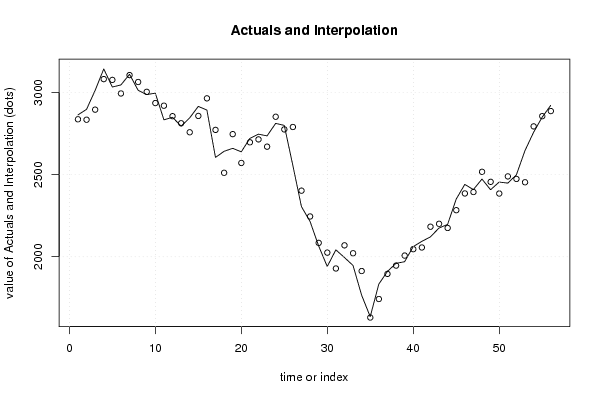
Multiple Linear Regression - Actuals, Interpolation, and Residuals
Time or IndexActualsInterpolationForecastResidualsPrediction Error
12863.362836.6206012950526.7393987049488
22897.062833.8883407136963.1716592863088
33012.612895.15484594619117.455154053808
43142.953081.1515669371161.7984330628865
53032.933076.36372847676-43.4337284767624
63045.782993.7701286131952.0098713868124
73110.523105.555622663734.96437733626984
83013.243063.49518163545-50.255181635452
92987.13003.61689253293-16.5168925329319
102995.552935.2960512526460.253948747363
112833.182919.28188226414-86.1018822641426
122848.962855.47859295501-6.51859295501351
132794.832812.36782137017-17.5378213701703
142845.262757.5478935268187.7121064731903
152915.022856.9769465642258.0430534357808
162892.632964.02966983424-71.3996698342379
172604.422771.99319580253-167.573195802529
182641.652510.82036910092130.829630899079
192659.812746.15203114046-86.342031140456
202638.532570.8178500623567.7121499376502
212720.252696.5620065077623.6879934922381
222745.882714.2782107486131.6017892513861
232735.72669.8567840710665.8432159289373
242811.72851.96961274128-40.2696127412817
252799.432775.1819020962324.2480979037658
262555.282789.6342509918-234.354250991803
272304.982402.04030414991-97.0603041499127
282214.952245.10268366841-30.1526836684080
292065.812084.37739112909-18.5673911290882
301940.492024.90007871979-84.4100787197871
3120421928.48776933105113.512230668955
321995.372069.45408700856-74.0840870085609
331946.812021.19624452210-74.3862445220955
341765.91912.8026291099-146.902629109899
351635.251629.979171681235.27082831877324
361833.421742.6194878550190.8005121449927
371910.431895.5855017695214.8444982304792
381959.671946.0600594032413.6099405967615
391969.62007.11063631402-37.5106363140189
402061.412045.9694467069915.4405532930057
412093.482056.2651549287837.2148450712213
422120.882182.70140106225-61.8214010622488
432174.562200.39229265401-25.8322926540103
442196.722174.9201573218721.7998426781308
452350.442283.2248564372167.2151435627893
462440.252385.2031088888555.0468911111502
472408.642393.6521619835714.9878380164321
482472.812516.82230644870-44.0123064486975
492407.62455.89417346902-48.2941734690235
502454.622384.7594553644669.8605446355425
512448.052488.97726702566-40.9272670256572
522497.842473.5266328532524.3133671467537
532645.642453.28052966284192.359470337158
542756.762793.36802250386-36.6080225038557
552849.272855.57228421076-6.30228421075798
562921.442886.6127239717734.8272760282317

\begin{tabular}{lllllllll}
\hline
Multiple Linear Regression - Actuals, Interpolation, and Residuals \tabularnewline
Time or Index & Actuals & InterpolationForecast & ResidualsPrediction Error \tabularnewline
1 & 2863.36 & 2836.62060129505 & 26.7393987049488 \tabularnewline
2 & 2897.06 & 2833.88834071369 & 63.1716592863088 \tabularnewline
3 & 3012.61 & 2895.15484594619 & 117.455154053808 \tabularnewline
4 & 3142.95 & 3081.15156693711 & 61.7984330628865 \tabularnewline
5 & 3032.93 & 3076.36372847676 & -43.4337284767624 \tabularnewline
6 & 3045.78 & 2993.77012861319 & 52.0098713868124 \tabularnewline
7 & 3110.52 & 3105.55562266373 & 4.96437733626984 \tabularnewline
8 & 3013.24 & 3063.49518163545 & -50.255181635452 \tabularnewline
9 & 2987.1 & 3003.61689253293 & -16.5168925329319 \tabularnewline
10 & 2995.55 & 2935.29605125264 & 60.253948747363 \tabularnewline
11 & 2833.18 & 2919.28188226414 & -86.1018822641426 \tabularnewline
12 & 2848.96 & 2855.47859295501 & -6.51859295501351 \tabularnewline
13 & 2794.83 & 2812.36782137017 & -17.5378213701703 \tabularnewline
14 & 2845.26 & 2757.54789352681 & 87.7121064731903 \tabularnewline
15 & 2915.02 & 2856.97694656422 & 58.0430534357808 \tabularnewline
16 & 2892.63 & 2964.02966983424 & -71.3996698342379 \tabularnewline
17 & 2604.42 & 2771.99319580253 & -167.573195802529 \tabularnewline
18 & 2641.65 & 2510.82036910092 & 130.829630899079 \tabularnewline
19 & 2659.81 & 2746.15203114046 & -86.342031140456 \tabularnewline
20 & 2638.53 & 2570.81785006235 & 67.7121499376502 \tabularnewline
21 & 2720.25 & 2696.56200650776 & 23.6879934922381 \tabularnewline
22 & 2745.88 & 2714.27821074861 & 31.6017892513861 \tabularnewline
23 & 2735.7 & 2669.85678407106 & 65.8432159289373 \tabularnewline
24 & 2811.7 & 2851.96961274128 & -40.2696127412817 \tabularnewline
25 & 2799.43 & 2775.18190209623 & 24.2480979037658 \tabularnewline
26 & 2555.28 & 2789.6342509918 & -234.354250991803 \tabularnewline
27 & 2304.98 & 2402.04030414991 & -97.0603041499127 \tabularnewline
28 & 2214.95 & 2245.10268366841 & -30.1526836684080 \tabularnewline
29 & 2065.81 & 2084.37739112909 & -18.5673911290882 \tabularnewline
30 & 1940.49 & 2024.90007871979 & -84.4100787197871 \tabularnewline
31 & 2042 & 1928.48776933105 & 113.512230668955 \tabularnewline
32 & 1995.37 & 2069.45408700856 & -74.0840870085609 \tabularnewline
33 & 1946.81 & 2021.19624452210 & -74.3862445220955 \tabularnewline
34 & 1765.9 & 1912.8026291099 & -146.902629109899 \tabularnewline
35 & 1635.25 & 1629.97917168123 & 5.27082831877324 \tabularnewline
36 & 1833.42 & 1742.61948785501 & 90.8005121449927 \tabularnewline
37 & 1910.43 & 1895.58550176952 & 14.8444982304792 \tabularnewline
38 & 1959.67 & 1946.06005940324 & 13.6099405967615 \tabularnewline
39 & 1969.6 & 2007.11063631402 & -37.5106363140189 \tabularnewline
40 & 2061.41 & 2045.96944670699 & 15.4405532930057 \tabularnewline
41 & 2093.48 & 2056.26515492878 & 37.2148450712213 \tabularnewline
42 & 2120.88 & 2182.70140106225 & -61.8214010622488 \tabularnewline
43 & 2174.56 & 2200.39229265401 & -25.8322926540103 \tabularnewline
44 & 2196.72 & 2174.92015732187 & 21.7998426781308 \tabularnewline
45 & 2350.44 & 2283.22485643721 & 67.2151435627893 \tabularnewline
46 & 2440.25 & 2385.20310888885 & 55.0468911111502 \tabularnewline
47 & 2408.64 & 2393.65216198357 & 14.9878380164321 \tabularnewline
48 & 2472.81 & 2516.82230644870 & -44.0123064486975 \tabularnewline
49 & 2407.6 & 2455.89417346902 & -48.2941734690235 \tabularnewline
50 & 2454.62 & 2384.75945536446 & 69.8605446355425 \tabularnewline
51 & 2448.05 & 2488.97726702566 & -40.9272670256572 \tabularnewline
52 & 2497.84 & 2473.52663285325 & 24.3133671467537 \tabularnewline
53 & 2645.64 & 2453.28052966284 & 192.359470337158 \tabularnewline
54 & 2756.76 & 2793.36802250386 & -36.6080225038557 \tabularnewline
55 & 2849.27 & 2855.57228421076 & -6.30228421075798 \tabularnewline
56 & 2921.44 & 2886.61272397177 & 34.8272760282317 \tabularnewline
\hline
\end{tabular}
%Source: https://freestatistics.org/blog/index.php?pk=57557&T=4

[TABLE]
[ROW][C]Multiple Linear Regression - Actuals, Interpolation, and Residuals[/C][/ROW]
[ROW][C]Time or Index[/C][C]Actuals[/C][C]InterpolationForecast[/C][C]ResidualsPrediction Error[/C][/ROW]
[ROW][C]1[/C][C]2863.36[/C][C]2836.62060129505[/C][C]26.7393987049488[/C][/ROW]
[ROW][C]2[/C][C]2897.06[/C][C]2833.88834071369[/C][C]63.1716592863088[/C][/ROW]
[ROW][C]3[/C][C]3012.61[/C][C]2895.15484594619[/C][C]117.455154053808[/C][/ROW]
[ROW][C]4[/C][C]3142.95[/C][C]3081.15156693711[/C][C]61.7984330628865[/C][/ROW]
[ROW][C]5[/C][C]3032.93[/C][C]3076.36372847676[/C][C]-43.4337284767624[/C][/ROW]
[ROW][C]6[/C][C]3045.78[/C][C]2993.77012861319[/C][C]52.0098713868124[/C][/ROW]
[ROW][C]7[/C][C]3110.52[/C][C]3105.55562266373[/C][C]4.96437733626984[/C][/ROW]
[ROW][C]8[/C][C]3013.24[/C][C]3063.49518163545[/C][C]-50.255181635452[/C][/ROW]
[ROW][C]9[/C][C]2987.1[/C][C]3003.61689253293[/C][C]-16.5168925329319[/C][/ROW]
[ROW][C]10[/C][C]2995.55[/C][C]2935.29605125264[/C][C]60.253948747363[/C][/ROW]
[ROW][C]11[/C][C]2833.18[/C][C]2919.28188226414[/C][C]-86.1018822641426[/C][/ROW]
[ROW][C]12[/C][C]2848.96[/C][C]2855.47859295501[/C][C]-6.51859295501351[/C][/ROW]
[ROW][C]13[/C][C]2794.83[/C][C]2812.36782137017[/C][C]-17.5378213701703[/C][/ROW]
[ROW][C]14[/C][C]2845.26[/C][C]2757.54789352681[/C][C]87.7121064731903[/C][/ROW]
[ROW][C]15[/C][C]2915.02[/C][C]2856.97694656422[/C][C]58.0430534357808[/C][/ROW]
[ROW][C]16[/C][C]2892.63[/C][C]2964.02966983424[/C][C]-71.3996698342379[/C][/ROW]
[ROW][C]17[/C][C]2604.42[/C][C]2771.99319580253[/C][C]-167.573195802529[/C][/ROW]
[ROW][C]18[/C][C]2641.65[/C][C]2510.82036910092[/C][C]130.829630899079[/C][/ROW]
[ROW][C]19[/C][C]2659.81[/C][C]2746.15203114046[/C][C]-86.342031140456[/C][/ROW]
[ROW][C]20[/C][C]2638.53[/C][C]2570.81785006235[/C][C]67.7121499376502[/C][/ROW]
[ROW][C]21[/C][C]2720.25[/C][C]2696.56200650776[/C][C]23.6879934922381[/C][/ROW]
[ROW][C]22[/C][C]2745.88[/C][C]2714.27821074861[/C][C]31.6017892513861[/C][/ROW]
[ROW][C]23[/C][C]2735.7[/C][C]2669.85678407106[/C][C]65.8432159289373[/C][/ROW]
[ROW][C]24[/C][C]2811.7[/C][C]2851.96961274128[/C][C]-40.2696127412817[/C][/ROW]
[ROW][C]25[/C][C]2799.43[/C][C]2775.18190209623[/C][C]24.2480979037658[/C][/ROW]
[ROW][C]26[/C][C]2555.28[/C][C]2789.6342509918[/C][C]-234.354250991803[/C][/ROW]
[ROW][C]27[/C][C]2304.98[/C][C]2402.04030414991[/C][C]-97.0603041499127[/C][/ROW]
[ROW][C]28[/C][C]2214.95[/C][C]2245.10268366841[/C][C]-30.1526836684080[/C][/ROW]
[ROW][C]29[/C][C]2065.81[/C][C]2084.37739112909[/C][C]-18.5673911290882[/C][/ROW]
[ROW][C]30[/C][C]1940.49[/C][C]2024.90007871979[/C][C]-84.4100787197871[/C][/ROW]
[ROW][C]31[/C][C]2042[/C][C]1928.48776933105[/C][C]113.512230668955[/C][/ROW]
[ROW][C]32[/C][C]1995.37[/C][C]2069.45408700856[/C][C]-74.0840870085609[/C][/ROW]
[ROW][C]33[/C][C]1946.81[/C][C]2021.19624452210[/C][C]-74.3862445220955[/C][/ROW]
[ROW][C]34[/C][C]1765.9[/C][C]1912.8026291099[/C][C]-146.902629109899[/C][/ROW]
[ROW][C]35[/C][C]1635.25[/C][C]1629.97917168123[/C][C]5.27082831877324[/C][/ROW]
[ROW][C]36[/C][C]1833.42[/C][C]1742.61948785501[/C][C]90.8005121449927[/C][/ROW]
[ROW][C]37[/C][C]1910.43[/C][C]1895.58550176952[/C][C]14.8444982304792[/C][/ROW]
[ROW][C]38[/C][C]1959.67[/C][C]1946.06005940324[/C][C]13.6099405967615[/C][/ROW]
[ROW][C]39[/C][C]1969.6[/C][C]2007.11063631402[/C][C]-37.5106363140189[/C][/ROW]
[ROW][C]40[/C][C]2061.41[/C][C]2045.96944670699[/C][C]15.4405532930057[/C][/ROW]
[ROW][C]41[/C][C]2093.48[/C][C]2056.26515492878[/C][C]37.2148450712213[/C][/ROW]
[ROW][C]42[/C][C]2120.88[/C][C]2182.70140106225[/C][C]-61.8214010622488[/C][/ROW]
[ROW][C]43[/C][C]2174.56[/C][C]2200.39229265401[/C][C]-25.8322926540103[/C][/ROW]
[ROW][C]44[/C][C]2196.72[/C][C]2174.92015732187[/C][C]21.7998426781308[/C][/ROW]
[ROW][C]45[/C][C]2350.44[/C][C]2283.22485643721[/C][C]67.2151435627893[/C][/ROW]
[ROW][C]46[/C][C]2440.25[/C][C]2385.20310888885[/C][C]55.0468911111502[/C][/ROW]
[ROW][C]47[/C][C]2408.64[/C][C]2393.65216198357[/C][C]14.9878380164321[/C][/ROW]
[ROW][C]48[/C][C]2472.81[/C][C]2516.82230644870[/C][C]-44.0123064486975[/C][/ROW]
[ROW][C]49[/C][C]2407.6[/C][C]2455.89417346902[/C][C]-48.2941734690235[/C][/ROW]
[ROW][C]50[/C][C]2454.62[/C][C]2384.75945536446[/C][C]69.8605446355425[/C][/ROW]
[ROW][C]51[/C][C]2448.05[/C][C]2488.97726702566[/C][C]-40.9272670256572[/C][/ROW]
[ROW][C]52[/C][C]2497.84[/C][C]2473.52663285325[/C][C]24.3133671467537[/C][/ROW]
[ROW][C]53[/C][C]2645.64[/C][C]2453.28052966284[/C][C]192.359470337158[/C][/ROW]
[ROW][C]54[/C][C]2756.76[/C][C]2793.36802250386[/C][C]-36.6080225038557[/C][/ROW]
[ROW][C]55[/C][C]2849.27[/C][C]2855.57228421076[/C][C]-6.30228421075798[/C][/ROW]
[ROW][C]56[/C][C]2921.44[/C][C]2886.61272397177[/C][C]34.8272760282317[/C][/ROW]
[/TABLE]
Source: https://freestatistics.org/blog/index.php?pk=57557&T=4

Globally Unique Identifier (entire table): ba.freestatistics.org/blog/index.php?pk=57557&T=4

As an alternative you can also use a QR Code:  

The GUIDs for individual cells are displayed in the table below:

Multiple Linear Regression - Actuals, Interpolation, and Residuals
Time or IndexActualsInterpolationForecastResidualsPrediction Error
12863.362836.6206012950526.7393987049488
22897.062833.8883407136963.1716592863088
33012.612895.15484594619117.455154053808
43142.953081.1515669371161.7984330628865
53032.933076.36372847676-43.4337284767624
63045.782993.7701286131952.0098713868124
73110.523105.555622663734.96437733626984
83013.243063.49518163545-50.255181635452
92987.13003.61689253293-16.5168925329319
102995.552935.2960512526460.253948747363
112833.182919.28188226414-86.1018822641426
122848.962855.47859295501-6.51859295501351
132794.832812.36782137017-17.5378213701703
142845.262757.5478935268187.7121064731903
152915.022856.9769465642258.0430534357808
162892.632964.02966983424-71.3996698342379
172604.422771.99319580253-167.573195802529
182641.652510.82036910092130.829630899079
192659.812746.15203114046-86.342031140456
202638.532570.8178500623567.7121499376502
212720.252696.5620065077623.6879934922381
222745.882714.2782107486131.6017892513861
232735.72669.8567840710665.8432159289373
242811.72851.96961274128-40.2696127412817
252799.432775.1819020962324.2480979037658
262555.282789.6342509918-234.354250991803
272304.982402.04030414991-97.0603041499127
282214.952245.10268366841-30.1526836684080
292065.812084.37739112909-18.5673911290882
301940.492024.90007871979-84.4100787197871
3120421928.48776933105113.512230668955
321995.372069.45408700856-74.0840870085609
331946.812021.19624452210-74.3862445220955
341765.91912.8026291099-146.902629109899
351635.251629.979171681235.27082831877324
361833.421742.6194878550190.8005121449927
371910.431895.5855017695214.8444982304792
381959.671946.0600594032413.6099405967615
391969.62007.11063631402-37.5106363140189
402061.412045.9694467069915.4405532930057
412093.482056.2651549287837.2148450712213
422120.882182.70140106225-61.8214010622488
432174.562200.39229265401-25.8322926540103
442196.722174.9201573218721.7998426781308
452350.442283.2248564372167.2151435627893
462440.252385.2031088888555.0468911111502
472408.642393.6521619835714.9878380164321
482472.812516.82230644870-44.0123064486975
492407.62455.89417346902-48.2941734690235
502454.622384.7594553644669.8605446355425
512448.052488.97726702566-40.9272670256572
522497.842473.5266328532524.3133671467537
532645.642453.28052966284192.359470337158
542756.762793.36802250386-36.6080225038557
552849.272855.57228421076-6.30228421075798
562921.442886.6127239717734.8272760282317


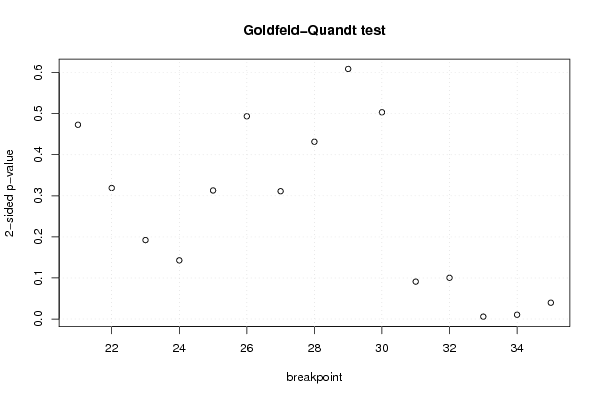
Goldfeld-Quandt test for Heteroskedasticity
p-valuesAlternative Hypothesis
breakpoint indexgreater2-sidedless
210.2364608480771820.4729216961543630.763539151922818
220.1595158151742210.3190316303484410.84048418482578
230.09610974898740670.1922194979748130.903890251012593
240.07145644245186790.1429128849037360.928543557548132
250.1565055862057490.3130111724114980.843494413794251
260.7531664922087770.4936670155824450.246833507791223
270.8444134847581060.3111730304837880.155586515241894
280.7841960831399150.431607833720170.215803916860085
290.695594636682640.608810726634720.30440536331736
300.7483408101751160.5033183796497670.251659189824884
310.9544502242888690.09109955142226250.0455497757111313
320.949790205415830.1004195891683400.0502097945841699
330.9970859263994750.005828147201049350.00291407360052468
340.9947536096649520.01049278067009660.00524639033504832
350.9801254444306830.03974911113863460.0198745555693173

\begin{tabular}{lllllllll}
\hline
Goldfeld-Quandt test for Heteroskedasticity \tabularnewline
p-values & Alternative Hypothesis \tabularnewline
breakpoint index & greater & 2-sided & less \tabularnewline
21 & 0.236460848077182 & 0.472921696154363 & 0.763539151922818 \tabularnewline
22 & 0.159515815174221 & 0.319031630348441 & 0.84048418482578 \tabularnewline
23 & 0.0961097489874067 & 0.192219497974813 & 0.903890251012593 \tabularnewline
24 & 0.0714564424518679 & 0.142912884903736 & 0.928543557548132 \tabularnewline
25 & 0.156505586205749 & 0.313011172411498 & 0.843494413794251 \tabularnewline
26 & 0.753166492208777 & 0.493667015582445 & 0.246833507791223 \tabularnewline
27 & 0.844413484758106 & 0.311173030483788 & 0.155586515241894 \tabularnewline
28 & 0.784196083139915 & 0.43160783372017 & 0.215803916860085 \tabularnewline
29 & 0.69559463668264 & 0.60881072663472 & 0.30440536331736 \tabularnewline
30 & 0.748340810175116 & 0.503318379649767 & 0.251659189824884 \tabularnewline
31 & 0.954450224288869 & 0.0910995514222625 & 0.0455497757111313 \tabularnewline
32 & 0.94979020541583 & 0.100419589168340 & 0.0502097945841699 \tabularnewline
33 & 0.997085926399475 & 0.00582814720104935 & 0.00291407360052468 \tabularnewline
34 & 0.994753609664952 & 0.0104927806700966 & 0.00524639033504832 \tabularnewline
35 & 0.980125444430683 & 0.0397491111386346 & 0.0198745555693173 \tabularnewline
\hline
\end{tabular}
%Source: https://freestatistics.org/blog/index.php?pk=57557&T=5

[TABLE]
[ROW][C]Goldfeld-Quandt test for Heteroskedasticity[/C][/ROW]
[ROW][C]p-values[/C][C]Alternative Hypothesis[/C][/ROW]
[ROW][C]breakpoint index[/C][C]greater[/C][C]2-sided[/C][C]less[/C][/ROW]
[ROW][C]21[/C][C]0.236460848077182[/C][C]0.472921696154363[/C][C]0.763539151922818[/C][/ROW]
[ROW][C]22[/C][C]0.159515815174221[/C][C]0.319031630348441[/C][C]0.84048418482578[/C][/ROW]
[ROW][C]23[/C][C]0.0961097489874067[/C][C]0.192219497974813[/C][C]0.903890251012593[/C][/ROW]
[ROW][C]24[/C][C]0.0714564424518679[/C][C]0.142912884903736[/C][C]0.928543557548132[/C][/ROW]
[ROW][C]25[/C][C]0.156505586205749[/C][C]0.313011172411498[/C][C]0.843494413794251[/C][/ROW]
[ROW][C]26[/C][C]0.753166492208777[/C][C]0.493667015582445[/C][C]0.246833507791223[/C][/ROW]
[ROW][C]27[/C][C]0.844413484758106[/C][C]0.311173030483788[/C][C]0.155586515241894[/C][/ROW]
[ROW][C]28[/C][C]0.784196083139915[/C][C]0.43160783372017[/C][C]0.215803916860085[/C][/ROW]
[ROW][C]29[/C][C]0.69559463668264[/C][C]0.60881072663472[/C][C]0.30440536331736[/C][/ROW]
[ROW][C]30[/C][C]0.748340810175116[/C][C]0.503318379649767[/C][C]0.251659189824884[/C][/ROW]
[ROW][C]31[/C][C]0.954450224288869[/C][C]0.0910995514222625[/C][C]0.0455497757111313[/C][/ROW]
[ROW][C]32[/C][C]0.94979020541583[/C][C]0.100419589168340[/C][C]0.0502097945841699[/C][/ROW]
[ROW][C]33[/C][C]0.997085926399475[/C][C]0.00582814720104935[/C][C]0.00291407360052468[/C][/ROW]
[ROW][C]34[/C][C]0.994753609664952[/C][C]0.0104927806700966[/C][C]0.00524639033504832[/C][/ROW]
[ROW][C]35[/C][C]0.980125444430683[/C][C]0.0397491111386346[/C][C]0.0198745555693173[/C][/ROW]
[/TABLE]
Source: https://freestatistics.org/blog/index.php?pk=57557&T=5

Globally Unique Identifier (entire table): ba.freestatistics.org/blog/index.php?pk=57557&T=5

As an alternative you can also use a QR Code:  

The GUIDs for individual cells are displayed in the table below:

Goldfeld-Quandt test for Heteroskedasticity
p-valuesAlternative Hypothesis
breakpoint indexgreater2-sidedless
210.2364608480771820.4729216961543630.763539151922818
220.1595158151742210.3190316303484410.84048418482578
230.09610974898740670.1922194979748130.903890251012593
240.07145644245186790.1429128849037360.928543557548132
250.1565055862057490.3130111724114980.843494413794251
260.7531664922087770.4936670155824450.246833507791223
270.8444134847581060.3111730304837880.155586515241894
280.7841960831399150.431607833720170.215803916860085
290.695594636682640.608810726634720.30440536331736
300.7483408101751160.5033183796497670.251659189824884
310.9544502242888690.09109955142226250.0455497757111313
320.949790205415830.1004195891683400.0502097945841699
330.9970859263994750.005828147201049350.00291407360052468
340.9947536096649520.01049278067009660.00524639033504832
350.9801254444306830.03974911113863460.0198745555693173


Meta Analysis of Goldfeld-Quandt test for Heteroskedasticity
Description# significant tests% significant testsOK/NOK
1% type I error level10.0666666666666667NOK
5% type I error level30.2NOK
10% type I error level40.266666666666667NOK

\begin{tabular}{lllllllll}
\hline
Meta Analysis of Goldfeld-Quandt test for Heteroskedasticity \tabularnewline
Description & # significant tests & % significant tests & OK/NOK \tabularnewline
1% type I error level & 1 & 0.0666666666666667 & NOK \tabularnewline
5% type I error level & 3 & 0.2 & NOK \tabularnewline
10% type I error level & 4 & 0.266666666666667 & NOK \tabularnewline
\hline
\end{tabular}
%Source: https://freestatistics.org/blog/index.php?pk=57557&T=6

[TABLE]
[ROW][C]Meta Analysis of Goldfeld-Quandt test for Heteroskedasticity[/C][/ROW]
[ROW][C]Description[/C][C]# significant tests[/C][C]% significant tests[/C][C]OK/NOK[/C][/ROW]
[ROW][C]1% type I error level[/C][C]1[/C][C]0.0666666666666667[/C][C]NOK[/C][/ROW]
[ROW][C]5% type I error level[/C][C]3[/C][C]0.2[/C][C]NOK[/C][/ROW]
[ROW][C]10% type I error level[/C][C]4[/C][C]0.266666666666667[/C][C]NOK[/C][/ROW]
[/TABLE]
Source: https://freestatistics.org/blog/index.php?pk=57557&T=6

Globally Unique Identifier (entire table): ba.freestatistics.org/blog/index.php?pk=57557&T=6

As an alternative you can also use a QR Code:  

The GUIDs for individual cells are displayed in the table below:

Meta Analysis of Goldfeld-Quandt test for Heteroskedasticity
Description# significant tests% significant testsOK/NOK
1% type I error level10.0666666666666667NOK
5% type I error level30.2NOK
10% type I error level40.266666666666667NOK


Parameters (Session):
par1 = 1 ; par2 = Include Monthly Dummies ; par3 = Linear Trend ;
Parameters (R input):
par1 = 1 ; par2 = Include Monthly Dummies ; par3 = Linear Trend ;
R code (references can be found in the software module):
library(lattice)
library(lmtest)
n25 <- 25 #minimum number of obs. for Goldfeld-Quandt test
par1 <- as.numeric(par1)
x <- t(y)
k <- length(x[1,])
n <- length(x[,1])
x1 <- cbind(x[,par1], x[,1:k!=par1])
mycolnames <- c(colnames(x)[par1], colnames(x)[1:k!=par1])
colnames(x1) <- mycolnames #colnames(x)[par1]
x <- x1
if (par3 == 'First Differences'){
x2 <- array(0, dim=c(n-1,k), dimnames=list(1:(n-1), paste('(1-B)',colnames(x),sep='')))
for (i in 1:n-1) {
for (j in 1:k) {
x2[i,j] <- x[i+1,j] - x[i,j]
}
}
x <- x2
}
if (par2 == 'Include Monthly Dummies'){
x2 <- array(0, dim=c(n,11), dimnames=list(1:n, paste('M', seq(1:11), sep ='')))
for (i in 1:11){
x2[seq(i,n,12),i] <- 1
}
x <- cbind(x, x2)
}
if (par2 == 'Include Quarterly Dummies'){
x2 <- array(0, dim=c(n,3), dimnames=list(1:n, paste('Q', seq(1:3), sep ='')))
for (i in 1:3){
x2[seq(i,n,4),i] <- 1
}
x <- cbind(x, x2)
}
k <- length(x[1,])
if (par3 == 'Linear Trend'){
x <- cbind(x, c(1:n))
colnames(x)[k+1] <- 't'
}
x
k <- length(x[1,])
df <- as.data.frame(x)
(mylm <- lm(df))
(mysum <- summary(mylm))
if (n > n25) {
kp3 <- k + 3
nmkm3 <- n - k - 3
gqarr <- array(NA, dim=c(nmkm3-kp3+1,3))
numgqtests <- 0
numsignificant1 <- 0
numsignificant5 <- 0
numsignificant10 <- 0
for (mypoint in kp3:nmkm3) {
j <- 0
numgqtests <- numgqtests + 1
for (myalt in c('greater', 'two.sided', 'less')) {
j <- j + 1
gqarr[mypoint-kp3+1,j] <- gqtest(mylm, point=mypoint, alternative=myalt)$p.value
}
if (gqarr[mypoint-kp3+1,2] < 0.01) numsignificant1 <- numsignificant1 + 1
if (gqarr[mypoint-kp3+1,2] < 0.05) numsignificant5 <- numsignificant5 + 1
if (gqarr[mypoint-kp3+1,2] < 0.10) numsignificant10 <- numsignificant10 + 1
}
gqarr
}
bitmap(file='test0.png')
plot(x[,1], type='l', main='Actuals and Interpolation', ylab='value of Actuals and Interpolation (dots)', xlab='time or index')
points(x[,1]-mysum$resid)
grid()
dev.off()
bitmap(file='test1.png')
plot(mysum$resid, type='b', pch=19, main='Residuals', ylab='value of Residuals', xlab='time or index')
grid()
dev.off()
bitmap(file='test2.png')
hist(mysum$resid, main='Residual Histogram', xlab='values of Residuals')
grid()
dev.off()
bitmap(file='test3.png')
densityplot(~mysum$resid,col='black',main='Residual Density Plot', xlab='values of Residuals')
dev.off()
bitmap(file='test4.png')
qqnorm(mysum$resid, main='Residual Normal Q-Q Plot')
qqline(mysum$resid)
grid()
dev.off()
(myerror <- as.ts(mysum$resid))
bitmap(file='test5.png')
dum <- cbind(lag(myerror,k=1),myerror)
dum
dum1 <- dum[2:length(myerror),]
dum1
z <- as.data.frame(dum1)
z
plot(z,main=paste('Residual Lag plot, lowess, and regression line'), ylab='values of Residuals', xlab='lagged values of Residuals')
lines(lowess(z))
abline(lm(z))
grid()
dev.off()
bitmap(file='test6.png')
acf(mysum$resid, lag.max=length(mysum$resid)/2, main='Residual Autocorrelation Function')
grid()
dev.off()
bitmap(file='test7.png')
pacf(mysum$resid, lag.max=length(mysum$resid)/2, main='Residual Partial Autocorrelation Function')
grid()
dev.off()
bitmap(file='test8.png')
opar <- par(mfrow = c(2,2), oma = c(0, 0, 1.1, 0))
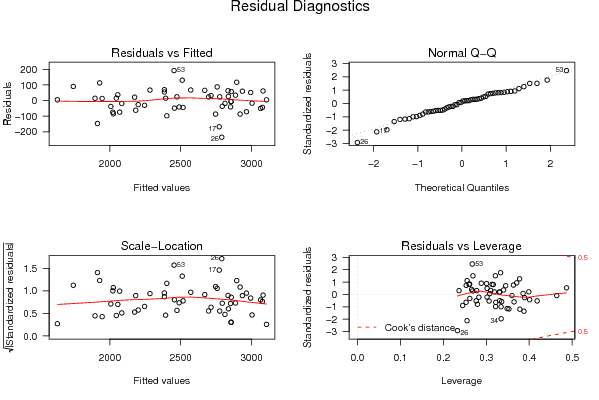
plot(mylm, las = 1, sub='Residual Diagnostics')
par(opar)
dev.off()
if (n > n25) {
bitmap(file='test9.png')
plot(kp3:nmkm3,gqarr[,2], main='Goldfeld-Quandt test',ylab='2-sided p-value',xlab='breakpoint')
grid()
dev.off()
}
load(file='createtable')
a<-table.start()
a<-table.row.start(a)
a<-table.element(a, 'Multiple Linear Regression - Estimated Regression Equation', 1, TRUE)
a<-table.row.end(a)
myeq <- colnames(x)[1]
myeq <- paste(myeq, '[t] = ', sep='')
for (i in 1:k){
if (mysum$coefficients[i,1] > 0) myeq <- paste(myeq, '+', '')
myeq <- paste(myeq, mysum$coefficients[i,1], sep=' ')
if (rownames(mysum$coefficients)[i] != '(Intercept)') {
myeq <- paste(myeq, rownames(mysum$coefficients)[i], sep='')
if (rownames(mysum$coefficients)[i] != 't') myeq <- paste(myeq, '[t]', sep='')
}
}
myeq <- paste(myeq, ' + e[t]')
a<-table.row.start(a)
a<-table.element(a, myeq)
a<-table.row.end(a)
a<-table.end(a)
table.save(a,file='mytable1.tab')
a<-table.start()
a<-table.row.start(a)
a<-table.element(a,hyperlink('ols1.htm','Multiple Linear Regression - Ordinary Least Squares',''), 6, TRUE)
a<-table.row.end(a)
a<-table.row.start(a)
a<-table.element(a,'Variable',header=TRUE)
a<-table.element(a,'Parameter',header=TRUE)
a<-table.element(a,'S.D.',header=TRUE)
a<-table.element(a,'T-STAT
H0: parameter = 0',header=TRUE)
a<-table.element(a,'2-tail p-value',header=TRUE)
a<-table.element(a,'1-tail p-value',header=TRUE)
a<-table.row.end(a)
for (i in 1:k){
a<-table.row.start(a)
a<-table.element(a,rownames(mysum$coefficients)[i],header=TRUE)
a<-table.element(a,mysum$coefficients[i,1])
a<-table.element(a, round(mysum$coefficients[i,2],6))
a<-table.element(a, round(mysum$coefficients[i,3],4))
a<-table.element(a, round(mysum$coefficients[i,4],6))
a<-table.element(a, round(mysum$coefficients[i,4]/2,6))
a<-table.row.end(a)
}
a<-table.end(a)
table.save(a,file='mytable2.tab')
a<-table.start()
a<-table.row.start(a)
a<-table.element(a, 'Multiple Linear Regression - Regression Statistics', 2, TRUE)
a<-table.row.end(a)
a<-table.row.start(a)
a<-table.element(a, 'Multiple R',1,TRUE)
a<-table.element(a, sqrt(mysum$r.squared))
a<-table.row.end(a)
a<-table.row.start(a)
a<-table.element(a, 'R-squared',1,TRUE)
a<-table.element(a, mysum$r.squared)
a<-table.row.end(a)
a<-table.row.start(a)
a<-table.element(a, 'Adjusted R-squared',1,TRUE)
a<-table.element(a, mysum$adj.r.squared)
a<-table.row.end(a)
a<-table.row.start(a)
a<-table.element(a, 'F-TEST (value)',1,TRUE)
a<-table.element(a, mysum$fstatistic[1])
a<-table.row.end(a)
a<-table.row.start(a)
a<-table.element(a, 'F-TEST (DF numerator)',1,TRUE)
a<-table.element(a, mysum$fstatistic[2])
a<-table.row.end(a)
a<-table.row.start(a)
a<-table.element(a, 'F-TEST (DF denominator)',1,TRUE)
a<-table.element(a, mysum$fstatistic[3])
a<-table.row.end(a)
a<-table.row.start(a)
a<-table.element(a, 'p-value',1,TRUE)
a<-table.element(a, 1-pf(mysum$fstatistic[1],mysum$fstatistic[2],mysum$fstatistic[3]))
a<-table.row.end(a)
a<-table.row.start(a)
a<-table.element(a, 'Multiple Linear Regression - Residual Statistics', 2, TRUE)
a<-table.row.end(a)
a<-table.row.start(a)
a<-table.element(a, 'Residual Standard Deviation',1,TRUE)
a<-table.element(a, mysum$sigma)
a<-table.row.end(a)
a<-table.row.start(a)
a<-table.element(a, 'Sum Squared Residuals',1,TRUE)
a<-table.element(a, sum(myerror*myerror))
a<-table.row.end(a)
a<-table.end(a)
table.save(a,file='mytable3.tab')
a<-table.start()
a<-table.row.start(a)
a<-table.element(a, 'Multiple Linear Regression - Actuals, Interpolation, and Residuals', 4, TRUE)
a<-table.row.end(a)
a<-table.row.start(a)
a<-table.element(a, 'Time or Index', 1, TRUE)
a<-table.element(a, 'Actuals', 1, TRUE)
a<-table.element(a, 'Interpolation
Forecast', 1, TRUE)
a<-table.element(a, 'Residuals
Prediction Error', 1, TRUE)
a<-table.row.end(a)
for (i in 1:n) {
a<-table.row.start(a)
a<-table.element(a,i, 1, TRUE)
a<-table.element(a,x[i])
a<-table.element(a,x[i]-mysum$resid[i])
a<-table.element(a,mysum$resid[i])
a<-table.row.end(a)
}
a<-table.end(a)
table.save(a,file='mytable4.tab')
if (n > n25) {
a<-table.start()
a<-table.row.start(a)
a<-table.element(a,'Goldfeld-Quandt test for Heteroskedasticity',4,TRUE)
a<-table.row.end(a)
a<-table.row.start(a)
a<-table.element(a,'p-values',header=TRUE)
a<-table.element(a,'Alternative Hypothesis',3,header=TRUE)
a<-table.row.end(a)
a<-table.row.start(a)
a<-table.element(a,'breakpoint index',header=TRUE)
a<-table.element(a,'greater',header=TRUE)
a<-table.element(a,'2-sided',header=TRUE)
a<-table.element(a,'less',header=TRUE)
a<-table.row.end(a)
for (mypoint in kp3:nmkm3) {
a<-table.row.start(a)
a<-table.element(a,mypoint,header=TRUE)
a<-table.element(a,gqarr[mypoint-kp3+1,1])
a<-table.element(a,gqarr[mypoint-kp3+1,2])
a<-table.element(a,gqarr[mypoint-kp3+1,3])
a<-table.row.end(a)
}
a<-table.end(a)
table.save(a,file='mytable5.tab')
a<-table.start()
a<-table.row.start(a)
a<-table.element(a,'Meta Analysis of Goldfeld-Quandt test for Heteroskedasticity',4,TRUE)
a<-table.row.end(a)
a<-table.row.start(a)
a<-table.element(a,'Description',header=TRUE)
a<-table.element(a,'# significant tests',header=TRUE)
a<-table.element(a,'% significant tests',header=TRUE)
a<-table.element(a,'OK/NOK',header=TRUE)
a<-table.row.end(a)
a<-table.row.start(a)
a<-table.element(a,'1% type I error level',header=TRUE)
a<-table.element(a,numsignificant1)
a<-table.element(a,numsignificant1/numgqtests)
if (numsignificant1/numgqtests < 0.01) dum <- 'OK' else dum <- 'NOK'
a<-table.element(a,dum)
a<-table.row.end(a)
a<-table.row.start(a)
a<-table.element(a,'5% type I error level',header=TRUE)
a<-table.element(a,numsignificant5)
a<-table.element(a,numsignificant5/numgqtests)
if (numsignificant5/numgqtests < 0.05) dum <- 'OK' else dum <- 'NOK'
a<-table.element(a,dum)
a<-table.row.end(a)
a<-table.row.start(a)
a<-table.element(a,'10% type I error level',header=TRUE)
a<-table.element(a,numsignificant10)
a<-table.element(a,numsignificant10/numgqtests)
if (numsignificant10/numgqtests < 0.1) dum <- 'OK' else dum <- 'NOK'
a<-table.element(a,dum)
a<-table.row.end(a)
a<-table.end(a)
table.save(a,file='mytable6.tab')
}