Free Statistics

of Irreproducible Research!

Author's title

Author*The author of this computation has been verified*
R Software Modulerwasp_multipleregression.wasp
Title produced by softwareMultiple Regression
Date of computationWed, 18 Nov 2009 10:51:18 -0700
Cite this page as followsStatistical Computations at FreeStatistics.org, Office for Research Development and Education, URL https://freestatistics.org/blog/index.php?v=date/2009/Nov/18/t1258566794ysqw2vboibqcrot.htm/, Retrieved Sat, 04 May 2024 14:40:33 +0000
Statistical Computations at FreeStatistics.org, Office for Research Development and Education, URL https://freestatistics.org/blog/index.php?pk=57554, Retrieved Sat, 04 May 2024 14:40:33 +0000
QR Codes:

Original text written by user:
IsPrivate?No (this computation is public)
User-defined keywords
Estimated Impact179
Family? (F = Feedback message, R = changed R code, M = changed R Module, P = changed Parameters, D = changed Data)
-     [Multiple Regression] [Q1 The Seatbeltlaw] [2007-11-14 19:27:43] [8cd6641b921d30ebe00b648d1481bba0]
- RMPD  [Multiple Regression] [Seatbelt] [2009-11-12 14:03:14] [b98453cac15ba1066b407e146608df68]
-    D      [Multiple Regression] [SHw WS7] [2009-11-18 17:51:18] [d9efc2d105d810fc0b0ac636e31105d1] [Current]
Feedback Forum

Post a new message
Dataseries X:
627	356
696	386
825	444
677	387
656	327
785	448
412	225
352	182
839	460
729	411
696	342
641	361
695	377
638	331
762	428
635	340
721	352
854	461
418	221
367	198
824	422
687	329
601	320
676	375
740	364
691	351
683	380
594	319
729	322
731	386
386	221
331	187
707	344
715	342
657	365
653	313
642	356
643	337
718	389
654	326
632	343
731	357
392	220
344	228
792	391
852	425
649	332
629	298
685	360
617	326
715	325
715	393
629	301
916	426
531	265
357	210
917	429
828	440
708	357
858	431


Summary of computational transaction
Raw Inputview raw input (R code)
Raw Outputview raw output of R engine
Computing time3 seconds
R Server'Gwilym Jenkins' @ 72.249.127.135

\begin{tabular}{lllllllll}
\hline
Summary of computational transaction \tabularnewline
Raw Input & view raw input (R code)  \tabularnewline
Raw Output & view raw output of R engine  \tabularnewline
Computing time & 3 seconds \tabularnewline
R Server & 'Gwilym Jenkins' @ 72.249.127.135 \tabularnewline
\hline
\end{tabular}
%Source: https://freestatistics.org/blog/index.php?pk=57554&T=0

[TABLE]
[ROW][C]Summary of computational transaction[/C][/ROW]
[ROW][C]Raw Input[/C][C]view raw input (R code) [/C][/ROW]
[ROW][C]Raw Output[/C][C]view raw output of R engine [/C][/ROW]
[ROW][C]Computing time[/C][C]3 seconds[/C][/ROW]
[ROW][C]R Server[/C][C]'Gwilym Jenkins' @ 72.249.127.135[/C][/ROW]
[/TABLE]
Source: https://freestatistics.org/blog/index.php?pk=57554&T=0

Globally Unique Identifier (entire table): ba.freestatistics.org/blog/index.php?pk=57554&T=0

As an alternative you can also use a QR Code:  

The GUIDs for individual cells are displayed in the table below:

Summary of computational transaction
Raw Inputview raw input (R code)
Raw Outputview raw output of R engine
Computing time3 seconds
R Server'Gwilym Jenkins' @ 72.249.127.135


Multiple Linear Regression - Estimated Regression Equation
Y[t] = + 236.298697179728 + 1.27981243762731X[t] -22.5586870633913M1[t] -22.3697630863033M2[t] + 1.07905234521315M3[t] -33.072487662169M4[t] + 16.0430108408864M5[t] + 35.2112537423614M6[t] -103.367482809061M7[t] -143.340997142818M8[t] + 55.8020533431762M9[t] + 27.5423396081969M10[t] -13.3303257734214M11[t] + e[t]

\begin{tabular}{lllllllll}
\hline
Multiple Linear Regression - Estimated Regression Equation \tabularnewline
Y[t] =  +  236.298697179728 +  1.27981243762731X[t] -22.5586870633913M1[t] -22.3697630863033M2[t] +  1.07905234521315M3[t] -33.072487662169M4[t] +  16.0430108408864M5[t] +  35.2112537423614M6[t] -103.367482809061M7[t] -143.340997142818M8[t] +  55.8020533431762M9[t] +  27.5423396081969M10[t] -13.3303257734214M11[t]  + e[t] \tabularnewline
\hline
\end{tabular}
%Source: https://freestatistics.org/blog/index.php?pk=57554&T=1

[TABLE]
[ROW][C]Multiple Linear Regression - Estimated Regression Equation[/C][/ROW]
[ROW][C]Y[t] =  +  236.298697179728 +  1.27981243762731X[t] -22.5586870633913M1[t] -22.3697630863033M2[t] +  1.07905234521315M3[t] -33.072487662169M4[t] +  16.0430108408864M5[t] +  35.2112537423614M6[t] -103.367482809061M7[t] -143.340997142818M8[t] +  55.8020533431762M9[t] +  27.5423396081969M10[t] -13.3303257734214M11[t]  + e[t][/C][/ROW]
[/TABLE]
Source: https://freestatistics.org/blog/index.php?pk=57554&T=1

Globally Unique Identifier (entire table): ba.freestatistics.org/blog/index.php?pk=57554&T=1

As an alternative you can also use a QR Code:  

The GUIDs for individual cells are displayed in the table below:

Multiple Linear Regression - Estimated Regression Equation
Y[t] = + 236.298697179728 + 1.27981243762731X[t] -22.5586870633913M1[t] -22.3697630863033M2[t] + 1.07905234521315M3[t] -33.072487662169M4[t] + 16.0430108408864M5[t] + 35.2112537423614M6[t] -103.367482809061M7[t] -143.340997142818M8[t] + 55.8020533431762M9[t] + 27.5423396081969M10[t] -13.3303257734214M11[t] + e[t]


Multiple Linear Regression - Ordinary Least Squares
VariableParameterS.D.T-STATH0: parameter = 02-tail p-value1-tail p-value
(Intercept)236.29869717972861.4691883.84420.0003620.000181
X1.279812437627310.1653777.738800
M1-22.558687063391325.328363-0.89060.3776540.188827
M2-22.369763086303325.349605-0.88250.3820250.191012
M31.0790523452131526.0547760.04140.9671410.48357
M4-33.07248766216925.305548-1.30690.1975960.098798
M516.043010840886425.6814560.62470.5351940.267597
M635.211253742361427.1781.29560.2014480.100724
M7-103.36748280906132.693864-3.16170.0027460.001373
M8-143.34099714281835.970378-3.9850.0002340.000117
M955.802053343176226.8096922.08140.0428690.021434
M1027.542339608196925.9119841.06290.293250.146625
M11-13.330325773421425.38486-0.52510.6019620.300981

\begin{tabular}{lllllllll}
\hline
Multiple Linear Regression - Ordinary Least Squares \tabularnewline
Variable & Parameter & S.D. & T-STATH0: parameter = 0 & 2-tail p-value & 1-tail p-value \tabularnewline
(Intercept) & 236.298697179728 & 61.469188 & 3.8442 & 0.000362 & 0.000181 \tabularnewline
X & 1.27981243762731 & 0.165377 & 7.7388 & 0 & 0 \tabularnewline
M1 & -22.5586870633913 & 25.328363 & -0.8906 & 0.377654 & 0.188827 \tabularnewline
M2 & -22.3697630863033 & 25.349605 & -0.8825 & 0.382025 & 0.191012 \tabularnewline
M3 & 1.07905234521315 & 26.054776 & 0.0414 & 0.967141 & 0.48357 \tabularnewline
M4 & -33.072487662169 & 25.305548 & -1.3069 & 0.197596 & 0.098798 \tabularnewline
M5 & 16.0430108408864 & 25.681456 & 0.6247 & 0.535194 & 0.267597 \tabularnewline
M6 & 35.2112537423614 & 27.178 & 1.2956 & 0.201448 & 0.100724 \tabularnewline
M7 & -103.367482809061 & 32.693864 & -3.1617 & 0.002746 & 0.001373 \tabularnewline
M8 & -143.340997142818 & 35.970378 & -3.985 & 0.000234 & 0.000117 \tabularnewline
M9 & 55.8020533431762 & 26.809692 & 2.0814 & 0.042869 & 0.021434 \tabularnewline
M10 & 27.5423396081969 & 25.911984 & 1.0629 & 0.29325 & 0.146625 \tabularnewline
M11 & -13.3303257734214 & 25.38486 & -0.5251 & 0.601962 & 0.300981 \tabularnewline
\hline
\end{tabular}
%Source: https://freestatistics.org/blog/index.php?pk=57554&T=2

[TABLE]
[ROW][C]Multiple Linear Regression - Ordinary Least Squares[/C][/ROW]
[ROW][C]Variable[/C][C]Parameter[/C][C]S.D.[/C][C]T-STATH0: parameter = 0[/C][C]2-tail p-value[/C][C]1-tail p-value[/C][/ROW]
[ROW][C](Intercept)[/C][C]236.298697179728[/C][C]61.469188[/C][C]3.8442[/C][C]0.000362[/C][C]0.000181[/C][/ROW]
[ROW][C]X[/C][C]1.27981243762731[/C][C]0.165377[/C][C]7.7388[/C][C]0[/C][C]0[/C][/ROW]
[ROW][C]M1[/C][C]-22.5586870633913[/C][C]25.328363[/C][C]-0.8906[/C][C]0.377654[/C][C]0.188827[/C][/ROW]
[ROW][C]M2[/C][C]-22.3697630863033[/C][C]25.349605[/C][C]-0.8825[/C][C]0.382025[/C][C]0.191012[/C][/ROW]
[ROW][C]M3[/C][C]1.07905234521315[/C][C]26.054776[/C][C]0.0414[/C][C]0.967141[/C][C]0.48357[/C][/ROW]
[ROW][C]M4[/C][C]-33.072487662169[/C][C]25.305548[/C][C]-1.3069[/C][C]0.197596[/C][C]0.098798[/C][/ROW]
[ROW][C]M5[/C][C]16.0430108408864[/C][C]25.681456[/C][C]0.6247[/C][C]0.535194[/C][C]0.267597[/C][/ROW]
[ROW][C]M6[/C][C]35.2112537423614[/C][C]27.178[/C][C]1.2956[/C][C]0.201448[/C][C]0.100724[/C][/ROW]
[ROW][C]M7[/C][C]-103.367482809061[/C][C]32.693864[/C][C]-3.1617[/C][C]0.002746[/C][C]0.001373[/C][/ROW]
[ROW][C]M8[/C][C]-143.340997142818[/C][C]35.970378[/C][C]-3.985[/C][C]0.000234[/C][C]0.000117[/C][/ROW]
[ROW][C]M9[/C][C]55.8020533431762[/C][C]26.809692[/C][C]2.0814[/C][C]0.042869[/C][C]0.021434[/C][/ROW]
[ROW][C]M10[/C][C]27.5423396081969[/C][C]25.911984[/C][C]1.0629[/C][C]0.29325[/C][C]0.146625[/C][/ROW]
[ROW][C]M11[/C][C]-13.3303257734214[/C][C]25.38486[/C][C]-0.5251[/C][C]0.601962[/C][C]0.300981[/C][/ROW]
[/TABLE]
Source: https://freestatistics.org/blog/index.php?pk=57554&T=2

Globally Unique Identifier (entire table): ba.freestatistics.org/blog/index.php?pk=57554&T=2

As an alternative you can also use a QR Code:  

The GUIDs for individual cells are displayed in the table below:

Multiple Linear Regression - Ordinary Least Squares
VariableParameterS.D.T-STATH0: parameter = 02-tail p-value1-tail p-value
(Intercept)236.29869717972861.4691883.84420.0003620.000181
X1.279812437627310.1653777.738800
M1-22.558687063391325.328363-0.89060.3776540.188827
M2-22.369763086303325.349605-0.88250.3820250.191012
M31.0790523452131526.0547760.04140.9671410.48357
M4-33.07248766216925.305548-1.30690.1975960.098798
M516.043010840886425.6814560.62470.5351940.267597
M635.211253742361427.1781.29560.2014480.100724
M7-103.36748280906132.693864-3.16170.0027460.001373
M8-143.34099714281835.970378-3.9850.0002340.000117
M955.802053343176226.8096922.08140.0428690.021434
M1027.542339608196925.9119841.06290.293250.146625
M11-13.330325773421425.38486-0.52510.6019620.300981


Multiple Linear Regression - Regression Statistics
Multiple R0.96911896449989
R-squared0.93919156735334
Adjusted R-squared0.923666010081853
F-TEST (value)60.4932596576194
F-TEST (DF numerator)12
F-TEST (DF denominator)47
p-value0
Multiple Linear Regression - Residual Statistics
Residual Standard Deviation40.0058078818977
Sum Squared Residuals75221.8392213155

\begin{tabular}{lllllllll}
\hline
Multiple Linear Regression - Regression Statistics \tabularnewline
Multiple R & 0.96911896449989 \tabularnewline
R-squared & 0.93919156735334 \tabularnewline
Adjusted R-squared & 0.923666010081853 \tabularnewline
F-TEST (value) & 60.4932596576194 \tabularnewline
F-TEST (DF numerator) & 12 \tabularnewline
F-TEST (DF denominator) & 47 \tabularnewline
p-value & 0 \tabularnewline
Multiple Linear Regression - Residual Statistics \tabularnewline
Residual Standard Deviation & 40.0058078818977 \tabularnewline
Sum Squared Residuals & 75221.8392213155 \tabularnewline
\hline
\end{tabular}
%Source: https://freestatistics.org/blog/index.php?pk=57554&T=3

[TABLE]
[ROW][C]Multiple Linear Regression - Regression Statistics[/C][/ROW]
[ROW][C]Multiple R[/C][C]0.96911896449989[/C][/ROW]
[ROW][C]R-squared[/C][C]0.93919156735334[/C][/ROW]
[ROW][C]Adjusted R-squared[/C][C]0.923666010081853[/C][/ROW]
[ROW][C]F-TEST (value)[/C][C]60.4932596576194[/C][/ROW]
[ROW][C]F-TEST (DF numerator)[/C][C]12[/C][/ROW]
[ROW][C]F-TEST (DF denominator)[/C][C]47[/C][/ROW]
[ROW][C]p-value[/C][C]0[/C][/ROW]
[ROW][C]Multiple Linear Regression - Residual Statistics[/C][/ROW]
[ROW][C]Residual Standard Deviation[/C][C]40.0058078818977[/C][/ROW]
[ROW][C]Sum Squared Residuals[/C][C]75221.8392213155[/C][/ROW]
[/TABLE]
Source: https://freestatistics.org/blog/index.php?pk=57554&T=3

Globally Unique Identifier (entire table): ba.freestatistics.org/blog/index.php?pk=57554&T=3

As an alternative you can also use a QR Code:  

The GUIDs for individual cells are displayed in the table below:

Multiple Linear Regression - Regression Statistics
Multiple R0.96911896449989
R-squared0.93919156735334
Adjusted R-squared0.923666010081853
F-TEST (value)60.4932596576194
F-TEST (DF numerator)12
F-TEST (DF denominator)47
p-value0
Multiple Linear Regression - Residual Statistics
Residual Standard Deviation40.0058078818977
Sum Squared Residuals75221.8392213155


Multiple Linear Regression - Actuals, Interpolation, and Residuals
Time or IndexActualsInterpolationForecastResidualsPrediction Error
1627669.35323791166-42.3532379116603
2696707.936535017567-11.9365350175667
3825805.61447183146719.3855281685327
4677698.513622879329-21.5136228793285
5656670.840375124745-14.8403751247454
6785844.865922979125-59.8659229791249
7412420.889012836812-8.88901283681249
8352325.88356368508126.1164363149188
9839880.814471831467-41.8144718314673
10729789.84394865275-60.8439486527499
11696660.66422507484735.3357749251528
12641698.310987163187-57.3109871631874
13695696.229299101833-1.22929910183311
14638637.5468509480650.453149051935056
15762785.13747282943-23.1374728294304
16635638.362438310845-3.36243831084497
17721702.83568606542818.1643139345719
18854861.50348466828-7.50348466827982
19418415.7697630863032.23023691369671
20367346.36056268711820.6394373128819
21824832.18159920163-8.18159920162955
22687684.899328767312.10067123268946
23601632.508351447046-31.5083514470464
24676716.22836128997-40.2283612899698
25740679.59173741267860.4082625873219
26691663.14309970061127.8569002993889
27683723.706475823319-40.7064758233195
28594611.486377120671-17.4863771206715
29729664.44131293660964.5586870633912
30731765.517551846232-34.5175518462316
31386415.769763086303-29.7697630863033
32331332.282625873218-1.28262587321766
33707732.3562290667-25.3562290666994
34715701.53689045646613.4631095435344
35657690.099911140275-33.0999111402754
36653636.87999015707716.1200098429234
37642669.35323791166-27.3532379116596
38643645.225725573829-2.22572557382880
39718735.224787761965-17.2247877619653
40654620.44506418406333.5549358159373
41632691.317374126782-59.3173741267823
42731728.402991155042.59700884496034
43392414.489950648676-22.489950648676
44344384.754935815937-40.7549358159374
45792792.507413635183-0.507413635182951
46852807.76132277953244.2386772204678
47649647.8661006985741.13389930142586
48629617.68280359266711.317196407333
49685674.47248766216910.5275123378311
50617631.147788759928-14.1477887599284
51715653.31679175381761.6832082461825
52715706.1924975050928.80750249490763
53629637.565251746435-8.56525174643535
54916816.71004935132499.289950648676
55531472.08151034190558.9184896580951
56357361.718311938646-4.71831193864575
57917841.14028626502175.8597137349793
58828826.9585093439421.04149065605816
59708679.86141163925728.1385883607431
60858787.89785779709970.1021422029009

\begin{tabular}{lllllllll}
\hline
Multiple Linear Regression - Actuals, Interpolation, and Residuals \tabularnewline
Time or Index & Actuals & InterpolationForecast & ResidualsPrediction Error \tabularnewline
1 & 627 & 669.35323791166 & -42.3532379116603 \tabularnewline
2 & 696 & 707.936535017567 & -11.9365350175667 \tabularnewline
3 & 825 & 805.614471831467 & 19.3855281685327 \tabularnewline
4 & 677 & 698.513622879329 & -21.5136228793285 \tabularnewline
5 & 656 & 670.840375124745 & -14.8403751247454 \tabularnewline
6 & 785 & 844.865922979125 & -59.8659229791249 \tabularnewline
7 & 412 & 420.889012836812 & -8.88901283681249 \tabularnewline
8 & 352 & 325.883563685081 & 26.1164363149188 \tabularnewline
9 & 839 & 880.814471831467 & -41.8144718314673 \tabularnewline
10 & 729 & 789.84394865275 & -60.8439486527499 \tabularnewline
11 & 696 & 660.664225074847 & 35.3357749251528 \tabularnewline
12 & 641 & 698.310987163187 & -57.3109871631874 \tabularnewline
13 & 695 & 696.229299101833 & -1.22929910183311 \tabularnewline
14 & 638 & 637.546850948065 & 0.453149051935056 \tabularnewline
15 & 762 & 785.13747282943 & -23.1374728294304 \tabularnewline
16 & 635 & 638.362438310845 & -3.36243831084497 \tabularnewline
17 & 721 & 702.835686065428 & 18.1643139345719 \tabularnewline
18 & 854 & 861.50348466828 & -7.50348466827982 \tabularnewline
19 & 418 & 415.769763086303 & 2.23023691369671 \tabularnewline
20 & 367 & 346.360562687118 & 20.6394373128819 \tabularnewline
21 & 824 & 832.18159920163 & -8.18159920162955 \tabularnewline
22 & 687 & 684.89932876731 & 2.10067123268946 \tabularnewline
23 & 601 & 632.508351447046 & -31.5083514470464 \tabularnewline
24 & 676 & 716.22836128997 & -40.2283612899698 \tabularnewline
25 & 740 & 679.591737412678 & 60.4082625873219 \tabularnewline
26 & 691 & 663.143099700611 & 27.8569002993889 \tabularnewline
27 & 683 & 723.706475823319 & -40.7064758233195 \tabularnewline
28 & 594 & 611.486377120671 & -17.4863771206715 \tabularnewline
29 & 729 & 664.441312936609 & 64.5586870633912 \tabularnewline
30 & 731 & 765.517551846232 & -34.5175518462316 \tabularnewline
31 & 386 & 415.769763086303 & -29.7697630863033 \tabularnewline
32 & 331 & 332.282625873218 & -1.28262587321766 \tabularnewline
33 & 707 & 732.3562290667 & -25.3562290666994 \tabularnewline
34 & 715 & 701.536890456466 & 13.4631095435344 \tabularnewline
35 & 657 & 690.099911140275 & -33.0999111402754 \tabularnewline
36 & 653 & 636.879990157077 & 16.1200098429234 \tabularnewline
37 & 642 & 669.35323791166 & -27.3532379116596 \tabularnewline
38 & 643 & 645.225725573829 & -2.22572557382880 \tabularnewline
39 & 718 & 735.224787761965 & -17.2247877619653 \tabularnewline
40 & 654 & 620.445064184063 & 33.5549358159373 \tabularnewline
41 & 632 & 691.317374126782 & -59.3173741267823 \tabularnewline
42 & 731 & 728.40299115504 & 2.59700884496034 \tabularnewline
43 & 392 & 414.489950648676 & -22.489950648676 \tabularnewline
44 & 344 & 384.754935815937 & -40.7549358159374 \tabularnewline
45 & 792 & 792.507413635183 & -0.507413635182951 \tabularnewline
46 & 852 & 807.761322779532 & 44.2386772204678 \tabularnewline
47 & 649 & 647.866100698574 & 1.13389930142586 \tabularnewline
48 & 629 & 617.682803592667 & 11.317196407333 \tabularnewline
49 & 685 & 674.472487662169 & 10.5275123378311 \tabularnewline
50 & 617 & 631.147788759928 & -14.1477887599284 \tabularnewline
51 & 715 & 653.316791753817 & 61.6832082461825 \tabularnewline
52 & 715 & 706.192497505092 & 8.80750249490763 \tabularnewline
53 & 629 & 637.565251746435 & -8.56525174643535 \tabularnewline
54 & 916 & 816.710049351324 & 99.289950648676 \tabularnewline
55 & 531 & 472.081510341905 & 58.9184896580951 \tabularnewline
56 & 357 & 361.718311938646 & -4.71831193864575 \tabularnewline
57 & 917 & 841.140286265021 & 75.8597137349793 \tabularnewline
58 & 828 & 826.958509343942 & 1.04149065605816 \tabularnewline
59 & 708 & 679.861411639257 & 28.1385883607431 \tabularnewline
60 & 858 & 787.897857797099 & 70.1021422029009 \tabularnewline
\hline
\end{tabular}
%Source: https://freestatistics.org/blog/index.php?pk=57554&T=4

[TABLE]
[ROW][C]Multiple Linear Regression - Actuals, Interpolation, and Residuals[/C][/ROW]
[ROW][C]Time or Index[/C][C]Actuals[/C][C]InterpolationForecast[/C][C]ResidualsPrediction Error[/C][/ROW]
[ROW][C]1[/C][C]627[/C][C]669.35323791166[/C][C]-42.3532379116603[/C][/ROW]
[ROW][C]2[/C][C]696[/C][C]707.936535017567[/C][C]-11.9365350175667[/C][/ROW]
[ROW][C]3[/C][C]825[/C][C]805.614471831467[/C][C]19.3855281685327[/C][/ROW]
[ROW][C]4[/C][C]677[/C][C]698.513622879329[/C][C]-21.5136228793285[/C][/ROW]
[ROW][C]5[/C][C]656[/C][C]670.840375124745[/C][C]-14.8403751247454[/C][/ROW]
[ROW][C]6[/C][C]785[/C][C]844.865922979125[/C][C]-59.8659229791249[/C][/ROW]
[ROW][C]7[/C][C]412[/C][C]420.889012836812[/C][C]-8.88901283681249[/C][/ROW]
[ROW][C]8[/C][C]352[/C][C]325.883563685081[/C][C]26.1164363149188[/C][/ROW]
[ROW][C]9[/C][C]839[/C][C]880.814471831467[/C][C]-41.8144718314673[/C][/ROW]
[ROW][C]10[/C][C]729[/C][C]789.84394865275[/C][C]-60.8439486527499[/C][/ROW]
[ROW][C]11[/C][C]696[/C][C]660.664225074847[/C][C]35.3357749251528[/C][/ROW]
[ROW][C]12[/C][C]641[/C][C]698.310987163187[/C][C]-57.3109871631874[/C][/ROW]
[ROW][C]13[/C][C]695[/C][C]696.229299101833[/C][C]-1.22929910183311[/C][/ROW]
[ROW][C]14[/C][C]638[/C][C]637.546850948065[/C][C]0.453149051935056[/C][/ROW]
[ROW][C]15[/C][C]762[/C][C]785.13747282943[/C][C]-23.1374728294304[/C][/ROW]
[ROW][C]16[/C][C]635[/C][C]638.362438310845[/C][C]-3.36243831084497[/C][/ROW]
[ROW][C]17[/C][C]721[/C][C]702.835686065428[/C][C]18.1643139345719[/C][/ROW]
[ROW][C]18[/C][C]854[/C][C]861.50348466828[/C][C]-7.50348466827982[/C][/ROW]
[ROW][C]19[/C][C]418[/C][C]415.769763086303[/C][C]2.23023691369671[/C][/ROW]
[ROW][C]20[/C][C]367[/C][C]346.360562687118[/C][C]20.6394373128819[/C][/ROW]
[ROW][C]21[/C][C]824[/C][C]832.18159920163[/C][C]-8.18159920162955[/C][/ROW]
[ROW][C]22[/C][C]687[/C][C]684.89932876731[/C][C]2.10067123268946[/C][/ROW]
[ROW][C]23[/C][C]601[/C][C]632.508351447046[/C][C]-31.5083514470464[/C][/ROW]
[ROW][C]24[/C][C]676[/C][C]716.22836128997[/C][C]-40.2283612899698[/C][/ROW]
[ROW][C]25[/C][C]740[/C][C]679.591737412678[/C][C]60.4082625873219[/C][/ROW]
[ROW][C]26[/C][C]691[/C][C]663.143099700611[/C][C]27.8569002993889[/C][/ROW]
[ROW][C]27[/C][C]683[/C][C]723.706475823319[/C][C]-40.7064758233195[/C][/ROW]
[ROW][C]28[/C][C]594[/C][C]611.486377120671[/C][C]-17.4863771206715[/C][/ROW]
[ROW][C]29[/C][C]729[/C][C]664.441312936609[/C][C]64.5586870633912[/C][/ROW]
[ROW][C]30[/C][C]731[/C][C]765.517551846232[/C][C]-34.5175518462316[/C][/ROW]
[ROW][C]31[/C][C]386[/C][C]415.769763086303[/C][C]-29.7697630863033[/C][/ROW]
[ROW][C]32[/C][C]331[/C][C]332.282625873218[/C][C]-1.28262587321766[/C][/ROW]
[ROW][C]33[/C][C]707[/C][C]732.3562290667[/C][C]-25.3562290666994[/C][/ROW]
[ROW][C]34[/C][C]715[/C][C]701.536890456466[/C][C]13.4631095435344[/C][/ROW]
[ROW][C]35[/C][C]657[/C][C]690.099911140275[/C][C]-33.0999111402754[/C][/ROW]
[ROW][C]36[/C][C]653[/C][C]636.879990157077[/C][C]16.1200098429234[/C][/ROW]
[ROW][C]37[/C][C]642[/C][C]669.35323791166[/C][C]-27.3532379116596[/C][/ROW]
[ROW][C]38[/C][C]643[/C][C]645.225725573829[/C][C]-2.22572557382880[/C][/ROW]
[ROW][C]39[/C][C]718[/C][C]735.224787761965[/C][C]-17.2247877619653[/C][/ROW]
[ROW][C]40[/C][C]654[/C][C]620.445064184063[/C][C]33.5549358159373[/C][/ROW]
[ROW][C]41[/C][C]632[/C][C]691.317374126782[/C][C]-59.3173741267823[/C][/ROW]
[ROW][C]42[/C][C]731[/C][C]728.40299115504[/C][C]2.59700884496034[/C][/ROW]
[ROW][C]43[/C][C]392[/C][C]414.489950648676[/C][C]-22.489950648676[/C][/ROW]
[ROW][C]44[/C][C]344[/C][C]384.754935815937[/C][C]-40.7549358159374[/C][/ROW]
[ROW][C]45[/C][C]792[/C][C]792.507413635183[/C][C]-0.507413635182951[/C][/ROW]
[ROW][C]46[/C][C]852[/C][C]807.761322779532[/C][C]44.2386772204678[/C][/ROW]
[ROW][C]47[/C][C]649[/C][C]647.866100698574[/C][C]1.13389930142586[/C][/ROW]
[ROW][C]48[/C][C]629[/C][C]617.682803592667[/C][C]11.317196407333[/C][/ROW]
[ROW][C]49[/C][C]685[/C][C]674.472487662169[/C][C]10.5275123378311[/C][/ROW]
[ROW][C]50[/C][C]617[/C][C]631.147788759928[/C][C]-14.1477887599284[/C][/ROW]
[ROW][C]51[/C][C]715[/C][C]653.316791753817[/C][C]61.6832082461825[/C][/ROW]
[ROW][C]52[/C][C]715[/C][C]706.192497505092[/C][C]8.80750249490763[/C][/ROW]
[ROW][C]53[/C][C]629[/C][C]637.565251746435[/C][C]-8.56525174643535[/C][/ROW]
[ROW][C]54[/C][C]916[/C][C]816.710049351324[/C][C]99.289950648676[/C][/ROW]
[ROW][C]55[/C][C]531[/C][C]472.081510341905[/C][C]58.9184896580951[/C][/ROW]
[ROW][C]56[/C][C]357[/C][C]361.718311938646[/C][C]-4.71831193864575[/C][/ROW]
[ROW][C]57[/C][C]917[/C][C]841.140286265021[/C][C]75.8597137349793[/C][/ROW]
[ROW][C]58[/C][C]828[/C][C]826.958509343942[/C][C]1.04149065605816[/C][/ROW]
[ROW][C]59[/C][C]708[/C][C]679.861411639257[/C][C]28.1385883607431[/C][/ROW]
[ROW][C]60[/C][C]858[/C][C]787.897857797099[/C][C]70.1021422029009[/C][/ROW]
[/TABLE]
Source: https://freestatistics.org/blog/index.php?pk=57554&T=4

Globally Unique Identifier (entire table): ba.freestatistics.org/blog/index.php?pk=57554&T=4

As an alternative you can also use a QR Code:  

The GUIDs for individual cells are displayed in the table below:

Multiple Linear Regression - Actuals, Interpolation, and Residuals
Time or IndexActualsInterpolationForecastResidualsPrediction Error
1627669.35323791166-42.3532379116603
2696707.936535017567-11.9365350175667
3825805.61447183146719.3855281685327
4677698.513622879329-21.5136228793285
5656670.840375124745-14.8403751247454
6785844.865922979125-59.8659229791249
7412420.889012836812-8.88901283681249
8352325.88356368508126.1164363149188
9839880.814471831467-41.8144718314673
10729789.84394865275-60.8439486527499
11696660.66422507484735.3357749251528
12641698.310987163187-57.3109871631874
13695696.229299101833-1.22929910183311
14638637.5468509480650.453149051935056
15762785.13747282943-23.1374728294304
16635638.362438310845-3.36243831084497
17721702.83568606542818.1643139345719
18854861.50348466828-7.50348466827982
19418415.7697630863032.23023691369671
20367346.36056268711820.6394373128819
21824832.18159920163-8.18159920162955
22687684.899328767312.10067123268946
23601632.508351447046-31.5083514470464
24676716.22836128997-40.2283612899698
25740679.59173741267860.4082625873219
26691663.14309970061127.8569002993889
27683723.706475823319-40.7064758233195
28594611.486377120671-17.4863771206715
29729664.44131293660964.5586870633912
30731765.517551846232-34.5175518462316
31386415.769763086303-29.7697630863033
32331332.282625873218-1.28262587321766
33707732.3562290667-25.3562290666994
34715701.53689045646613.4631095435344
35657690.099911140275-33.0999111402754
36653636.87999015707716.1200098429234
37642669.35323791166-27.3532379116596
38643645.225725573829-2.22572557382880
39718735.224787761965-17.2247877619653
40654620.44506418406333.5549358159373
41632691.317374126782-59.3173741267823
42731728.402991155042.59700884496034
43392414.489950648676-22.489950648676
44344384.754935815937-40.7549358159374
45792792.507413635183-0.507413635182951
46852807.76132277953244.2386772204678
47649647.8661006985741.13389930142586
48629617.68280359266711.317196407333
49685674.47248766216910.5275123378311
50617631.147788759928-14.1477887599284
51715653.31679175381761.6832082461825
52715706.1924975050928.80750249490763
53629637.565251746435-8.56525174643535
54916816.71004935132499.289950648676
55531472.08151034190558.9184896580951
56357361.718311938646-4.71831193864575
57917841.14028626502175.8597137349793
58828826.9585093439421.04149065605816
59708679.86141163925728.1385883607431
60858787.89785779709970.1021422029009


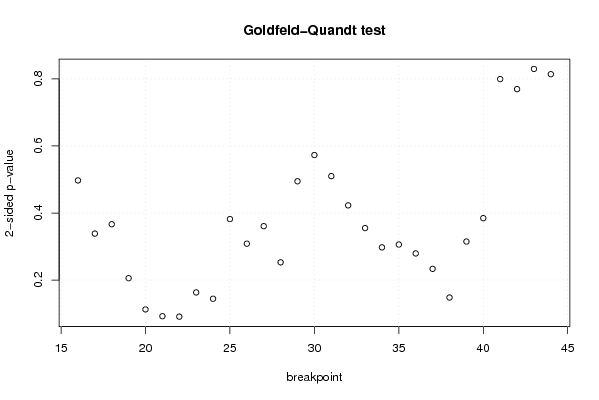
Goldfeld-Quandt test for Heteroskedasticity
p-valuesAlternative Hypothesis
breakpoint indexgreater2-sidedless
160.2485987803770430.4971975607540860.751401219622957
170.1692770309683890.3385540619367780.830722969031611
180.1832546533326180.3665093066652370.816745346667382
190.1027723223971210.2055446447942410.89722767760288
200.05623777390648410.1124755478129680.943762226093516
210.04607618889342730.09215237778685460.953923811106573
220.04540916917021650.09081833834043310.954590830829783
230.08155683545306740.1631136709061350.918443164546933
240.07212304717859230.1442460943571850.927876952821408
250.1910004625538350.3820009251076700.808999537446165
260.1542320359614200.3084640719228390.84576796403858
270.1803716613265910.3607433226531830.819628338673409
280.1264459343735140.2528918687470280.873554065626486
290.2473647143536210.4947294287072420.752635285646379
300.2864593761564970.5729187523129940.713540623843503
310.2550112624856480.5100225249712950.744988737514352
320.2114269673686640.4228539347373280.788573032631336
330.1775507836369130.3551015672738260.822449216363087
340.1487678836984650.2975357673969300.851232116301535
350.1529902988591820.3059805977183650.847009701140818
360.1396974011760440.2793948023520880.860302598823956
370.1167478270311680.2334956540623360.883252172968832
380.07391860029236790.1478372005847360.926081399707632
390.1574462130255200.3148924260510400.84255378697448
400.1923220162298640.3846440324597280.807677983770136
410.3997959350841980.7995918701683950.600204064915802
420.3847752647155020.7695505294310050.615224735284498
430.4148995170794120.8297990341588240.585100482920588
440.407085250719820.814170501439640.59291474928018

\begin{tabular}{lllllllll}
\hline
Goldfeld-Quandt test for Heteroskedasticity \tabularnewline
p-values & Alternative Hypothesis \tabularnewline
breakpoint index & greater & 2-sided & less \tabularnewline
16 & 0.248598780377043 & 0.497197560754086 & 0.751401219622957 \tabularnewline
17 & 0.169277030968389 & 0.338554061936778 & 0.830722969031611 \tabularnewline
18 & 0.183254653332618 & 0.366509306665237 & 0.816745346667382 \tabularnewline
19 & 0.102772322397121 & 0.205544644794241 & 0.89722767760288 \tabularnewline
20 & 0.0562377739064841 & 0.112475547812968 & 0.943762226093516 \tabularnewline
21 & 0.0460761888934273 & 0.0921523777868546 & 0.953923811106573 \tabularnewline
22 & 0.0454091691702165 & 0.0908183383404331 & 0.954590830829783 \tabularnewline
23 & 0.0815568354530674 & 0.163113670906135 & 0.918443164546933 \tabularnewline
24 & 0.0721230471785923 & 0.144246094357185 & 0.927876952821408 \tabularnewline
25 & 0.191000462553835 & 0.382000925107670 & 0.808999537446165 \tabularnewline
26 & 0.154232035961420 & 0.308464071922839 & 0.84576796403858 \tabularnewline
27 & 0.180371661326591 & 0.360743322653183 & 0.819628338673409 \tabularnewline
28 & 0.126445934373514 & 0.252891868747028 & 0.873554065626486 \tabularnewline
29 & 0.247364714353621 & 0.494729428707242 & 0.752635285646379 \tabularnewline
30 & 0.286459376156497 & 0.572918752312994 & 0.713540623843503 \tabularnewline
31 & 0.255011262485648 & 0.510022524971295 & 0.744988737514352 \tabularnewline
32 & 0.211426967368664 & 0.422853934737328 & 0.788573032631336 \tabularnewline
33 & 0.177550783636913 & 0.355101567273826 & 0.822449216363087 \tabularnewline
34 & 0.148767883698465 & 0.297535767396930 & 0.851232116301535 \tabularnewline
35 & 0.152990298859182 & 0.305980597718365 & 0.847009701140818 \tabularnewline
36 & 0.139697401176044 & 0.279394802352088 & 0.860302598823956 \tabularnewline
37 & 0.116747827031168 & 0.233495654062336 & 0.883252172968832 \tabularnewline
38 & 0.0739186002923679 & 0.147837200584736 & 0.926081399707632 \tabularnewline
39 & 0.157446213025520 & 0.314892426051040 & 0.84255378697448 \tabularnewline
40 & 0.192322016229864 & 0.384644032459728 & 0.807677983770136 \tabularnewline
41 & 0.399795935084198 & 0.799591870168395 & 0.600204064915802 \tabularnewline
42 & 0.384775264715502 & 0.769550529431005 & 0.615224735284498 \tabularnewline
43 & 0.414899517079412 & 0.829799034158824 & 0.585100482920588 \tabularnewline
44 & 0.40708525071982 & 0.81417050143964 & 0.59291474928018 \tabularnewline
\hline
\end{tabular}
%Source: https://freestatistics.org/blog/index.php?pk=57554&T=5

[TABLE]
[ROW][C]Goldfeld-Quandt test for Heteroskedasticity[/C][/ROW]
[ROW][C]p-values[/C][C]Alternative Hypothesis[/C][/ROW]
[ROW][C]breakpoint index[/C][C]greater[/C][C]2-sided[/C][C]less[/C][/ROW]
[ROW][C]16[/C][C]0.248598780377043[/C][C]0.497197560754086[/C][C]0.751401219622957[/C][/ROW]
[ROW][C]17[/C][C]0.169277030968389[/C][C]0.338554061936778[/C][C]0.830722969031611[/C][/ROW]
[ROW][C]18[/C][C]0.183254653332618[/C][C]0.366509306665237[/C][C]0.816745346667382[/C][/ROW]
[ROW][C]19[/C][C]0.102772322397121[/C][C]0.205544644794241[/C][C]0.89722767760288[/C][/ROW]
[ROW][C]20[/C][C]0.0562377739064841[/C][C]0.112475547812968[/C][C]0.943762226093516[/C][/ROW]
[ROW][C]21[/C][C]0.0460761888934273[/C][C]0.0921523777868546[/C][C]0.953923811106573[/C][/ROW]
[ROW][C]22[/C][C]0.0454091691702165[/C][C]0.0908183383404331[/C][C]0.954590830829783[/C][/ROW]
[ROW][C]23[/C][C]0.0815568354530674[/C][C]0.163113670906135[/C][C]0.918443164546933[/C][/ROW]
[ROW][C]24[/C][C]0.0721230471785923[/C][C]0.144246094357185[/C][C]0.927876952821408[/C][/ROW]
[ROW][C]25[/C][C]0.191000462553835[/C][C]0.382000925107670[/C][C]0.808999537446165[/C][/ROW]
[ROW][C]26[/C][C]0.154232035961420[/C][C]0.308464071922839[/C][C]0.84576796403858[/C][/ROW]
[ROW][C]27[/C][C]0.180371661326591[/C][C]0.360743322653183[/C][C]0.819628338673409[/C][/ROW]
[ROW][C]28[/C][C]0.126445934373514[/C][C]0.252891868747028[/C][C]0.873554065626486[/C][/ROW]
[ROW][C]29[/C][C]0.247364714353621[/C][C]0.494729428707242[/C][C]0.752635285646379[/C][/ROW]
[ROW][C]30[/C][C]0.286459376156497[/C][C]0.572918752312994[/C][C]0.713540623843503[/C][/ROW]
[ROW][C]31[/C][C]0.255011262485648[/C][C]0.510022524971295[/C][C]0.744988737514352[/C][/ROW]
[ROW][C]32[/C][C]0.211426967368664[/C][C]0.422853934737328[/C][C]0.788573032631336[/C][/ROW]
[ROW][C]33[/C][C]0.177550783636913[/C][C]0.355101567273826[/C][C]0.822449216363087[/C][/ROW]
[ROW][C]34[/C][C]0.148767883698465[/C][C]0.297535767396930[/C][C]0.851232116301535[/C][/ROW]
[ROW][C]35[/C][C]0.152990298859182[/C][C]0.305980597718365[/C][C]0.847009701140818[/C][/ROW]
[ROW][C]36[/C][C]0.139697401176044[/C][C]0.279394802352088[/C][C]0.860302598823956[/C][/ROW]
[ROW][C]37[/C][C]0.116747827031168[/C][C]0.233495654062336[/C][C]0.883252172968832[/C][/ROW]
[ROW][C]38[/C][C]0.0739186002923679[/C][C]0.147837200584736[/C][C]0.926081399707632[/C][/ROW]
[ROW][C]39[/C][C]0.157446213025520[/C][C]0.314892426051040[/C][C]0.84255378697448[/C][/ROW]
[ROW][C]40[/C][C]0.192322016229864[/C][C]0.384644032459728[/C][C]0.807677983770136[/C][/ROW]
[ROW][C]41[/C][C]0.399795935084198[/C][C]0.799591870168395[/C][C]0.600204064915802[/C][/ROW]
[ROW][C]42[/C][C]0.384775264715502[/C][C]0.769550529431005[/C][C]0.615224735284498[/C][/ROW]
[ROW][C]43[/C][C]0.414899517079412[/C][C]0.829799034158824[/C][C]0.585100482920588[/C][/ROW]
[ROW][C]44[/C][C]0.40708525071982[/C][C]0.81417050143964[/C][C]0.59291474928018[/C][/ROW]
[/TABLE]
Source: https://freestatistics.org/blog/index.php?pk=57554&T=5

Globally Unique Identifier (entire table): ba.freestatistics.org/blog/index.php?pk=57554&T=5

As an alternative you can also use a QR Code:  

The GUIDs for individual cells are displayed in the table below:

Goldfeld-Quandt test for Heteroskedasticity
p-valuesAlternative Hypothesis
breakpoint indexgreater2-sidedless
160.2485987803770430.4971975607540860.751401219622957
170.1692770309683890.3385540619367780.830722969031611
180.1832546533326180.3665093066652370.816745346667382
190.1027723223971210.2055446447942410.89722767760288
200.05623777390648410.1124755478129680.943762226093516
210.04607618889342730.09215237778685460.953923811106573
220.04540916917021650.09081833834043310.954590830829783
230.08155683545306740.1631136709061350.918443164546933
240.07212304717859230.1442460943571850.927876952821408
250.1910004625538350.3820009251076700.808999537446165
260.1542320359614200.3084640719228390.84576796403858
270.1803716613265910.3607433226531830.819628338673409
280.1264459343735140.2528918687470280.873554065626486
290.2473647143536210.4947294287072420.752635285646379
300.2864593761564970.5729187523129940.713540623843503
310.2550112624856480.5100225249712950.744988737514352
320.2114269673686640.4228539347373280.788573032631336
330.1775507836369130.3551015672738260.822449216363087
340.1487678836984650.2975357673969300.851232116301535
350.1529902988591820.3059805977183650.847009701140818
360.1396974011760440.2793948023520880.860302598823956
370.1167478270311680.2334956540623360.883252172968832
380.07391860029236790.1478372005847360.926081399707632
390.1574462130255200.3148924260510400.84255378697448
400.1923220162298640.3846440324597280.807677983770136
410.3997959350841980.7995918701683950.600204064915802
420.3847752647155020.7695505294310050.615224735284498
430.4148995170794120.8297990341588240.585100482920588
440.407085250719820.814170501439640.59291474928018


Meta Analysis of Goldfeld-Quandt test for Heteroskedasticity
Description# significant tests% significant testsOK/NOK
1% type I error level00OK
5% type I error level00OK
10% type I error level20.0689655172413793OK

\begin{tabular}{lllllllll}
\hline
Meta Analysis of Goldfeld-Quandt test for Heteroskedasticity \tabularnewline
Description & # significant tests & % significant tests & OK/NOK \tabularnewline
1% type I error level & 0 & 0 & OK \tabularnewline
5% type I error level & 0 & 0 & OK \tabularnewline
10% type I error level & 2 & 0.0689655172413793 & OK \tabularnewline
\hline
\end{tabular}
%Source: https://freestatistics.org/blog/index.php?pk=57554&T=6

[TABLE]
[ROW][C]Meta Analysis of Goldfeld-Quandt test for Heteroskedasticity[/C][/ROW]
[ROW][C]Description[/C][C]# significant tests[/C][C]% significant tests[/C][C]OK/NOK[/C][/ROW]
[ROW][C]1% type I error level[/C][C]0[/C][C]0[/C][C]OK[/C][/ROW]
[ROW][C]5% type I error level[/C][C]0[/C][C]0[/C][C]OK[/C][/ROW]
[ROW][C]10% type I error level[/C][C]2[/C][C]0.0689655172413793[/C][C]OK[/C][/ROW]
[/TABLE]
Source: https://freestatistics.org/blog/index.php?pk=57554&T=6

Globally Unique Identifier (entire table): ba.freestatistics.org/blog/index.php?pk=57554&T=6

As an alternative you can also use a QR Code:  

The GUIDs for individual cells are displayed in the table below:

Meta Analysis of Goldfeld-Quandt test for Heteroskedasticity
Description# significant tests% significant testsOK/NOK
1% type I error level00OK
5% type I error level00OK
10% type I error level20.0689655172413793OK


Parameters (Session):
par1 = 1 ; par2 = Include Monthly Dummies ; par3 = No Linear Trend ;
Parameters (R input):
par1 = 1 ; par2 = Include Monthly Dummies ; par3 = No Linear Trend ;
R code (references can be found in the software module):
library(lattice)
library(lmtest)
n25 <- 25 #minimum number of obs. for Goldfeld-Quandt test
par1 <- as.numeric(par1)
x <- t(y)
k <- length(x[1,])
n <- length(x[,1])
x1 <- cbind(x[,par1], x[,1:k!=par1])
mycolnames <- c(colnames(x)[par1], colnames(x)[1:k!=par1])
colnames(x1) <- mycolnames #colnames(x)[par1]
x <- x1
if (par3 == 'First Differences'){
x2 <- array(0, dim=c(n-1,k), dimnames=list(1:(n-1), paste('(1-B)',colnames(x),sep='')))
for (i in 1:n-1) {
for (j in 1:k) {
x2[i,j] <- x[i+1,j] - x[i,j]
}
}
x <- x2
}
if (par2 == 'Include Monthly Dummies'){
x2 <- array(0, dim=c(n,11), dimnames=list(1:n, paste('M', seq(1:11), sep ='')))
for (i in 1:11){
x2[seq(i,n,12),i] <- 1
}
x <- cbind(x, x2)
}
if (par2 == 'Include Quarterly Dummies'){
x2 <- array(0, dim=c(n,3), dimnames=list(1:n, paste('Q', seq(1:3), sep ='')))
for (i in 1:3){
x2[seq(i,n,4),i] <- 1
}
x <- cbind(x, x2)
}
k <- length(x[1,])
if (par3 == 'Linear Trend'){
x <- cbind(x, c(1:n))
colnames(x)[k+1] <- 't'
}
x
k <- length(x[1,])
df <- as.data.frame(x)
(mylm <- lm(df))
(mysum <- summary(mylm))
if (n > n25) {
kp3 <- k + 3
nmkm3 <- n - k - 3
gqarr <- array(NA, dim=c(nmkm3-kp3+1,3))
numgqtests <- 0
numsignificant1 <- 0
numsignificant5 <- 0
numsignificant10 <- 0
for (mypoint in kp3:nmkm3) {
j <- 0
numgqtests <- numgqtests + 1
for (myalt in c('greater', 'two.sided', 'less')) {
j <- j + 1
gqarr[mypoint-kp3+1,j] <- gqtest(mylm, point=mypoint, alternative=myalt)$p.value
}
if (gqarr[mypoint-kp3+1,2] < 0.01) numsignificant1 <- numsignificant1 + 1
if (gqarr[mypoint-kp3+1,2] < 0.05) numsignificant5 <- numsignificant5 + 1
if (gqarr[mypoint-kp3+1,2] < 0.10) numsignificant10 <- numsignificant10 + 1
}
gqarr
}
bitmap(file='test0.png')
plot(x[,1], type='l', main='Actuals and Interpolation', ylab='value of Actuals and Interpolation (dots)', xlab='time or index')
points(x[,1]-mysum$resid)
grid()
dev.off()
bitmap(file='test1.png')
plot(mysum$resid, type='b', pch=19, main='Residuals', ylab='value of Residuals', xlab='time or index')
grid()
dev.off()
bitmap(file='test2.png')
hist(mysum$resid, main='Residual Histogram', xlab='values of Residuals')
grid()
dev.off()
bitmap(file='test3.png')
densityplot(~mysum$resid,col='black',main='Residual Density Plot', xlab='values of Residuals')
dev.off()
bitmap(file='test4.png')
qqnorm(mysum$resid, main='Residual Normal Q-Q Plot')
qqline(mysum$resid)
grid()
dev.off()
(myerror <- as.ts(mysum$resid))
bitmap(file='test5.png')
dum <- cbind(lag(myerror,k=1),myerror)
dum
dum1 <- dum[2:length(myerror),]
dum1
z <- as.data.frame(dum1)
z
plot(z,main=paste('Residual Lag plot, lowess, and regression line'), ylab='values of Residuals', xlab='lagged values of Residuals')
lines(lowess(z))
abline(lm(z))
grid()
dev.off()
bitmap(file='test6.png')
acf(mysum$resid, lag.max=length(mysum$resid)/2, main='Residual Autocorrelation Function')
grid()
dev.off()
bitmap(file='test7.png')
pacf(mysum$resid, lag.max=length(mysum$resid)/2, main='Residual Partial Autocorrelation Function')
grid()
dev.off()
bitmap(file='test8.png')
opar <- par(mfrow = c(2,2), oma = c(0, 0, 1.1, 0))
plot(mylm, las = 1, sub='Residual Diagnostics')
par(opar)
dev.off()
if (n > n25) {
bitmap(file='test9.png')
plot(kp3:nmkm3,gqarr[,2], main='Goldfeld-Quandt test',ylab='2-sided p-value',xlab='breakpoint')
grid()
dev.off()
}
load(file='createtable')
a<-table.start()
a<-table.row.start(a)
a<-table.element(a, 'Multiple Linear Regression - Estimated Regression Equation', 1, TRUE)
a<-table.row.end(a)
myeq <- colnames(x)[1]
myeq <- paste(myeq, '[t] = ', sep='')
for (i in 1:k){
if (mysum$coefficients[i,1] > 0) myeq <- paste(myeq, '+', '')
myeq <- paste(myeq, mysum$coefficients[i,1], sep=' ')
if (rownames(mysum$coefficients)[i] != '(Intercept)') {
myeq <- paste(myeq, rownames(mysum$coefficients)[i], sep='')
if (rownames(mysum$coefficients)[i] != 't') myeq <- paste(myeq, '[t]', sep='')
}
}
myeq <- paste(myeq, ' + e[t]')
a<-table.row.start(a)
a<-table.element(a, myeq)
a<-table.row.end(a)
a<-table.end(a)
table.save(a,file='mytable1.tab')
a<-table.start()
a<-table.row.start(a)
a<-table.element(a,hyperlink('ols1.htm','Multiple Linear Regression - Ordinary Least Squares',''), 6, TRUE)
a<-table.row.end(a)
a<-table.row.start(a)
a<-table.element(a,'Variable',header=TRUE)
a<-table.element(a,'Parameter',header=TRUE)
a<-table.element(a,'S.D.',header=TRUE)
a<-table.element(a,'T-STAT
H0: parameter = 0',header=TRUE)
a<-table.element(a,'2-tail p-value',header=TRUE)
a<-table.element(a,'1-tail p-value',header=TRUE)
a<-table.row.end(a)
for (i in 1:k){
a<-table.row.start(a)
a<-table.element(a,rownames(mysum$coefficients)[i],header=TRUE)
a<-table.element(a,mysum$coefficients[i,1])
a<-table.element(a, round(mysum$coefficients[i,2],6))
a<-table.element(a, round(mysum$coefficients[i,3],4))
a<-table.element(a, round(mysum$coefficients[i,4],6))
a<-table.element(a, round(mysum$coefficients[i,4]/2,6))
a<-table.row.end(a)
}
a<-table.end(a)
table.save(a,file='mytable2.tab')
a<-table.start()
a<-table.row.start(a)
a<-table.element(a, 'Multiple Linear Regression - Regression Statistics', 2, TRUE)
a<-table.row.end(a)
a<-table.row.start(a)
a<-table.element(a, 'Multiple R',1,TRUE)
a<-table.element(a, sqrt(mysum$r.squared))
a<-table.row.end(a)
a<-table.row.start(a)
a<-table.element(a, 'R-squared',1,TRUE)
a<-table.element(a, mysum$r.squared)
a<-table.row.end(a)
a<-table.row.start(a)
a<-table.element(a, 'Adjusted R-squared',1,TRUE)
a<-table.element(a, mysum$adj.r.squared)
a<-table.row.end(a)
a<-table.row.start(a)
a<-table.element(a, 'F-TEST (value)',1,TRUE)
a<-table.element(a, mysum$fstatistic[1])
a<-table.row.end(a)
a<-table.row.start(a)
a<-table.element(a, 'F-TEST (DF numerator)',1,TRUE)
a<-table.element(a, mysum$fstatistic[2])
a<-table.row.end(a)
a<-table.row.start(a)
a<-table.element(a, 'F-TEST (DF denominator)',1,TRUE)
a<-table.element(a, mysum$fstatistic[3])
a<-table.row.end(a)
a<-table.row.start(a)
a<-table.element(a, 'p-value',1,TRUE)
a<-table.element(a, 1-pf(mysum$fstatistic[1],mysum$fstatistic[2],mysum$fstatistic[3]))
a<-table.row.end(a)
a<-table.row.start(a)
a<-table.element(a, 'Multiple Linear Regression - Residual Statistics', 2, TRUE)
a<-table.row.end(a)
a<-table.row.start(a)
a<-table.element(a, 'Residual Standard Deviation',1,TRUE)
a<-table.element(a, mysum$sigma)
a<-table.row.end(a)
a<-table.row.start(a)
a<-table.element(a, 'Sum Squared Residuals',1,TRUE)
a<-table.element(a, sum(myerror*myerror))
a<-table.row.end(a)
a<-table.end(a)
table.save(a,file='mytable3.tab')
a<-table.start()
a<-table.row.start(a)
a<-table.element(a, 'Multiple Linear Regression - Actuals, Interpolation, and Residuals', 4, TRUE)
a<-table.row.end(a)
a<-table.row.start(a)
a<-table.element(a, 'Time or Index', 1, TRUE)
a<-table.element(a, 'Actuals', 1, TRUE)
a<-table.element(a, 'Interpolation
Forecast', 1, TRUE)
a<-table.element(a, 'Residuals
Prediction Error', 1, TRUE)
a<-table.row.end(a)
for (i in 1:n) {
a<-table.row.start(a)
a<-table.element(a,i, 1, TRUE)
a<-table.element(a,x[i])
a<-table.element(a,x[i]-mysum$resid[i])
a<-table.element(a,mysum$resid[i])
a<-table.row.end(a)
}
a<-table.end(a)
table.save(a,file='mytable4.tab')
if (n > n25) {
a<-table.start()
a<-table.row.start(a)
a<-table.element(a,'Goldfeld-Quandt test for Heteroskedasticity',4,TRUE)
a<-table.row.end(a)
a<-table.row.start(a)
a<-table.element(a,'p-values',header=TRUE)
a<-table.element(a,'Alternative Hypothesis',3,header=TRUE)
a<-table.row.end(a)
a<-table.row.start(a)
a<-table.element(a,'breakpoint index',header=TRUE)
a<-table.element(a,'greater',header=TRUE)
a<-table.element(a,'2-sided',header=TRUE)
a<-table.element(a,'less',header=TRUE)
a<-table.row.end(a)
for (mypoint in kp3:nmkm3) {
a<-table.row.start(a)
a<-table.element(a,mypoint,header=TRUE)
a<-table.element(a,gqarr[mypoint-kp3+1,1])
a<-table.element(a,gqarr[mypoint-kp3+1,2])
a<-table.element(a,gqarr[mypoint-kp3+1,3])
a<-table.row.end(a)
}
a<-table.end(a)
table.save(a,file='mytable5.tab')
a<-table.start()
a<-table.row.start(a)
a<-table.element(a,'Meta Analysis of Goldfeld-Quandt test for Heteroskedasticity',4,TRUE)
a<-table.row.end(a)
a<-table.row.start(a)
a<-table.element(a,'Description',header=TRUE)
a<-table.element(a,'# significant tests',header=TRUE)
a<-table.element(a,'% significant tests',header=TRUE)
a<-table.element(a,'OK/NOK',header=TRUE)
a<-table.row.end(a)
a<-table.row.start(a)
a<-table.element(a,'1% type I error level',header=TRUE)
a<-table.element(a,numsignificant1)
a<-table.element(a,numsignificant1/numgqtests)
if (numsignificant1/numgqtests < 0.01) dum <- 'OK' else dum <- 'NOK'
a<-table.element(a,dum)
a<-table.row.end(a)
a<-table.row.start(a)
a<-table.element(a,'5% type I error level',header=TRUE)
a<-table.element(a,numsignificant5)
a<-table.element(a,numsignificant5/numgqtests)
if (numsignificant5/numgqtests < 0.05) dum <- 'OK' else dum <- 'NOK'
a<-table.element(a,dum)
a<-table.row.end(a)
a<-table.row.start(a)
a<-table.element(a,'10% type I error level',header=TRUE)
a<-table.element(a,numsignificant10)
a<-table.element(a,numsignificant10/numgqtests)
if (numsignificant10/numgqtests < 0.1) dum <- 'OK' else dum <- 'NOK'
a<-table.element(a,dum)
a<-table.row.end(a)
a<-table.end(a)
table.save(a,file='mytable6.tab')
}