Free Statistics

of Irreproducible Research!

Author's title

Author*The author of this computation has been verified*
R Software Modulerwasp_multipleregression.wasp
Title produced by softwareMultiple Regression
Date of computationWed, 18 Nov 2009 09:30:48 -0700
Cite this page as followsStatistical Computations at FreeStatistics.org, Office for Research Development and Education, URL https://freestatistics.org/blog/index.php?v=date/2009/Nov/18/t12585619972eggcnleguxsbkn.htm/, Retrieved Fri, 03 May 2024 08:54:20 +0000
Statistical Computations at FreeStatistics.org, Office for Research Development and Education, URL https://freestatistics.org/blog/index.php?pk=57520, Retrieved Fri, 03 May 2024 08:54:20 +0000
QR Codes:

Original text written by user:
IsPrivate?No (this computation is public)
User-defined keywords
Estimated Impact167
Family? (F = Feedback message, R = changed R code, M = changed R Module, P = changed Parameters, D = changed Data)
-     [Multiple Regression] [Q1 The Seatbeltlaw] [2007-11-14 19:27:43] [8cd6641b921d30ebe00b648d1481bba0]
- RMPD  [Multiple Regression] [Seatbelt] [2009-11-12 13:54:52] [b98453cac15ba1066b407e146608df68]
-    D      [Multiple Regression] [] [2009-11-18 16:30:48] [d41d8cd98f00b204e9800998ecf8427e] [Current]
-   P         [Multiple Regression] [] [2009-11-19 07:41:31] [74be16979710d4c4e7c6647856088456]
-   P           [Multiple Regression] [] [2009-11-19 07:51:21] [74be16979710d4c4e7c6647856088456]
-   PD          [Multiple Regression] [] [2009-11-19 08:34:59] [d2bea3ec23e91643318a5bccf3e3b9df]
Feedback Forum

Post a new message
Dataseries X:
2.085	0
2.053	0
2.077	0
2.058	0
2.057	0
2.076	0
2.07	0
2.062	0
2.073	0
2.061	0
2.094	0
2.067	0
2.086	0
2.276	0
2.326	0
2.349	0
2.52	0
2.628	0
2.577	0
2.698	0
2.814	0
2.968	0
3.041	0
3.278	0
3.328	0
3.5	0
3.563	0
3.569	0
3.69	0
3.819	0
3.79	0
3.956	0
4.063	0
4.047	0
4.029	0
3.941	0
4.022	0
3.879	0
4.022	0
4.028	0
4.091	0
3.987	0
4.01	0
4.007	0
4.191	0
4.299	0
4.273	0
3.82	0
3.15	1
2.486	1
1.812	1
1.257	1
1.062	1
0.842	1
0.782	1
0.698	1
0.358	1
0.347	1
0.363	1
0.359	1
0.355	1


Summary of computational transaction
Raw Inputview raw input (R code)
Raw Outputview raw output of R engine
Computing time3 seconds
R Server'Gwilym Jenkins' @ 72.249.127.135

\begin{tabular}{lllllllll}
\hline
Summary of computational transaction \tabularnewline
Raw Input & view raw input (R code)  \tabularnewline
Raw Output & view raw output of R engine  \tabularnewline
Computing time & 3 seconds \tabularnewline
R Server & 'Gwilym Jenkins' @ 72.249.127.135 \tabularnewline
\hline
\end{tabular}
%Source: https://freestatistics.org/blog/index.php?pk=57520&T=0

[TABLE]
[ROW][C]Summary of computational transaction[/C][/ROW]
[ROW][C]Raw Input[/C][C]view raw input (R code) [/C][/ROW]
[ROW][C]Raw Output[/C][C]view raw output of R engine [/C][/ROW]
[ROW][C]Computing time[/C][C]3 seconds[/C][/ROW]
[ROW][C]R Server[/C][C]'Gwilym Jenkins' @ 72.249.127.135[/C][/ROW]
[/TABLE]
Source: https://freestatistics.org/blog/index.php?pk=57520&T=0

Globally Unique Identifier (entire table): ba.freestatistics.org/blog/index.php?pk=57520&T=0

As an alternative you can also use a QR Code:  

The GUIDs for individual cells are displayed in the table below:

Summary of computational transaction
Raw Inputview raw input (R code)
Raw Outputview raw output of R engine
Computing time3 seconds
R Server'Gwilym Jenkins' @ 72.249.127.135


Multiple Linear Regression - Estimated Regression Equation
intb[t] = + 3.131625 -2.064625x[t] + e[t]

\begin{tabular}{lllllllll}
\hline
Multiple Linear Regression - Estimated Regression Equation \tabularnewline
intb[t] =  +  3.131625 -2.064625x[t]  + e[t] \tabularnewline
\hline
\end{tabular}
%Source: https://freestatistics.org/blog/index.php?pk=57520&T=1

[TABLE]
[ROW][C]Multiple Linear Regression - Estimated Regression Equation[/C][/ROW]
[ROW][C]intb[t] =  +  3.131625 -2.064625x[t]  + e[t][/C][/ROW]
[/TABLE]
Source: https://freestatistics.org/blog/index.php?pk=57520&T=1

Globally Unique Identifier (entire table): ba.freestatistics.org/blog/index.php?pk=57520&T=1

As an alternative you can also use a QR Code:  

The GUIDs for individual cells are displayed in the table below:

Multiple Linear Regression - Estimated Regression Equation
intb[t] = + 3.131625 -2.064625x[t] + e[t]


Multiple Linear Regression - Ordinary Least Squares
VariableParameterS.D.T-STATH0: parameter = 02-tail p-value1-tail p-value
(Intercept)3.1316250.12416325.22200
x-2.0646250.268958-7.676400

\begin{tabular}{lllllllll}
\hline
Multiple Linear Regression - Ordinary Least Squares \tabularnewline
Variable & Parameter & S.D. & T-STATH0: parameter = 0 & 2-tail p-value & 1-tail p-value \tabularnewline
(Intercept) & 3.131625 & 0.124163 & 25.222 & 0 & 0 \tabularnewline
x & -2.064625 & 0.268958 & -7.6764 & 0 & 0 \tabularnewline
\hline
\end{tabular}
%Source: https://freestatistics.org/blog/index.php?pk=57520&T=2

[TABLE]
[ROW][C]Multiple Linear Regression - Ordinary Least Squares[/C][/ROW]
[ROW][C]Variable[/C][C]Parameter[/C][C]S.D.[/C][C]T-STATH0: parameter = 0[/C][C]2-tail p-value[/C][C]1-tail p-value[/C][/ROW]
[ROW][C](Intercept)[/C][C]3.131625[/C][C]0.124163[/C][C]25.222[/C][C]0[/C][C]0[/C][/ROW]
[ROW][C]x[/C][C]-2.064625[/C][C]0.268958[/C][C]-7.6764[/C][C]0[/C][C]0[/C][/ROW]
[/TABLE]
Source: https://freestatistics.org/blog/index.php?pk=57520&T=2

Globally Unique Identifier (entire table): ba.freestatistics.org/blog/index.php?pk=57520&T=2

As an alternative you can also use a QR Code:  

The GUIDs for individual cells are displayed in the table below:

Multiple Linear Regression - Ordinary Least Squares
VariableParameterS.D.T-STATH0: parameter = 02-tail p-value1-tail p-value
(Intercept)3.1316250.12416325.22200
x-2.0646250.268958-7.676400


Multiple Linear Regression - Regression Statistics
Multiple R0.706888117921025
R-squared0.499690811257929
Adjusted R-squared0.491210994499589
F-TEST (value)58.9270765510902
F-TEST (DF numerator)1
F-TEST (DF denominator)59
p-value1.93193239184097e-10
Multiple Linear Regression - Residual Statistics
Residual Standard Deviation0.860223120938173
Sum Squared Residuals43.65904525

\begin{tabular}{lllllllll}
\hline
Multiple Linear Regression - Regression Statistics \tabularnewline
Multiple R & 0.706888117921025 \tabularnewline
R-squared & 0.499690811257929 \tabularnewline
Adjusted R-squared & 0.491210994499589 \tabularnewline
F-TEST (value) & 58.9270765510902 \tabularnewline
F-TEST (DF numerator) & 1 \tabularnewline
F-TEST (DF denominator) & 59 \tabularnewline
p-value & 1.93193239184097e-10 \tabularnewline
Multiple Linear Regression - Residual Statistics \tabularnewline
Residual Standard Deviation & 0.860223120938173 \tabularnewline
Sum Squared Residuals & 43.65904525 \tabularnewline
\hline
\end{tabular}
%Source: https://freestatistics.org/blog/index.php?pk=57520&T=3

[TABLE]
[ROW][C]Multiple Linear Regression - Regression Statistics[/C][/ROW]
[ROW][C]Multiple R[/C][C]0.706888117921025[/C][/ROW]
[ROW][C]R-squared[/C][C]0.499690811257929[/C][/ROW]
[ROW][C]Adjusted R-squared[/C][C]0.491210994499589[/C][/ROW]
[ROW][C]F-TEST (value)[/C][C]58.9270765510902[/C][/ROW]
[ROW][C]F-TEST (DF numerator)[/C][C]1[/C][/ROW]
[ROW][C]F-TEST (DF denominator)[/C][C]59[/C][/ROW]
[ROW][C]p-value[/C][C]1.93193239184097e-10[/C][/ROW]
[ROW][C]Multiple Linear Regression - Residual Statistics[/C][/ROW]
[ROW][C]Residual Standard Deviation[/C][C]0.860223120938173[/C][/ROW]
[ROW][C]Sum Squared Residuals[/C][C]43.65904525[/C][/ROW]
[/TABLE]
Source: https://freestatistics.org/blog/index.php?pk=57520&T=3

Globally Unique Identifier (entire table): ba.freestatistics.org/blog/index.php?pk=57520&T=3

As an alternative you can also use a QR Code:  

The GUIDs for individual cells are displayed in the table below:

Multiple Linear Regression - Regression Statistics
Multiple R0.706888117921025
R-squared0.499690811257929
Adjusted R-squared0.491210994499589
F-TEST (value)58.9270765510902
F-TEST (DF numerator)1
F-TEST (DF denominator)59
p-value1.93193239184097e-10
Multiple Linear Regression - Residual Statistics
Residual Standard Deviation0.860223120938173
Sum Squared Residuals43.65904525


Multiple Linear Regression - Actuals, Interpolation, and Residuals
Time or IndexActualsInterpolationForecastResidualsPrediction Error
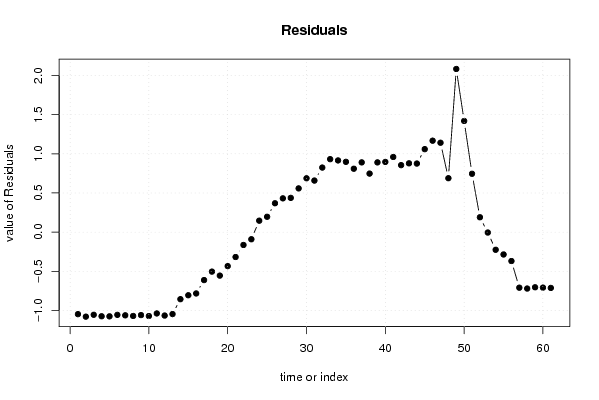
12.0853.13162500000000-1.04662500000000
22.0533.131625-1.078625
32.0773.131625-1.054625
42.0583.131625-1.073625
52.0573.131625-1.074625
62.0763.131625-1.055625
72.073.131625-1.061625
82.0623.131625-1.069625
92.0733.131625-1.058625
102.0613.131625-1.070625
112.0943.131625-1.037625
122.0673.131625-1.064625
132.0863.131625-1.045625
142.2763.131625-0.855625
152.3263.131625-0.805625
162.3493.131625-0.782625
172.523.131625-0.611625
182.6283.131625-0.503625
192.5773.131625-0.554625
202.6983.131625-0.433625
212.8143.131625-0.317625
222.9683.131625-0.163625
233.0413.131625-0.090625
243.2783.1316250.146375
253.3283.1316250.196375
263.53.1316250.368375
273.5633.1316250.431375
283.5693.1316250.437375
293.693.1316250.558375
303.8193.1316250.687375
313.793.1316250.658375
323.9563.1316250.824375
334.0633.1316250.931375
344.0473.1316250.915375
354.0293.1316250.897375
363.9413.1316250.809375
374.0223.1316250.890375
383.8793.1316250.747375
394.0223.1316250.890375
404.0283.1316250.896375
414.0913.1316250.959375
423.9873.1316250.855375
434.013.1316250.878375
444.0073.1316250.875375
454.1913.1316251.059375
464.2993.1316251.167375
474.2733.1316251.141375
483.823.1316250.688375
493.151.0672.083
502.4861.0671.419
511.8121.0670.745
521.2571.0670.190000000000000
531.0621.067-0.00500000000000005
540.8421.067-0.225
550.7821.067-0.285
560.6981.067-0.369
570.3581.067-0.709
580.3471.067-0.72
590.3631.067-0.704
600.3591.067-0.708
610.3551.067-0.712

\begin{tabular}{lllllllll}
\hline
Multiple Linear Regression - Actuals, Interpolation, and Residuals \tabularnewline
Time or Index & Actuals & InterpolationForecast & ResidualsPrediction Error \tabularnewline
1 & 2.085 & 3.13162500000000 & -1.04662500000000 \tabularnewline
2 & 2.053 & 3.131625 & -1.078625 \tabularnewline
3 & 2.077 & 3.131625 & -1.054625 \tabularnewline
4 & 2.058 & 3.131625 & -1.073625 \tabularnewline
5 & 2.057 & 3.131625 & -1.074625 \tabularnewline
6 & 2.076 & 3.131625 & -1.055625 \tabularnewline
7 & 2.07 & 3.131625 & -1.061625 \tabularnewline
8 & 2.062 & 3.131625 & -1.069625 \tabularnewline
9 & 2.073 & 3.131625 & -1.058625 \tabularnewline
10 & 2.061 & 3.131625 & -1.070625 \tabularnewline
11 & 2.094 & 3.131625 & -1.037625 \tabularnewline
12 & 2.067 & 3.131625 & -1.064625 \tabularnewline
13 & 2.086 & 3.131625 & -1.045625 \tabularnewline
14 & 2.276 & 3.131625 & -0.855625 \tabularnewline
15 & 2.326 & 3.131625 & -0.805625 \tabularnewline
16 & 2.349 & 3.131625 & -0.782625 \tabularnewline
17 & 2.52 & 3.131625 & -0.611625 \tabularnewline
18 & 2.628 & 3.131625 & -0.503625 \tabularnewline
19 & 2.577 & 3.131625 & -0.554625 \tabularnewline
20 & 2.698 & 3.131625 & -0.433625 \tabularnewline
21 & 2.814 & 3.131625 & -0.317625 \tabularnewline
22 & 2.968 & 3.131625 & -0.163625 \tabularnewline
23 & 3.041 & 3.131625 & -0.090625 \tabularnewline
24 & 3.278 & 3.131625 & 0.146375 \tabularnewline
25 & 3.328 & 3.131625 & 0.196375 \tabularnewline
26 & 3.5 & 3.131625 & 0.368375 \tabularnewline
27 & 3.563 & 3.131625 & 0.431375 \tabularnewline
28 & 3.569 & 3.131625 & 0.437375 \tabularnewline
29 & 3.69 & 3.131625 & 0.558375 \tabularnewline
30 & 3.819 & 3.131625 & 0.687375 \tabularnewline
31 & 3.79 & 3.131625 & 0.658375 \tabularnewline
32 & 3.956 & 3.131625 & 0.824375 \tabularnewline
33 & 4.063 & 3.131625 & 0.931375 \tabularnewline
34 & 4.047 & 3.131625 & 0.915375 \tabularnewline
35 & 4.029 & 3.131625 & 0.897375 \tabularnewline
36 & 3.941 & 3.131625 & 0.809375 \tabularnewline
37 & 4.022 & 3.131625 & 0.890375 \tabularnewline
38 & 3.879 & 3.131625 & 0.747375 \tabularnewline
39 & 4.022 & 3.131625 & 0.890375 \tabularnewline
40 & 4.028 & 3.131625 & 0.896375 \tabularnewline
41 & 4.091 & 3.131625 & 0.959375 \tabularnewline
42 & 3.987 & 3.131625 & 0.855375 \tabularnewline
43 & 4.01 & 3.131625 & 0.878375 \tabularnewline
44 & 4.007 & 3.131625 & 0.875375 \tabularnewline
45 & 4.191 & 3.131625 & 1.059375 \tabularnewline
46 & 4.299 & 3.131625 & 1.167375 \tabularnewline
47 & 4.273 & 3.131625 & 1.141375 \tabularnewline
48 & 3.82 & 3.131625 & 0.688375 \tabularnewline
49 & 3.15 & 1.067 & 2.083 \tabularnewline
50 & 2.486 & 1.067 & 1.419 \tabularnewline
51 & 1.812 & 1.067 & 0.745 \tabularnewline
52 & 1.257 & 1.067 & 0.190000000000000 \tabularnewline
53 & 1.062 & 1.067 & -0.00500000000000005 \tabularnewline
54 & 0.842 & 1.067 & -0.225 \tabularnewline
55 & 0.782 & 1.067 & -0.285 \tabularnewline
56 & 0.698 & 1.067 & -0.369 \tabularnewline
57 & 0.358 & 1.067 & -0.709 \tabularnewline
58 & 0.347 & 1.067 & -0.72 \tabularnewline
59 & 0.363 & 1.067 & -0.704 \tabularnewline
60 & 0.359 & 1.067 & -0.708 \tabularnewline
61 & 0.355 & 1.067 & -0.712 \tabularnewline
\hline
\end{tabular}
%Source: https://freestatistics.org/blog/index.php?pk=57520&T=4

[TABLE]
[ROW][C]Multiple Linear Regression - Actuals, Interpolation, and Residuals[/C][/ROW]
[ROW][C]Time or Index[/C][C]Actuals[/C][C]InterpolationForecast[/C][C]ResidualsPrediction Error[/C][/ROW]
[ROW][C]1[/C][C]2.085[/C][C]3.13162500000000[/C][C]-1.04662500000000[/C][/ROW]
[ROW][C]2[/C][C]2.053[/C][C]3.131625[/C][C]-1.078625[/C][/ROW]
[ROW][C]3[/C][C]2.077[/C][C]3.131625[/C][C]-1.054625[/C][/ROW]
[ROW][C]4[/C][C]2.058[/C][C]3.131625[/C][C]-1.073625[/C][/ROW]
[ROW][C]5[/C][C]2.057[/C][C]3.131625[/C][C]-1.074625[/C][/ROW]
[ROW][C]6[/C][C]2.076[/C][C]3.131625[/C][C]-1.055625[/C][/ROW]
[ROW][C]7[/C][C]2.07[/C][C]3.131625[/C][C]-1.061625[/C][/ROW]
[ROW][C]8[/C][C]2.062[/C][C]3.131625[/C][C]-1.069625[/C][/ROW]
[ROW][C]9[/C][C]2.073[/C][C]3.131625[/C][C]-1.058625[/C][/ROW]
[ROW][C]10[/C][C]2.061[/C][C]3.131625[/C][C]-1.070625[/C][/ROW]
[ROW][C]11[/C][C]2.094[/C][C]3.131625[/C][C]-1.037625[/C][/ROW]
[ROW][C]12[/C][C]2.067[/C][C]3.131625[/C][C]-1.064625[/C][/ROW]
[ROW][C]13[/C][C]2.086[/C][C]3.131625[/C][C]-1.045625[/C][/ROW]
[ROW][C]14[/C][C]2.276[/C][C]3.131625[/C][C]-0.855625[/C][/ROW]
[ROW][C]15[/C][C]2.326[/C][C]3.131625[/C][C]-0.805625[/C][/ROW]
[ROW][C]16[/C][C]2.349[/C][C]3.131625[/C][C]-0.782625[/C][/ROW]
[ROW][C]17[/C][C]2.52[/C][C]3.131625[/C][C]-0.611625[/C][/ROW]
[ROW][C]18[/C][C]2.628[/C][C]3.131625[/C][C]-0.503625[/C][/ROW]
[ROW][C]19[/C][C]2.577[/C][C]3.131625[/C][C]-0.554625[/C][/ROW]
[ROW][C]20[/C][C]2.698[/C][C]3.131625[/C][C]-0.433625[/C][/ROW]
[ROW][C]21[/C][C]2.814[/C][C]3.131625[/C][C]-0.317625[/C][/ROW]
[ROW][C]22[/C][C]2.968[/C][C]3.131625[/C][C]-0.163625[/C][/ROW]
[ROW][C]23[/C][C]3.041[/C][C]3.131625[/C][C]-0.090625[/C][/ROW]
[ROW][C]24[/C][C]3.278[/C][C]3.131625[/C][C]0.146375[/C][/ROW]
[ROW][C]25[/C][C]3.328[/C][C]3.131625[/C][C]0.196375[/C][/ROW]
[ROW][C]26[/C][C]3.5[/C][C]3.131625[/C][C]0.368375[/C][/ROW]
[ROW][C]27[/C][C]3.563[/C][C]3.131625[/C][C]0.431375[/C][/ROW]
[ROW][C]28[/C][C]3.569[/C][C]3.131625[/C][C]0.437375[/C][/ROW]
[ROW][C]29[/C][C]3.69[/C][C]3.131625[/C][C]0.558375[/C][/ROW]
[ROW][C]30[/C][C]3.819[/C][C]3.131625[/C][C]0.687375[/C][/ROW]
[ROW][C]31[/C][C]3.79[/C][C]3.131625[/C][C]0.658375[/C][/ROW]
[ROW][C]32[/C][C]3.956[/C][C]3.131625[/C][C]0.824375[/C][/ROW]
[ROW][C]33[/C][C]4.063[/C][C]3.131625[/C][C]0.931375[/C][/ROW]
[ROW][C]34[/C][C]4.047[/C][C]3.131625[/C][C]0.915375[/C][/ROW]
[ROW][C]35[/C][C]4.029[/C][C]3.131625[/C][C]0.897375[/C][/ROW]
[ROW][C]36[/C][C]3.941[/C][C]3.131625[/C][C]0.809375[/C][/ROW]
[ROW][C]37[/C][C]4.022[/C][C]3.131625[/C][C]0.890375[/C][/ROW]
[ROW][C]38[/C][C]3.879[/C][C]3.131625[/C][C]0.747375[/C][/ROW]
[ROW][C]39[/C][C]4.022[/C][C]3.131625[/C][C]0.890375[/C][/ROW]
[ROW][C]40[/C][C]4.028[/C][C]3.131625[/C][C]0.896375[/C][/ROW]
[ROW][C]41[/C][C]4.091[/C][C]3.131625[/C][C]0.959375[/C][/ROW]
[ROW][C]42[/C][C]3.987[/C][C]3.131625[/C][C]0.855375[/C][/ROW]
[ROW][C]43[/C][C]4.01[/C][C]3.131625[/C][C]0.878375[/C][/ROW]
[ROW][C]44[/C][C]4.007[/C][C]3.131625[/C][C]0.875375[/C][/ROW]
[ROW][C]45[/C][C]4.191[/C][C]3.131625[/C][C]1.059375[/C][/ROW]
[ROW][C]46[/C][C]4.299[/C][C]3.131625[/C][C]1.167375[/C][/ROW]
[ROW][C]47[/C][C]4.273[/C][C]3.131625[/C][C]1.141375[/C][/ROW]
[ROW][C]48[/C][C]3.82[/C][C]3.131625[/C][C]0.688375[/C][/ROW]
[ROW][C]49[/C][C]3.15[/C][C]1.067[/C][C]2.083[/C][/ROW]
[ROW][C]50[/C][C]2.486[/C][C]1.067[/C][C]1.419[/C][/ROW]
[ROW][C]51[/C][C]1.812[/C][C]1.067[/C][C]0.745[/C][/ROW]
[ROW][C]52[/C][C]1.257[/C][C]1.067[/C][C]0.190000000000000[/C][/ROW]
[ROW][C]53[/C][C]1.062[/C][C]1.067[/C][C]-0.00500000000000005[/C][/ROW]
[ROW][C]54[/C][C]0.842[/C][C]1.067[/C][C]-0.225[/C][/ROW]
[ROW][C]55[/C][C]0.782[/C][C]1.067[/C][C]-0.285[/C][/ROW]
[ROW][C]56[/C][C]0.698[/C][C]1.067[/C][C]-0.369[/C][/ROW]
[ROW][C]57[/C][C]0.358[/C][C]1.067[/C][C]-0.709[/C][/ROW]
[ROW][C]58[/C][C]0.347[/C][C]1.067[/C][C]-0.72[/C][/ROW]
[ROW][C]59[/C][C]0.363[/C][C]1.067[/C][C]-0.704[/C][/ROW]
[ROW][C]60[/C][C]0.359[/C][C]1.067[/C][C]-0.708[/C][/ROW]
[ROW][C]61[/C][C]0.355[/C][C]1.067[/C][C]-0.712[/C][/ROW]
[/TABLE]
Source: https://freestatistics.org/blog/index.php?pk=57520&T=4

Globally Unique Identifier (entire table): ba.freestatistics.org/blog/index.php?pk=57520&T=4

As an alternative you can also use a QR Code:  

The GUIDs for individual cells are displayed in the table below:

Multiple Linear Regression - Actuals, Interpolation, and Residuals
Time or IndexActualsInterpolationForecastResidualsPrediction Error
12.0853.13162500000000-1.04662500000000
22.0533.131625-1.078625
32.0773.131625-1.054625
42.0583.131625-1.073625
52.0573.131625-1.074625
62.0763.131625-1.055625
72.073.131625-1.061625
82.0623.131625-1.069625
92.0733.131625-1.058625
102.0613.131625-1.070625
112.0943.131625-1.037625
122.0673.131625-1.064625
132.0863.131625-1.045625
142.2763.131625-0.855625
152.3263.131625-0.805625
162.3493.131625-0.782625
172.523.131625-0.611625
182.6283.131625-0.503625
192.5773.131625-0.554625
202.6983.131625-0.433625
212.8143.131625-0.317625
222.9683.131625-0.163625
233.0413.131625-0.090625
243.2783.1316250.146375
253.3283.1316250.196375
263.53.1316250.368375
273.5633.1316250.431375
283.5693.1316250.437375
293.693.1316250.558375
303.8193.1316250.687375
313.793.1316250.658375
323.9563.1316250.824375
334.0633.1316250.931375
344.0473.1316250.915375
354.0293.1316250.897375
363.9413.1316250.809375
374.0223.1316250.890375
383.8793.1316250.747375
394.0223.1316250.890375
404.0283.1316250.896375
414.0913.1316250.959375
423.9873.1316250.855375
434.013.1316250.878375
444.0073.1316250.875375
454.1913.1316251.059375
464.2993.1316251.167375
474.2733.1316251.141375
483.823.1316250.688375
493.151.0672.083
502.4861.0671.419
511.8121.0670.745
521.2571.0670.190000000000000
531.0621.067-0.00500000000000005
540.8421.067-0.225
550.7821.067-0.285
560.6981.067-0.369
570.3581.067-0.709
580.3471.067-0.72
590.3631.067-0.704
600.3591.067-0.708
610.3551.067-0.712


Goldfeld-Quandt test for Heteroskedasticity
p-valuesAlternative Hypothesis
breakpoint indexgreater2-sidedless
51.05356688266494e-052.10713376532989e-050.999989464331173
62.18557401155255e-074.3711480231051e-070.9999997814426
73.72664283637826e-097.45328567275652e-090.999999996273357
86.74160368953783e-111.34832073790757e-100.999999999932584
91.22453393570006e-122.44906787140011e-120.999999999998775
102.43131449787494e-144.86262899574987e-140.999999999999976
114.098636179675e-158.19727235935e-150.999999999999996
129.80072208080984e-171.96014441616197e-161
135.39426433288489e-181.07885286657698e-171
141.35310986428096e-112.70621972856193e-110.999999999986469
153.73788219053169e-107.47576438106338e-100.999999999626212
161.95085394488145e-093.9017078897629e-090.999999998049146
177.10437836238535e-081.42087567247707e-070.999999928956216
181.4206052769311e-062.8412105538622e-060.999998579394723
195.24342735455970e-061.04868547091194e-050.999994756572645
203.05269709672550e-056.105394193451e-050.999969473029033
210.0002008650766299470.0004017301532598930.99979913492337
220.001427923716881770.002855847433763530.998572076283118
230.006474098594389940.01294819718877990.99352590140561
240.03084595182355010.06169190364710020.96915404817645
250.08266781717669830.1653356343533970.917332182823302
260.1822417481160510.3644834962321010.81775825188395
270.2994255707271180.5988511414542360.700574429272882
280.4014311512189850.802862302437970.598568848781015
290.5025381845763820.9949236308472360.497461815423618
300.5962697890385420.8074604219229150.403730210961458
310.6525326114461250.694934777107750.347467388553875
320.709211772278820.5815764554423590.290788227721180
330.7562041985738630.4875916028522730.243795801426136
340.7801857699370750.4396284601258490.219814230062925
350.7889397924272460.4221204151455070.211060207572754
360.7815822345427520.4368355309144960.218417765457248
370.7731642767510460.4536714464979080.226835723248954
380.7497897424556420.5004205150887170.250210257544358
390.7282942662431130.5434114675137740.271705733756887
400.7004865238181530.5990269523636940.299513476181847
410.670253566495350.65949286700930.32974643350465
420.6269262349437370.7461475301125270.373073765056263
430.5787993568560890.8424012862878210.421200643143911
440.5253262702819960.9493474594360070.474673729718004
450.477324593488840.954649186977680.52267540651116
460.4344544570170480.8689089140340960.565545542982952
470.3896728225165860.7793456450331720.610327177483414
480.3137642969643220.6275285939286430.686235703035678
490.7214604506843650.557079098631270.278539549315635
500.9507962820704050.09840743585919030.0492037179295952
510.992580608281650.01483878343669950.00741939171834974
520.996584282353510.006831435292978210.00341571764648911
530.998051308719350.003897382561301780.00194869128065089
540.997634676164660.004730647670681790.00236532383534089
550.9978110757756240.004377848448752530.00218892422437627
560.9999992630563941.47388721289087e-067.36943606445433e-07

\begin{tabular}{lllllllll}
\hline
Goldfeld-Quandt test for Heteroskedasticity \tabularnewline
p-values & Alternative Hypothesis \tabularnewline
breakpoint index & greater & 2-sided & less \tabularnewline
5 & 1.05356688266494e-05 & 2.10713376532989e-05 & 0.999989464331173 \tabularnewline
6 & 2.18557401155255e-07 & 4.3711480231051e-07 & 0.9999997814426 \tabularnewline
7 & 3.72664283637826e-09 & 7.45328567275652e-09 & 0.999999996273357 \tabularnewline
8 & 6.74160368953783e-11 & 1.34832073790757e-10 & 0.999999999932584 \tabularnewline
9 & 1.22453393570006e-12 & 2.44906787140011e-12 & 0.999999999998775 \tabularnewline
10 & 2.43131449787494e-14 & 4.86262899574987e-14 & 0.999999999999976 \tabularnewline
11 & 4.098636179675e-15 & 8.19727235935e-15 & 0.999999999999996 \tabularnewline
12 & 9.80072208080984e-17 & 1.96014441616197e-16 & 1 \tabularnewline
13 & 5.39426433288489e-18 & 1.07885286657698e-17 & 1 \tabularnewline
14 & 1.35310986428096e-11 & 2.70621972856193e-11 & 0.999999999986469 \tabularnewline
15 & 3.73788219053169e-10 & 7.47576438106338e-10 & 0.999999999626212 \tabularnewline
16 & 1.95085394488145e-09 & 3.9017078897629e-09 & 0.999999998049146 \tabularnewline
17 & 7.10437836238535e-08 & 1.42087567247707e-07 & 0.999999928956216 \tabularnewline
18 & 1.4206052769311e-06 & 2.8412105538622e-06 & 0.999998579394723 \tabularnewline
19 & 5.24342735455970e-06 & 1.04868547091194e-05 & 0.999994756572645 \tabularnewline
20 & 3.05269709672550e-05 & 6.105394193451e-05 & 0.999969473029033 \tabularnewline
21 & 0.000200865076629947 & 0.000401730153259893 & 0.99979913492337 \tabularnewline
22 & 0.00142792371688177 & 0.00285584743376353 & 0.998572076283118 \tabularnewline
23 & 0.00647409859438994 & 0.0129481971887799 & 0.99352590140561 \tabularnewline
24 & 0.0308459518235501 & 0.0616919036471002 & 0.96915404817645 \tabularnewline
25 & 0.0826678171766983 & 0.165335634353397 & 0.917332182823302 \tabularnewline
26 & 0.182241748116051 & 0.364483496232101 & 0.81775825188395 \tabularnewline
27 & 0.299425570727118 & 0.598851141454236 & 0.700574429272882 \tabularnewline
28 & 0.401431151218985 & 0.80286230243797 & 0.598568848781015 \tabularnewline
29 & 0.502538184576382 & 0.994923630847236 & 0.497461815423618 \tabularnewline
30 & 0.596269789038542 & 0.807460421922915 & 0.403730210961458 \tabularnewline
31 & 0.652532611446125 & 0.69493477710775 & 0.347467388553875 \tabularnewline
32 & 0.70921177227882 & 0.581576455442359 & 0.290788227721180 \tabularnewline
33 & 0.756204198573863 & 0.487591602852273 & 0.243795801426136 \tabularnewline
34 & 0.780185769937075 & 0.439628460125849 & 0.219814230062925 \tabularnewline
35 & 0.788939792427246 & 0.422120415145507 & 0.211060207572754 \tabularnewline
36 & 0.781582234542752 & 0.436835530914496 & 0.218417765457248 \tabularnewline
37 & 0.773164276751046 & 0.453671446497908 & 0.226835723248954 \tabularnewline
38 & 0.749789742455642 & 0.500420515088717 & 0.250210257544358 \tabularnewline
39 & 0.728294266243113 & 0.543411467513774 & 0.271705733756887 \tabularnewline
40 & 0.700486523818153 & 0.599026952363694 & 0.299513476181847 \tabularnewline
41 & 0.67025356649535 & 0.6594928670093 & 0.32974643350465 \tabularnewline
42 & 0.626926234943737 & 0.746147530112527 & 0.373073765056263 \tabularnewline
43 & 0.578799356856089 & 0.842401286287821 & 0.421200643143911 \tabularnewline
44 & 0.525326270281996 & 0.949347459436007 & 0.474673729718004 \tabularnewline
45 & 0.47732459348884 & 0.95464918697768 & 0.52267540651116 \tabularnewline
46 & 0.434454457017048 & 0.868908914034096 & 0.565545542982952 \tabularnewline
47 & 0.389672822516586 & 0.779345645033172 & 0.610327177483414 \tabularnewline
48 & 0.313764296964322 & 0.627528593928643 & 0.686235703035678 \tabularnewline
49 & 0.721460450684365 & 0.55707909863127 & 0.278539549315635 \tabularnewline
50 & 0.950796282070405 & 0.0984074358591903 & 0.0492037179295952 \tabularnewline
51 & 0.99258060828165 & 0.0148387834366995 & 0.00741939171834974 \tabularnewline
52 & 0.99658428235351 & 0.00683143529297821 & 0.00341571764648911 \tabularnewline
53 & 0.99805130871935 & 0.00389738256130178 & 0.00194869128065089 \tabularnewline
54 & 0.99763467616466 & 0.00473064767068179 & 0.00236532383534089 \tabularnewline
55 & 0.997811075775624 & 0.00437784844875253 & 0.00218892422437627 \tabularnewline
56 & 0.999999263056394 & 1.47388721289087e-06 & 7.36943606445433e-07 \tabularnewline
\hline
\end{tabular}
%Source: https://freestatistics.org/blog/index.php?pk=57520&T=5

[TABLE]
[ROW][C]Goldfeld-Quandt test for Heteroskedasticity[/C][/ROW]
[ROW][C]p-values[/C][C]Alternative Hypothesis[/C][/ROW]
[ROW][C]breakpoint index[/C][C]greater[/C][C]2-sided[/C][C]less[/C][/ROW]
[ROW][C]5[/C][C]1.05356688266494e-05[/C][C]2.10713376532989e-05[/C][C]0.999989464331173[/C][/ROW]
[ROW][C]6[/C][C]2.18557401155255e-07[/C][C]4.3711480231051e-07[/C][C]0.9999997814426[/C][/ROW]
[ROW][C]7[/C][C]3.72664283637826e-09[/C][C]7.45328567275652e-09[/C][C]0.999999996273357[/C][/ROW]
[ROW][C]8[/C][C]6.74160368953783e-11[/C][C]1.34832073790757e-10[/C][C]0.999999999932584[/C][/ROW]
[ROW][C]9[/C][C]1.22453393570006e-12[/C][C]2.44906787140011e-12[/C][C]0.999999999998775[/C][/ROW]
[ROW][C]10[/C][C]2.43131449787494e-14[/C][C]4.86262899574987e-14[/C][C]0.999999999999976[/C][/ROW]
[ROW][C]11[/C][C]4.098636179675e-15[/C][C]8.19727235935e-15[/C][C]0.999999999999996[/C][/ROW]
[ROW][C]12[/C][C]9.80072208080984e-17[/C][C]1.96014441616197e-16[/C][C]1[/C][/ROW]
[ROW][C]13[/C][C]5.39426433288489e-18[/C][C]1.07885286657698e-17[/C][C]1[/C][/ROW]
[ROW][C]14[/C][C]1.35310986428096e-11[/C][C]2.70621972856193e-11[/C][C]0.999999999986469[/C][/ROW]
[ROW][C]15[/C][C]3.73788219053169e-10[/C][C]7.47576438106338e-10[/C][C]0.999999999626212[/C][/ROW]
[ROW][C]16[/C][C]1.95085394488145e-09[/C][C]3.9017078897629e-09[/C][C]0.999999998049146[/C][/ROW]
[ROW][C]17[/C][C]7.10437836238535e-08[/C][C]1.42087567247707e-07[/C][C]0.999999928956216[/C][/ROW]
[ROW][C]18[/C][C]1.4206052769311e-06[/C][C]2.8412105538622e-06[/C][C]0.999998579394723[/C][/ROW]
[ROW][C]19[/C][C]5.24342735455970e-06[/C][C]1.04868547091194e-05[/C][C]0.999994756572645[/C][/ROW]
[ROW][C]20[/C][C]3.05269709672550e-05[/C][C]6.105394193451e-05[/C][C]0.999969473029033[/C][/ROW]
[ROW][C]21[/C][C]0.000200865076629947[/C][C]0.000401730153259893[/C][C]0.99979913492337[/C][/ROW]
[ROW][C]22[/C][C]0.00142792371688177[/C][C]0.00285584743376353[/C][C]0.998572076283118[/C][/ROW]
[ROW][C]23[/C][C]0.00647409859438994[/C][C]0.0129481971887799[/C][C]0.99352590140561[/C][/ROW]
[ROW][C]24[/C][C]0.0308459518235501[/C][C]0.0616919036471002[/C][C]0.96915404817645[/C][/ROW]
[ROW][C]25[/C][C]0.0826678171766983[/C][C]0.165335634353397[/C][C]0.917332182823302[/C][/ROW]
[ROW][C]26[/C][C]0.182241748116051[/C][C]0.364483496232101[/C][C]0.81775825188395[/C][/ROW]
[ROW][C]27[/C][C]0.299425570727118[/C][C]0.598851141454236[/C][C]0.700574429272882[/C][/ROW]
[ROW][C]28[/C][C]0.401431151218985[/C][C]0.80286230243797[/C][C]0.598568848781015[/C][/ROW]
[ROW][C]29[/C][C]0.502538184576382[/C][C]0.994923630847236[/C][C]0.497461815423618[/C][/ROW]
[ROW][C]30[/C][C]0.596269789038542[/C][C]0.807460421922915[/C][C]0.403730210961458[/C][/ROW]
[ROW][C]31[/C][C]0.652532611446125[/C][C]0.69493477710775[/C][C]0.347467388553875[/C][/ROW]
[ROW][C]32[/C][C]0.70921177227882[/C][C]0.581576455442359[/C][C]0.290788227721180[/C][/ROW]
[ROW][C]33[/C][C]0.756204198573863[/C][C]0.487591602852273[/C][C]0.243795801426136[/C][/ROW]
[ROW][C]34[/C][C]0.780185769937075[/C][C]0.439628460125849[/C][C]0.219814230062925[/C][/ROW]
[ROW][C]35[/C][C]0.788939792427246[/C][C]0.422120415145507[/C][C]0.211060207572754[/C][/ROW]
[ROW][C]36[/C][C]0.781582234542752[/C][C]0.436835530914496[/C][C]0.218417765457248[/C][/ROW]
[ROW][C]37[/C][C]0.773164276751046[/C][C]0.453671446497908[/C][C]0.226835723248954[/C][/ROW]
[ROW][C]38[/C][C]0.749789742455642[/C][C]0.500420515088717[/C][C]0.250210257544358[/C][/ROW]
[ROW][C]39[/C][C]0.728294266243113[/C][C]0.543411467513774[/C][C]0.271705733756887[/C][/ROW]
[ROW][C]40[/C][C]0.700486523818153[/C][C]0.599026952363694[/C][C]0.299513476181847[/C][/ROW]
[ROW][C]41[/C][C]0.67025356649535[/C][C]0.6594928670093[/C][C]0.32974643350465[/C][/ROW]
[ROW][C]42[/C][C]0.626926234943737[/C][C]0.746147530112527[/C][C]0.373073765056263[/C][/ROW]
[ROW][C]43[/C][C]0.578799356856089[/C][C]0.842401286287821[/C][C]0.421200643143911[/C][/ROW]
[ROW][C]44[/C][C]0.525326270281996[/C][C]0.949347459436007[/C][C]0.474673729718004[/C][/ROW]
[ROW][C]45[/C][C]0.47732459348884[/C][C]0.95464918697768[/C][C]0.52267540651116[/C][/ROW]
[ROW][C]46[/C][C]0.434454457017048[/C][C]0.868908914034096[/C][C]0.565545542982952[/C][/ROW]
[ROW][C]47[/C][C]0.389672822516586[/C][C]0.779345645033172[/C][C]0.610327177483414[/C][/ROW]
[ROW][C]48[/C][C]0.313764296964322[/C][C]0.627528593928643[/C][C]0.686235703035678[/C][/ROW]
[ROW][C]49[/C][C]0.721460450684365[/C][C]0.55707909863127[/C][C]0.278539549315635[/C][/ROW]
[ROW][C]50[/C][C]0.950796282070405[/C][C]0.0984074358591903[/C][C]0.0492037179295952[/C][/ROW]
[ROW][C]51[/C][C]0.99258060828165[/C][C]0.0148387834366995[/C][C]0.00741939171834974[/C][/ROW]
[ROW][C]52[/C][C]0.99658428235351[/C][C]0.00683143529297821[/C][C]0.00341571764648911[/C][/ROW]
[ROW][C]53[/C][C]0.99805130871935[/C][C]0.00389738256130178[/C][C]0.00194869128065089[/C][/ROW]
[ROW][C]54[/C][C]0.99763467616466[/C][C]0.00473064767068179[/C][C]0.00236532383534089[/C][/ROW]
[ROW][C]55[/C][C]0.997811075775624[/C][C]0.00437784844875253[/C][C]0.00218892422437627[/C][/ROW]
[ROW][C]56[/C][C]0.999999263056394[/C][C]1.47388721289087e-06[/C][C]7.36943606445433e-07[/C][/ROW]
[/TABLE]
Source: https://freestatistics.org/blog/index.php?pk=57520&T=5

Globally Unique Identifier (entire table): ba.freestatistics.org/blog/index.php?pk=57520&T=5

As an alternative you can also use a QR Code:  

The GUIDs for individual cells are displayed in the table below:

Goldfeld-Quandt test for Heteroskedasticity
p-valuesAlternative Hypothesis
breakpoint indexgreater2-sidedless
51.05356688266494e-052.10713376532989e-050.999989464331173
62.18557401155255e-074.3711480231051e-070.9999997814426
73.72664283637826e-097.45328567275652e-090.999999996273357
86.74160368953783e-111.34832073790757e-100.999999999932584
91.22453393570006e-122.44906787140011e-120.999999999998775
102.43131449787494e-144.86262899574987e-140.999999999999976
114.098636179675e-158.19727235935e-150.999999999999996
129.80072208080984e-171.96014441616197e-161
135.39426433288489e-181.07885286657698e-171
141.35310986428096e-112.70621972856193e-110.999999999986469
153.73788219053169e-107.47576438106338e-100.999999999626212
161.95085394488145e-093.9017078897629e-090.999999998049146
177.10437836238535e-081.42087567247707e-070.999999928956216
181.4206052769311e-062.8412105538622e-060.999998579394723
195.24342735455970e-061.04868547091194e-050.999994756572645
203.05269709672550e-056.105394193451e-050.999969473029033
210.0002008650766299470.0004017301532598930.99979913492337
220.001427923716881770.002855847433763530.998572076283118
230.006474098594389940.01294819718877990.99352590140561
240.03084595182355010.06169190364710020.96915404817645
250.08266781717669830.1653356343533970.917332182823302
260.1822417481160510.3644834962321010.81775825188395
270.2994255707271180.5988511414542360.700574429272882
280.4014311512189850.802862302437970.598568848781015
290.5025381845763820.9949236308472360.497461815423618
300.5962697890385420.8074604219229150.403730210961458
310.6525326114461250.694934777107750.347467388553875
320.709211772278820.5815764554423590.290788227721180
330.7562041985738630.4875916028522730.243795801426136
340.7801857699370750.4396284601258490.219814230062925
350.7889397924272460.4221204151455070.211060207572754
360.7815822345427520.4368355309144960.218417765457248
370.7731642767510460.4536714464979080.226835723248954
380.7497897424556420.5004205150887170.250210257544358
390.7282942662431130.5434114675137740.271705733756887
400.7004865238181530.5990269523636940.299513476181847
410.670253566495350.65949286700930.32974643350465
420.6269262349437370.7461475301125270.373073765056263
430.5787993568560890.8424012862878210.421200643143911
440.5253262702819960.9493474594360070.474673729718004
450.477324593488840.954649186977680.52267540651116
460.4344544570170480.8689089140340960.565545542982952
470.3896728225165860.7793456450331720.610327177483414
480.3137642969643220.6275285939286430.686235703035678
490.7214604506843650.557079098631270.278539549315635
500.9507962820704050.09840743585919030.0492037179295952
510.992580608281650.01483878343669950.00741939171834974
520.996584282353510.006831435292978210.00341571764648911
530.998051308719350.003897382561301780.00194869128065089
540.997634676164660.004730647670681790.00236532383534089
550.9978110757756240.004377848448752530.00218892422437627
560.9999992630563941.47388721289087e-067.36943606445433e-07


Meta Analysis of Goldfeld-Quandt test for Heteroskedasticity
Description# significant tests% significant testsOK/NOK
1% type I error level230.442307692307692NOK
5% type I error level250.480769230769231NOK
10% type I error level270.519230769230769NOK

\begin{tabular}{lllllllll}
\hline
Meta Analysis of Goldfeld-Quandt test for Heteroskedasticity \tabularnewline
Description & # significant tests & % significant tests & OK/NOK \tabularnewline
1% type I error level & 23 & 0.442307692307692 & NOK \tabularnewline
5% type I error level & 25 & 0.480769230769231 & NOK \tabularnewline
10% type I error level & 27 & 0.519230769230769 & NOK \tabularnewline
\hline
\end{tabular}
%Source: https://freestatistics.org/blog/index.php?pk=57520&T=6

[TABLE]
[ROW][C]Meta Analysis of Goldfeld-Quandt test for Heteroskedasticity[/C][/ROW]
[ROW][C]Description[/C][C]# significant tests[/C][C]% significant tests[/C][C]OK/NOK[/C][/ROW]
[ROW][C]1% type I error level[/C][C]23[/C][C]0.442307692307692[/C][C]NOK[/C][/ROW]
[ROW][C]5% type I error level[/C][C]25[/C][C]0.480769230769231[/C][C]NOK[/C][/ROW]
[ROW][C]10% type I error level[/C][C]27[/C][C]0.519230769230769[/C][C]NOK[/C][/ROW]
[/TABLE]
Source: https://freestatistics.org/blog/index.php?pk=57520&T=6

Globally Unique Identifier (entire table): ba.freestatistics.org/blog/index.php?pk=57520&T=6

As an alternative you can also use a QR Code:  

The GUIDs for individual cells are displayed in the table below:

Meta Analysis of Goldfeld-Quandt test for Heteroskedasticity
Description# significant tests% significant testsOK/NOK
1% type I error level230.442307692307692NOK
5% type I error level250.480769230769231NOK
10% type I error level270.519230769230769NOK


Parameters (Session):
par1 = 1 ; par2 = Do not include Seasonal Dummies ; par3 = No Linear Trend ;
Parameters (R input):
par1 = 1 ; par2 = Do not include Seasonal Dummies ; par3 = No Linear Trend ;
R code (references can be found in the software module):
library(lattice)
library(lmtest)
n25 <- 25 #minimum number of obs. for Goldfeld-Quandt test
par1 <- as.numeric(par1)
x <- t(y)
k <- length(x[1,])
n <- length(x[,1])
x1 <- cbind(x[,par1], x[,1:k!=par1])
mycolnames <- c(colnames(x)[par1], colnames(x)[1:k!=par1])
colnames(x1) <- mycolnames #colnames(x)[par1]
x <- x1
if (par3 == 'First Differences'){
x2 <- array(0, dim=c(n-1,k), dimnames=list(1:(n-1), paste('(1-B)',colnames(x),sep='')))
for (i in 1:n-1) {
for (j in 1:k) {
x2[i,j] <- x[i+1,j] - x[i,j]
}
}
x <- x2
}
if (par2 == 'Include Monthly Dummies'){
x2 <- array(0, dim=c(n,11), dimnames=list(1:n, paste('M', seq(1:11), sep ='')))
for (i in 1:11){
x2[seq(i,n,12),i] <- 1
}
x <- cbind(x, x2)
}
if (par2 == 'Include Quarterly Dummies'){
x2 <- array(0, dim=c(n,3), dimnames=list(1:n, paste('Q', seq(1:3), sep ='')))
for (i in 1:3){
x2[seq(i,n,4),i] <- 1
}
x <- cbind(x, x2)
}
k <- length(x[1,])
if (par3 == 'Linear Trend'){
x <- cbind(x, c(1:n))
colnames(x)[k+1] <- 't'
}
x
k <- length(x[1,])
df <- as.data.frame(x)
(mylm <- lm(df))
(mysum <- summary(mylm))
if (n > n25) {
kp3 <- k + 3
nmkm3 <- n - k - 3
gqarr <- array(NA, dim=c(nmkm3-kp3+1,3))
numgqtests <- 0
numsignificant1 <- 0
numsignificant5 <- 0
numsignificant10 <- 0
for (mypoint in kp3:nmkm3) {
j <- 0
numgqtests <- numgqtests + 1
for (myalt in c('greater', 'two.sided', 'less')) {
j <- j + 1
gqarr[mypoint-kp3+1,j] <- gqtest(mylm, point=mypoint, alternative=myalt)$p.value
}
if (gqarr[mypoint-kp3+1,2] < 0.01) numsignificant1 <- numsignificant1 + 1
if (gqarr[mypoint-kp3+1,2] < 0.05) numsignificant5 <- numsignificant5 + 1
if (gqarr[mypoint-kp3+1,2] < 0.10) numsignificant10 <- numsignificant10 + 1
}
gqarr
}
bitmap(file='test0.png')
plot(x[,1], type='l', main='Actuals and Interpolation', ylab='value of Actuals and Interpolation (dots)', xlab='time or index')
points(x[,1]-mysum$resid)
grid()
dev.off()
bitmap(file='test1.png')
plot(mysum$resid, type='b', pch=19, main='Residuals', ylab='value of Residuals', xlab='time or index')
grid()
dev.off()
bitmap(file='test2.png')
hist(mysum$resid, main='Residual Histogram', xlab='values of Residuals')
grid()
dev.off()
bitmap(file='test3.png')
densityplot(~mysum$resid,col='black',main='Residual Density Plot', xlab='values of Residuals')
dev.off()
bitmap(file='test4.png')
qqnorm(mysum$resid, main='Residual Normal Q-Q Plot')
qqline(mysum$resid)
grid()
dev.off()
(myerror <- as.ts(mysum$resid))
bitmap(file='test5.png')
dum <- cbind(lag(myerror,k=1),myerror)
dum
dum1 <- dum[2:length(myerror),]
dum1
z <- as.data.frame(dum1)
z
plot(z,main=paste('Residual Lag plot, lowess, and regression line'), ylab='values of Residuals', xlab='lagged values of Residuals')
lines(lowess(z))
abline(lm(z))
grid()
dev.off()
bitmap(file='test6.png')
acf(mysum$resid, lag.max=length(mysum$resid)/2, main='Residual Autocorrelation Function')
grid()
dev.off()
bitmap(file='test7.png')
pacf(mysum$resid, lag.max=length(mysum$resid)/2, main='Residual Partial Autocorrelation Function')
grid()
dev.off()
bitmap(file='test8.png')
opar <- par(mfrow = c(2,2), oma = c(0, 0, 1.1, 0))
plot(mylm, las = 1, sub='Residual Diagnostics')
par(opar)
dev.off()
if (n > n25) {
bitmap(file='test9.png')
plot(kp3:nmkm3,gqarr[,2], main='Goldfeld-Quandt test',ylab='2-sided p-value',xlab='breakpoint')
grid()
dev.off()
}
load(file='createtable')
a<-table.start()
a<-table.row.start(a)
a<-table.element(a, 'Multiple Linear Regression - Estimated Regression Equation', 1, TRUE)
a<-table.row.end(a)
myeq <- colnames(x)[1]
myeq <- paste(myeq, '[t] = ', sep='')
for (i in 1:k){
if (mysum$coefficients[i,1] > 0) myeq <- paste(myeq, '+', '')
myeq <- paste(myeq, mysum$coefficients[i,1], sep=' ')
if (rownames(mysum$coefficients)[i] != '(Intercept)') {
myeq <- paste(myeq, rownames(mysum$coefficients)[i], sep='')
if (rownames(mysum$coefficients)[i] != 't') myeq <- paste(myeq, '[t]', sep='')
}
}
myeq <- paste(myeq, ' + e[t]')
a<-table.row.start(a)
a<-table.element(a, myeq)
a<-table.row.end(a)
a<-table.end(a)
table.save(a,file='mytable1.tab')
a<-table.start()
a<-table.row.start(a)
a<-table.element(a,hyperlink('ols1.htm','Multiple Linear Regression - Ordinary Least Squares',''), 6, TRUE)
a<-table.row.end(a)
a<-table.row.start(a)
a<-table.element(a,'Variable',header=TRUE)
a<-table.element(a,'Parameter',header=TRUE)
a<-table.element(a,'S.D.',header=TRUE)
a<-table.element(a,'T-STAT
H0: parameter = 0',header=TRUE)
a<-table.element(a,'2-tail p-value',header=TRUE)
a<-table.element(a,'1-tail p-value',header=TRUE)
a<-table.row.end(a)
for (i in 1:k){
a<-table.row.start(a)
a<-table.element(a,rownames(mysum$coefficients)[i],header=TRUE)
a<-table.element(a,mysum$coefficients[i,1])
a<-table.element(a, round(mysum$coefficients[i,2],6))
a<-table.element(a, round(mysum$coefficients[i,3],4))
a<-table.element(a, round(mysum$coefficients[i,4],6))
a<-table.element(a, round(mysum$coefficients[i,4]/2,6))
a<-table.row.end(a)
}
a<-table.end(a)
table.save(a,file='mytable2.tab')
a<-table.start()
a<-table.row.start(a)
a<-table.element(a, 'Multiple Linear Regression - Regression Statistics', 2, TRUE)
a<-table.row.end(a)
a<-table.row.start(a)
a<-table.element(a, 'Multiple R',1,TRUE)
a<-table.element(a, sqrt(mysum$r.squared))
a<-table.row.end(a)
a<-table.row.start(a)
a<-table.element(a, 'R-squared',1,TRUE)
a<-table.element(a, mysum$r.squared)
a<-table.row.end(a)
a<-table.row.start(a)
a<-table.element(a, 'Adjusted R-squared',1,TRUE)
a<-table.element(a, mysum$adj.r.squared)
a<-table.row.end(a)
a<-table.row.start(a)
a<-table.element(a, 'F-TEST (value)',1,TRUE)
a<-table.element(a, mysum$fstatistic[1])
a<-table.row.end(a)
a<-table.row.start(a)
a<-table.element(a, 'F-TEST (DF numerator)',1,TRUE)
a<-table.element(a, mysum$fstatistic[2])
a<-table.row.end(a)
a<-table.row.start(a)
a<-table.element(a, 'F-TEST (DF denominator)',1,TRUE)
a<-table.element(a, mysum$fstatistic[3])
a<-table.row.end(a)
a<-table.row.start(a)
a<-table.element(a, 'p-value',1,TRUE)
a<-table.element(a, 1-pf(mysum$fstatistic[1],mysum$fstatistic[2],mysum$fstatistic[3]))
a<-table.row.end(a)
a<-table.row.start(a)
a<-table.element(a, 'Multiple Linear Regression - Residual Statistics', 2, TRUE)
a<-table.row.end(a)
a<-table.row.start(a)
a<-table.element(a, 'Residual Standard Deviation',1,TRUE)
a<-table.element(a, mysum$sigma)
a<-table.row.end(a)
a<-table.row.start(a)
a<-table.element(a, 'Sum Squared Residuals',1,TRUE)
a<-table.element(a, sum(myerror*myerror))
a<-table.row.end(a)
a<-table.end(a)
table.save(a,file='mytable3.tab')
a<-table.start()
a<-table.row.start(a)
a<-table.element(a, 'Multiple Linear Regression - Actuals, Interpolation, and Residuals', 4, TRUE)
a<-table.row.end(a)
a<-table.row.start(a)
a<-table.element(a, 'Time or Index', 1, TRUE)
a<-table.element(a, 'Actuals', 1, TRUE)
a<-table.element(a, 'Interpolation
Forecast', 1, TRUE)
a<-table.element(a, 'Residuals
Prediction Error', 1, TRUE)
a<-table.row.end(a)
for (i in 1:n) {
a<-table.row.start(a)
a<-table.element(a,i, 1, TRUE)
a<-table.element(a,x[i])
a<-table.element(a,x[i]-mysum$resid[i])
a<-table.element(a,mysum$resid[i])
a<-table.row.end(a)
}
a<-table.end(a)
table.save(a,file='mytable4.tab')
if (n > n25) {
a<-table.start()
a<-table.row.start(a)
a<-table.element(a,'Goldfeld-Quandt test for Heteroskedasticity',4,TRUE)
a<-table.row.end(a)
a<-table.row.start(a)
a<-table.element(a,'p-values',header=TRUE)
a<-table.element(a,'Alternative Hypothesis',3,header=TRUE)
a<-table.row.end(a)
a<-table.row.start(a)
a<-table.element(a,'breakpoint index',header=TRUE)
a<-table.element(a,'greater',header=TRUE)
a<-table.element(a,'2-sided',header=TRUE)
a<-table.element(a,'less',header=TRUE)
a<-table.row.end(a)
for (mypoint in kp3:nmkm3) {
a<-table.row.start(a)
a<-table.element(a,mypoint,header=TRUE)
a<-table.element(a,gqarr[mypoint-kp3+1,1])
a<-table.element(a,gqarr[mypoint-kp3+1,2])
a<-table.element(a,gqarr[mypoint-kp3+1,3])
a<-table.row.end(a)
}
a<-table.end(a)
table.save(a,file='mytable5.tab')
a<-table.start()
a<-table.row.start(a)
a<-table.element(a,'Meta Analysis of Goldfeld-Quandt test for Heteroskedasticity',4,TRUE)
a<-table.row.end(a)
a<-table.row.start(a)
a<-table.element(a,'Description',header=TRUE)
a<-table.element(a,'# significant tests',header=TRUE)
a<-table.element(a,'% significant tests',header=TRUE)
a<-table.element(a,'OK/NOK',header=TRUE)
a<-table.row.end(a)
a<-table.row.start(a)
a<-table.element(a,'1% type I error level',header=TRUE)
a<-table.element(a,numsignificant1)
a<-table.element(a,numsignificant1/numgqtests)
if (numsignificant1/numgqtests < 0.01) dum <- 'OK' else dum <- 'NOK'
a<-table.element(a,dum)
a<-table.row.end(a)
a<-table.row.start(a)
a<-table.element(a,'5% type I error level',header=TRUE)
a<-table.element(a,numsignificant5)
a<-table.element(a,numsignificant5/numgqtests)
if (numsignificant5/numgqtests < 0.05) dum <- 'OK' else dum <- 'NOK'
a<-table.element(a,dum)
a<-table.row.end(a)
a<-table.row.start(a)
a<-table.element(a,'10% type I error level',header=TRUE)
a<-table.element(a,numsignificant10)
a<-table.element(a,numsignificant10/numgqtests)
if (numsignificant10/numgqtests < 0.1) dum <- 'OK' else dum <- 'NOK'
a<-table.element(a,dum)
a<-table.row.end(a)
a<-table.end(a)
table.save(a,file='mytable6.tab')
}