Free Statistics

of Irreproducible Research!

Author's title

Author*The author of this computation has been verified*
R Software Modulerwasp_notchedbox1.wasp
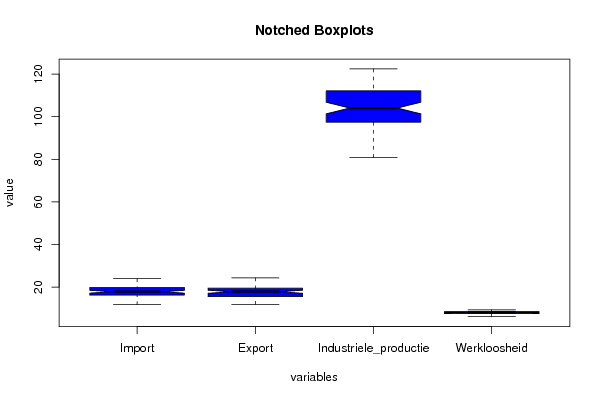
Title produced by softwareNotched Boxplots
Date of computationFri, 13 Nov 2009 07:54:10 -0700
Cite this page as followsStatistical Computations at FreeStatistics.org, Office for Research Development and Education, URL https://freestatistics.org/blog/index.php?v=date/2009/Nov/13/t12581240705s6j92swimwbit4.htm/, Retrieved Sat, 27 Apr 2024 03:21:49 +0000
Statistical Computations at FreeStatistics.org, Office for Research Development and Education, URL https://freestatistics.org/blog/index.php?pk=56742, Retrieved Sat, 27 Apr 2024 03:21:49 +0000
QR Codes:

Original text written by user:
IsPrivate?No (this computation is public)
User-defined keywords
Estimated Impact172
Family? (F = Feedback message, R = changed R code, M = changed R Module, P = changed Parameters, D = changed Data)
F       [Notched Boxplots] [Ws 6 notched boxp...] [2009-11-13 14:54:10] [ba02bcb7e07025bbb7f8a074d38ad767] [Current]
-    D    [Notched Boxplots] [indexatie notched...] [2009-11-16 18:41:39] [cd6314e7e707a6546bd4604c9d1f2b69]
Feedback Forum
2009-11-16 19:32:59 [Joris Van Mol] [reply
Wat hier getoond wordt is niet zo heel erg gedetailleerd, doordat elke reeks zijn eigen waarden heeft moet de y-as in staat zijn zeer veel gegevens te omvatten. Daardoor gaan er details van de notched boxplots verloren omdat ze zo 'ineengedrukt' worden. Het zou kunnen helpen om de gegevens te indexeren (telkens te delen door bijvoorbeeld het eerste getal uit die reeks, en zo gaan we elke waarneming vergelijken met de eerste waarneming van die reeks) Ik heb dit eens geprobeerd op jouw datareeks en heb de grafiek hier geblogd.

http://www.freestatistics.org/blog/index.php?v=date/2009/Nov/16/t1258396961hvvcrwzfqo038a3.htm/

Post a new message
Dataseries X:
16.4	18.0	94.3	6.9
17.8	19.6	99.4	6.6
22.3	23.3	115.7	6.9
22.8	23.7	116.8	7.5
18.3	20.3	99.8	7.9
22.4	22.8	96.0	7.7
23.9	24.3	115.9	6.5
21.3	21.5	109.1	6.1
23.0	23.5	117.3	6.4
21.4	22.2	109.8	6.8
21.2	20.9	112.8	7.1
20.9	22.2	110.7	7.3
17.9	19.5	100.0	7.2
20.7	21.1	113.3	7.0
22.2	22.0	122.4	7.0
19.8	19.2	112.5	7.0
17.7	17.8	104.2	7.3
19.6	19.2	92.5	7.5
20.8	19.9	117.2	7.2
19.8	19.6	109.3	7.7
18.6	18.1	106.1	8.0
21.	20.4	118.8	7.9
18.6	18.1	105.3	8.0
18.9	18.6	106.0	8.0
17.3	17.6	102.0	7.9
20.0	19.4	112.9	7.9
19.9	19.3	116.5	8.8
19.5	18.6	114.8	8.1
16.2	16.9	100.5	8.1
17.6	16.4	85.4	8.2
19.8	19.0	86.6	8.0
19.4	18.7	109.9	8.3
17.2	17.1	100.7	8.5
21.1	21.5	115.5	8.6
17.8	17.8	100.7	8.7
17.5	18.1	99.0	8.7
18.0	19.0	102.3	8.5
19.1	18.9	108.8	8.4
17.7	16.8	105.9	8.5
19.2	18.1	113.2	8.7
15.1	15.7	95.7	8.7
16.3	15.1	80.9	8.6
18.6	18.3	113.9	7.9
17.2	16.5	98.1	8.1
17.8	16.9	102.8	8.2
19.1	18.4	104.7	8.5
16.6	16.4	95.9	8.6
16.0	15.7	94.6	8.5
16.7	16.9	101.6	8.3
17.4	16.6	103.9	8.2
17.9	16.7	110.3	8.7
17.8	16.6	114.1	9.3
13.9	14.4	96.8	9.3
15.9	14.5	87.4	8.8
17.9	17.5	111.4	7.4
15.4	14.3	97.4	7.2
16.4	15.4	102.9	7.5
17.9	17.2	112.7	8.3
15.3	14.6	97.0	8.8
14.6	14.2	95.1	8.9
14.9	14.9	96.9	8.6
15.0	14.1	98.6	8.4
16.7	15.6	111.7	8.4
16.3	14.6	109.8	8.4
11.7	11.9	89.9	8.4
15.1	13.5	87.4	8.3
15.5	14.2	104.5	7.6
15.0	13.7	98.1	7.6
15.4	14.4	102.7	7.9
16.0	15.3	105.4	8.0
14.7	14.3	97.0	8.2
14.8	14.5	97.4	8.3


Summary of computational transaction
Raw Inputview raw input (R code)
Raw Outputview raw output of R engine
Computing time1 seconds
R Server'Gwilym Jenkins' @ 72.249.127.135

\begin{tabular}{lllllllll}
\hline
Summary of computational transaction \tabularnewline
Raw Input & view raw input (R code)  \tabularnewline
Raw Output & view raw output of R engine  \tabularnewline
Computing time & 1 seconds \tabularnewline
R Server & 'Gwilym Jenkins' @ 72.249.127.135 \tabularnewline
\hline
\end{tabular}
%Source: https://freestatistics.org/blog/index.php?pk=56742&T=0

[TABLE]
[ROW][C]Summary of computational transaction[/C][/ROW]
[ROW][C]Raw Input[/C][C]view raw input (R code) [/C][/ROW]
[ROW][C]Raw Output[/C][C]view raw output of R engine [/C][/ROW]
[ROW][C]Computing time[/C][C]1 seconds[/C][/ROW]
[ROW][C]R Server[/C][C]'Gwilym Jenkins' @ 72.249.127.135[/C][/ROW]
[/TABLE]
Source: https://freestatistics.org/blog/index.php?pk=56742&T=0

Globally Unique Identifier (entire table): ba.freestatistics.org/blog/index.php?pk=56742&T=0

As an alternative you can also use a QR Code:  

The GUIDs for individual cells are displayed in the table below:

Summary of computational transaction
Raw Inputview raw input (R code)
Raw Outputview raw output of R engine
Computing time1 seconds
R Server'Gwilym Jenkins' @ 72.249.127.135


Boxplot statistics
Variablelower whiskerlower hingemedianupper hingeupper whisker
Import11.716.2517.819.823.9
Export11.915.517.819.4524.3
Industriele_productie80.997.4104.05112.1122.4
Werkloosheid6.17.58.18.59.3

\begin{tabular}{lllllllll}
\hline
Boxplot statistics \tabularnewline
Variable & lower whisker & lower hinge & median & upper hinge & upper whisker \tabularnewline
Import & 11.7 & 16.25 & 17.8 & 19.8 & 23.9 \tabularnewline
Export & 11.9 & 15.5 & 17.8 & 19.45 & 24.3 \tabularnewline
Industriele_productie & 80.9 & 97.4 & 104.05 & 112.1 & 122.4 \tabularnewline
Werkloosheid & 6.1 & 7.5 & 8.1 & 8.5 & 9.3 \tabularnewline
\hline
\end{tabular}
%Source: https://freestatistics.org/blog/index.php?pk=56742&T=1

[TABLE]
[ROW][C]Boxplot statistics[/C][/ROW]
[ROW][C]Variable[/C][C]lower whisker[/C][C]lower hinge[/C][C]median[/C][C]upper hinge[/C][C]upper whisker[/C][/ROW]
[ROW][C]Import[/C][C]11.7[/C][C]16.25[/C][C]17.8[/C][C]19.8[/C][C]23.9[/C][/ROW]
[ROW][C]Export[/C][C]11.9[/C][C]15.5[/C][C]17.8[/C][C]19.45[/C][C]24.3[/C][/ROW]
[ROW][C]Industriele_productie[/C][C]80.9[/C][C]97.4[/C][C]104.05[/C][C]112.1[/C][C]122.4[/C][/ROW]
[ROW][C]Werkloosheid[/C][C]6.1[/C][C]7.5[/C][C]8.1[/C][C]8.5[/C][C]9.3[/C][/ROW]
[/TABLE]
Source: https://freestatistics.org/blog/index.php?pk=56742&T=1

Globally Unique Identifier (entire table): ba.freestatistics.org/blog/index.php?pk=56742&T=1

As an alternative you can also use a QR Code:  

The GUIDs for individual cells are displayed in the table below:

Boxplot statistics
Variablelower whiskerlower hingemedianupper hingeupper whisker
Import11.716.2517.819.823.9
Export11.915.517.819.4524.3
Industriele_productie80.997.4104.05112.1122.4
Werkloosheid6.17.58.18.59.3


Boxplot Notches
Variablelower boundmedianupper bound
Import17.138973010720817.818.4610269892792
Export17.064491096435817.818.5355089035642
Industriele_productie101.312789650027104.05106.787210349973
Werkloosheid7.913795214287548.18.28620478571246

\begin{tabular}{lllllllll}
\hline
Boxplot Notches \tabularnewline
Variable & lower bound & median & upper bound \tabularnewline
Import & 17.1389730107208 & 17.8 & 18.4610269892792 \tabularnewline
Export & 17.0644910964358 & 17.8 & 18.5355089035642 \tabularnewline
Industriele_productie & 101.312789650027 & 104.05 & 106.787210349973 \tabularnewline
Werkloosheid & 7.91379521428754 & 8.1 & 8.28620478571246 \tabularnewline
\hline
\end{tabular}
%Source: https://freestatistics.org/blog/index.php?pk=56742&T=2

[TABLE]
[ROW][C]Boxplot Notches[/C][/ROW]
[ROW][C]Variable[/C][C]lower bound[/C][C]median[/C][C]upper bound[/C][/ROW]
[ROW][C]Import[/C][C]17.1389730107208[/C][C]17.8[/C][C]18.4610269892792[/C][/ROW]
[ROW][C]Export[/C][C]17.0644910964358[/C][C]17.8[/C][C]18.5355089035642[/C][/ROW]
[ROW][C]Industriele_productie[/C][C]101.312789650027[/C][C]104.05[/C][C]106.787210349973[/C][/ROW]
[ROW][C]Werkloosheid[/C][C]7.91379521428754[/C][C]8.1[/C][C]8.28620478571246[/C][/ROW]
[/TABLE]
Source: https://freestatistics.org/blog/index.php?pk=56742&T=2

Globally Unique Identifier (entire table): ba.freestatistics.org/blog/index.php?pk=56742&T=2

As an alternative you can also use a QR Code:  

The GUIDs for individual cells are displayed in the table below:

Boxplot Notches
Variablelower boundmedianupper bound
Import17.138973010720817.818.4610269892792
Export17.064491096435817.818.5355089035642
Industriele_productie101.312789650027104.05106.787210349973
Werkloosheid7.913795214287548.18.28620478571246


Parameters (Session):
par1 = blue ;
Parameters (R input):
par1 = blue ;
R code (references can be found in the software module):
z <- as.data.frame(t(y))
bitmap(file='test1.png')
(r<-boxplot(z ,xlab=xlab,ylab=ylab,main=main,notch=TRUE,col=par1))
dev.off()
load(file='createtable')
a<-table.start()
a<-table.row.start(a)
a<-table.element(a,hyperlink('overview.htm','Boxplot statistics','Boxplot overview'),6,TRUE)
a<-table.row.end(a)
a<-table.row.start(a)
a<-table.element(a,'Variable',1,TRUE)
a<-table.element(a,hyperlink('lower_whisker.htm','lower whisker','definition of lower whisker'),1,TRUE)
a<-table.element(a,hyperlink('lower_hinge.htm','lower hinge','definition of lower hinge'),1,TRUE)
a<-table.element(a,hyperlink('central_tendency.htm','median','definitions about measures of central tendency'),1,TRUE)
a<-table.element(a,hyperlink('upper_hinge.htm','upper hinge','definition of upper hinge'),1,TRUE)
a<-table.element(a,hyperlink('upper_whisker.htm','upper whisker','definition of upper whisker'),1,TRUE)
a<-table.row.end(a)
for (i in 1:length(y[,1]))
{
a<-table.row.start(a)
a<-table.element(a,dimnames(t(x))[[2]][i],1,TRUE)
for (j in 1:5)
{
a<-table.element(a,r$stats[j,i])
}
a<-table.row.end(a)
}
a<-table.end(a)
table.save(a,file='mytable.tab')
a<-table.start()
a<-table.row.start(a)
a<-table.element(a,'Boxplot Notches',4,TRUE)
a<-table.row.end(a)
a<-table.row.start(a)
a<-table.element(a,'Variable',1,TRUE)
a<-table.element(a,'lower bound',1,TRUE)
a<-table.element(a,'median',1,TRUE)
a<-table.element(a,'upper bound',1,TRUE)
a<-table.row.end(a)
for (i in 1:length(y[,1]))
{
a<-table.row.start(a)
a<-table.element(a,dimnames(t(x))[[2]][i],1,TRUE)
a<-table.element(a,r$conf[1,i])
a<-table.element(a,r$stats[3,i])
a<-table.element(a,r$conf[2,i])
a<-table.row.end(a)
}
a<-table.end(a)
table.save(a,file='mytable1.tab')