Free Statistics
of Irreproducible Research!
Description of Statistical Computation | |||||||||||||||||||||
|---|---|---|---|---|---|---|---|---|---|---|---|---|---|---|---|---|---|---|---|---|---|
| Author's title | |||||||||||||||||||||
| Author | *The author of this computation has been verified* | ||||||||||||||||||||
| R Software Module | rwasp_backtobackhist.wasp | ||||||||||||||||||||
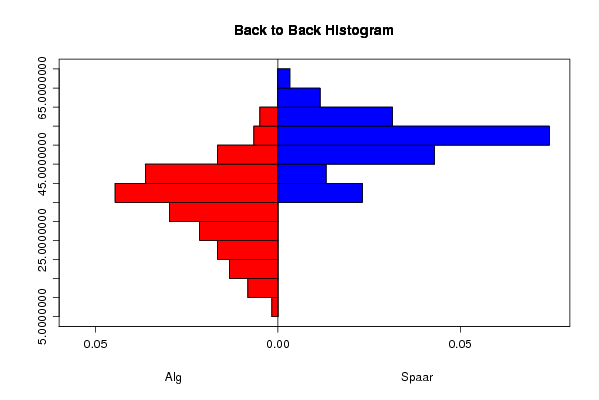
| Title produced by software | Back to Back Histogram | ||||||||||||||||||||
| Date of computation | Fri, 13 Nov 2009 07:11:47 -0700 | ||||||||||||||||||||
| Cite this page as follows | Statistical Computations at FreeStatistics.org, Office for Research Development and Education, URL https://freestatistics.org/blog/index.php?v=date/2009/Nov/13/t1258121561ad26pt3r5crtteu.htm/, Retrieved Thu, 21 May 2026 08:38:23 +0000 | ||||||||||||||||||||
| Statistical Computations at FreeStatistics.org, Office for Research Development and Education, URL https://freestatistics.org/blog/index.php?pk=56658, Retrieved Thu, 21 May 2026 08:38:23 +0000 | |||||||||||||||||||||
| QR Codes: | |||||||||||||||||||||
|
| |||||||||||||||||||||
| Original text written by user: | |||||||||||||||||||||
| IsPrivate? | No (this computation is public) | ||||||||||||||||||||
| User-defined keywords | Algemene economie Spaarvermogen vd gezinnen | ||||||||||||||||||||
| Estimated Impact | 446 | ||||||||||||||||||||
Tree of Dependent Computations | |||||||||||||||||||||
| Family? (F = Feedback message, R = changed R code, M = changed R Module, P = changed Parameters, D = changed Data) | |||||||||||||||||||||
| - [Back to Back Histogram] [3/11/2009] [2009-11-02 21:58:53] [b98453cac15ba1066b407e146608df68] - PD [Back to Back Histogram] [WS 6: BiHistogram 1] [2009-11-09 12:15:56] [74be16979710d4c4e7c6647856088456] - PD [Back to Back Histogram] [Workshop 6] [2009-11-13 14:11:47] [0bdf648420800d03e6dbfbd39fe2311c] [Current] | |||||||||||||||||||||
| Feedback Forum | |||||||||||||||||||||
Post a new message | |||||||||||||||||||||
Dataset | |||||||||||||||||||||
| Dataseries X: | |||||||||||||||||||||
33 39 45 46 45 45 49 50 54 59 58 56 48 50 52 53 55 43 42 38 41 41 39 34 27 15 14 31 41 43 46 42 45 45 40 35 36 38 39 32 24 21 12 29 36 31 28 30 38 27 40 40 44 47 45 42 38 46 37 41 40 33 34 36 36 38 42 35 25 24 22 27 17 30 30 34 37 36 33 33 33 37 40 35 37 43 42 33 39 40 37 44 42 43 40 30 30 31 18 24 22 26 28 23 17 12 9 19 21 18 18 15 24 18 19 30 33 35 36 47 46 | |||||||||||||||||||||
| Dataseries Y: | |||||||||||||||||||||
62 64 62 64 64 69 69 65 56 58 53 62 55 60 59 58 53 57 57 53 54 53 57 57 55 49 50 49 54 58 58 52 56 52 59 53 52 53 51 50 56 52 46 48 46 48 48 49 53 48 51 48 50 55 52 53 52 55 53 53 56 54 52 55 54 59 56 56 51 53 52 51 46 49 46 55 57 53 52 53 50 54 53 50 51 52 47 51 49 53 52 45 53 51 48 48 48 48 40 43 40 39 39 36 41 39 40 39 46 40 37 37 44 41 40 36 38 43 42 45 46 | |||||||||||||||||||||
Tables (Output of Computation) | |||||||||||||||||||||
| |||||||||||||||||||||
Figures (Output of Computation) | |||||||||||||||||||||
Input Parameters & R Code | |||||||||||||||||||||
| Parameters (Session): | |||||||||||||||||||||
| par1 = red ; par2 = blue ; par3 = TRUE ; par4 = Alg ; par5 = Spaar ; | |||||||||||||||||||||
| Parameters (R input): | |||||||||||||||||||||
| par1 = red ; par2 = blue ; par3 = TRUE ; par4 = Alg ; par5 = Spaar ; | |||||||||||||||||||||
| R code (references can be found in the software module): | |||||||||||||||||||||
if (par3 == 'TRUE') par3 <- TRUE | |||||||||||||||||||||