Free Statistics
of Irreproducible Research!
Description of Statistical Computation | |||||||||||||||||||||||||||||||||||||||||||||||||||||||||||||||||||||
|---|---|---|---|---|---|---|---|---|---|---|---|---|---|---|---|---|---|---|---|---|---|---|---|---|---|---|---|---|---|---|---|---|---|---|---|---|---|---|---|---|---|---|---|---|---|---|---|---|---|---|---|---|---|---|---|---|---|---|---|---|---|---|---|---|---|---|---|---|---|
| Author's title | |||||||||||||||||||||||||||||||||||||||||||||||||||||||||||||||||||||
| Author | *The author of this computation has been verified* | ||||||||||||||||||||||||||||||||||||||||||||||||||||||||||||||||||||
| R Software Module | rwasp_pairs.wasp | ||||||||||||||||||||||||||||||||||||||||||||||||||||||||||||||||||||
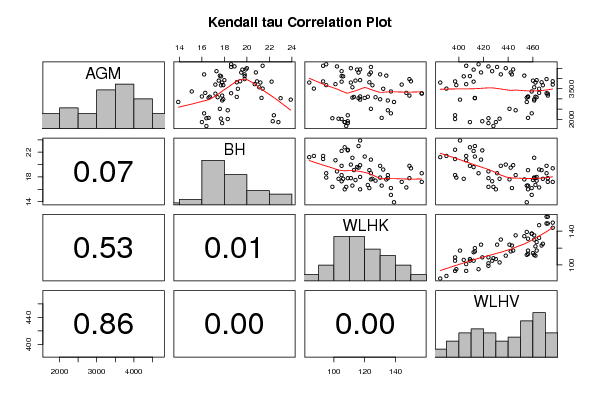
| Title produced by software | Kendall tau Correlation Matrix | ||||||||||||||||||||||||||||||||||||||||||||||||||||||||||||||||||||
| Date of computation | Thu, 12 Nov 2009 09:22:05 -0700 | ||||||||||||||||||||||||||||||||||||||||||||||||||||||||||||||||||||
| Cite this page as follows | Statistical Computations at FreeStatistics.org, Office for Research Development and Education, URL https://freestatistics.org/blog/index.php?v=date/2009/Nov/12/t1258042999n94qyx046odyl4q.htm/, Retrieved Tue, 30 Apr 2024 00:16:01 +0000 | ||||||||||||||||||||||||||||||||||||||||||||||||||||||||||||||||||||
| Statistical Computations at FreeStatistics.org, Office for Research Development and Education, URL https://freestatistics.org/blog/index.php?pk=56195, Retrieved Tue, 30 Apr 2024 00:16:01 +0000 | |||||||||||||||||||||||||||||||||||||||||||||||||||||||||||||||||||||
| QR Codes: | |||||||||||||||||||||||||||||||||||||||||||||||||||||||||||||||||||||
|
| |||||||||||||||||||||||||||||||||||||||||||||||||||||||||||||||||||||
| Original text written by user: | |||||||||||||||||||||||||||||||||||||||||||||||||||||||||||||||||||||
| IsPrivate? | No (this computation is public) | ||||||||||||||||||||||||||||||||||||||||||||||||||||||||||||||||||||
| User-defined keywords | |||||||||||||||||||||||||||||||||||||||||||||||||||||||||||||||||||||
| Estimated Impact | 198 | ||||||||||||||||||||||||||||||||||||||||||||||||||||||||||||||||||||
Tree of Dependent Computations | |||||||||||||||||||||||||||||||||||||||||||||||||||||||||||||||||||||
| Family? (F = Feedback message, R = changed R code, M = changed R Module, P = changed Parameters, D = changed Data) | |||||||||||||||||||||||||||||||||||||||||||||||||||||||||||||||||||||
| - [Kendall tau Correlation Matrix] [] [2009-11-11 17:33:09] [3dc15971be5d84d9752feb46f389e582] - D [Kendall tau Correlation Matrix] [] [2009-11-12 16:22:05] [aa8eb70c35ea8a87edcd21d6427e653e] [Current] | |||||||||||||||||||||||||||||||||||||||||||||||||||||||||||||||||||||
| Feedback Forum | |||||||||||||||||||||||||||||||||||||||||||||||||||||||||||||||||||||
Post a new message | |||||||||||||||||||||||||||||||||||||||||||||||||||||||||||||||||||||
Dataset | |||||||||||||||||||||||||||||||||||||||||||||||||||||||||||||||||||||
| Dataseries X: | |||||||||||||||||||||||||||||||||||||||||||||||||||||||||||||||||||||
2849,27 13,9 139 455 2921,44 17,8 135 461 2981,85 17,9 130 461 3080,58 17,4 127 463 3106,22 16,7 122 462 3119,31 16 117 456 3061,26 16,6 112 455 3097,31 19,1 113 456 3161,69 17,8 149 472 3257,16 17,2 157 472 3277,01 18,6 157 471 3295,32 16,3 147 465 3363,99 15,1 137 459 3494,17 19,2 132 465 3667,03 17,7 125 468 3813,06 19,1 123 467 3917,96 18 117 463 3895,51 17,5 114 460 3801,06 17,8 111 462 3570,12 21,1 112 461 3701,61 17,2 144 476 3862,27 19,4 150 476 3970,1 19,8 149 471 4138,52 17,6 134 453 4199,75 16,2 123 443 4290,89 19,5 116 442 4443,91 19,9 117 444 4502,64 20 111 438 4356,98 17,3 105 427 4591,27 18,9 102 424 4696,96 18,6 95 416 4621,4 21,4 93 406 4562,84 18,6 124 431 4202,52 19,8 130 434 4296,49 20,8 124 418 4435,23 19,6 115 412 4105,18 17,7 106 404 4116,68 19,8 105 409 3844,49 22,2 105 412 3720,98 20,7 101 406 3674,4 17,9 95 398 3857,62 20,9 93 397 3801,06 21,2 84 385 3504,37 21,4 87 390 3032,6 23 116 413 3047,03 21,3 120 413 2962,34 23,9 117 401 2197,82 22,4 109 397 2014,45 18,3 105 397 1862,83 22,8 107 409 1905,41 22,3 109 419 1810,99 17,8 109 424 1670,07 16,4 108 428 1864,44 16 107 430 2052,02 16,4 99 424 2029,6 17,7 103 433 2070,83 16,6 131 456 2293,41 16,2 137 459 2443,27 18,3 135 446 2513,17 17,6 124 441 | |||||||||||||||||||||||||||||||||||||||||||||||||||||||||||||||||||||
Tables (Output of Computation) | |||||||||||||||||||||||||||||||||||||||||||||||||||||||||||||||||||||
| |||||||||||||||||||||||||||||||||||||||||||||||||||||||||||||||||||||
Figures (Output of Computation) | |||||||||||||||||||||||||||||||||||||||||||||||||||||||||||||||||||||
Input Parameters & R Code | |||||||||||||||||||||||||||||||||||||||||||||||||||||||||||||||||||||
| Parameters (Session): | |||||||||||||||||||||||||||||||||||||||||||||||||||||||||||||||||||||
| Parameters (R input): | |||||||||||||||||||||||||||||||||||||||||||||||||||||||||||||||||||||
| R code (references can be found in the software module): | |||||||||||||||||||||||||||||||||||||||||||||||||||||||||||||||||||||
panel.tau <- function(x, y, digits=2, prefix='', cex.cor) | |||||||||||||||||||||||||||||||||||||||||||||||||||||||||||||||||||||