transformatie | ||||||||||||||||||||||||||||||||||||||||||||||||
| *The author of this computation has been verified* | ||||||||||||||||||||||||||||||||||||||||||||||||
| R Software Module: /rwasp_boxcoxnorm.wasp (opens new window with default values) | ||||||||||||||||||||||||||||||||||||||||||||||||
| Title produced by software: Box-Cox Normality Plot | ||||||||||||||||||||||||||||||||||||||||||||||||
| Date of computation: Mon, 09 Nov 2009 13:19:37 -0700 | ||||||||||||||||||||||||||||||||||||||||||||||||
| Cite this page as follows: | ||||||||||||||||||||||||||||||||||||||||||||||||
| Statistical Computations at FreeStatistics.org, Office for Research Development and Education, URL http://www.freestatistics.org/blog/date/2009/Nov/09/t1257798166d4gbdcff6acs5vo.htm/, Retrieved Mon, 09 Nov 2009 21:22:46 +0100 | ||||||||||||||||||||||||||||||||||||||||||||||||
| BibTeX entries for LaTeX users: | ||||||||||||||||||||||||||||||||||||||||||||||||
@Manual{KEY,
    author = {{YOUR NAME}},
    publisher = {Office for Research Development and Education},
    title = {Statistical Computations at FreeStatistics.org, URL http://www.freestatistics.org/blog/date/2009/Nov/09/t1257798166d4gbdcff6acs5vo.htm/},
    year = {2009},
}
@Manual{R,
    title = {R: A Language and Environment for Statistical Computing},
    author = {{R Development Core Team}},
    organization = {R Foundation for Statistical Computing},
    address = {Vienna, Austria},
    year = {2009},
    note = {{ISBN} 3-900051-07-0},
    url = {http://www.R-project.org},
}
| ||||||||||||||||||||||||||||||||||||||||||||||||
| Original text written by user: | ||||||||||||||||||||||||||||||||||||||||||||||||
| IsPrivate? | ||||||||||||||||||||||||||||||||||||||||||||||||
| No (this computation is public) | ||||||||||||||||||||||||||||||||||||||||||||||||
| User-defined keywords: | ||||||||||||||||||||||||||||||||||||||||||||||||
| Dataseries X: | ||||||||||||||||||||||||||||||||||||||||||||||||
| » Textbox « » Textfile « » CSV « | ||||||||||||||||||||||||||||||||||||||||||||||||
| 17,44882829 17,23968844 16,87169003 16,58114384 16,78103959 16,85529767 16,72365849 16,90960919 17,08723243 17,49037894 17,59188103 17,39123937 17,41919121 17,60948541 17,79564686 17,73817793 17,53934061 17,67148503 17,60548217 17,40753605 17,03135891 17,11980342 17,09461945 17,00142777 17,06290921 17,1488191 16,95065029 16,71530576 16,86598269 16,81276027 16,69517287 16,5080894 16,51145508 16,573667 16,37506628 16,43722584 16,25778915 16,04792594 15,76984363 15,83799935 15,74967365 15,73193313 15,28927402 15,16807022 15,27289001 15,27508076 15,15790652 15,59941332 15,95949348 16,63995622 17,05923948 16,55331321 16,6972516 17,02040019 16,82974618 16,73132794 16,41864159 16,18084481 16,13515788 16,02243489 | ||||||||||||||||||||||||||||||||||||||||||||||||
| Output produced by software: | ||||||||||||||||||||||||||||||||||||||||||||||||
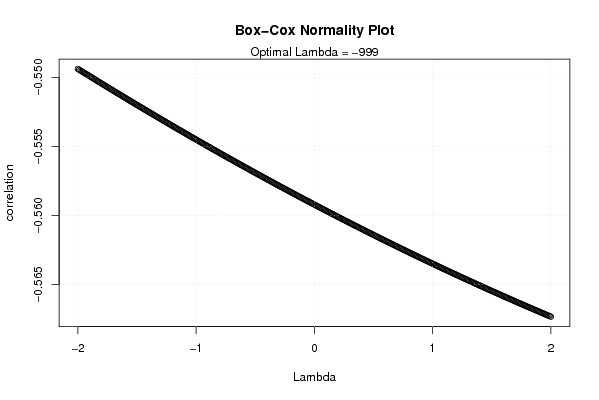
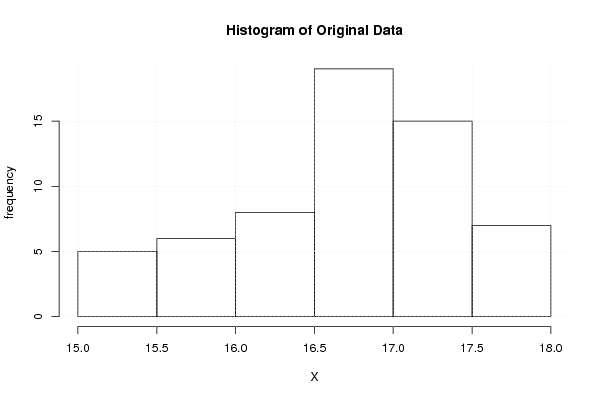
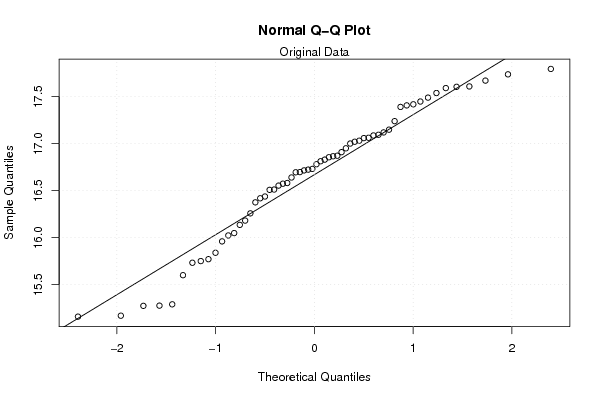
| Charts produced by software: |
| Parameters (Session): | | Parameters (R input): | | R code (references can be found in the software module): | n <- length(x)
| c <- array(NA,dim=c(401)) l <- array(NA,dim=c(401)) mx <- 0 mxli <- -999 for (i in 1:401) { l[i] <- (i-201)/100 if (l[i] != 0) { x1 <- (x^l[i] - 1) / l[i] } else { x1 <- log(x) } c[i] <- cor(qnorm(ppoints(x), mean=0, sd=1),x1) if (mx < c[i]) { mx <- c[i] mxli <- l[i] } } c mx mxli if (mxli != 0) { x1 <- (x^mxli - 1) / mxli } else { x1 <- log(x) } bitmap(file='test1.png') plot(l,c,main='Box-Cox Normality Plot',xlab='Lambda',ylab='correlation') mtext(paste('Optimal Lambda =',mxli)) grid() dev.off() bitmap(file='test2.png') hist(x,main='Histogram of Original Data',xlab='X',ylab='frequency') grid() dev.off() bitmap(file='test3.png') hist(x1,main='Histogram of Transformed Data',xlab='X',ylab='frequency') grid() dev.off() bitmap(file='test4.png') qqnorm(x) qqline(x) grid() mtext('Original Data') dev.off() bitmap(file='test5.png') qqnorm(x1) qqline(x1) grid() mtext('Transformed Data') dev.off() load(file='createtable') a<-table.start() a<-table.row.start(a) a<-table.element(a,'Box-Cox Normality Plot',2,TRUE) a<-table.row.end(a) a<-table.row.start(a) a<-table.element(a,'# observations x',header=TRUE) a<-table.element(a,n) a<-table.row.end(a) a<-table.row.start(a) a<-table.element(a,'maximum correlation',header=TRUE) a<-table.element(a,mx) a<-table.row.end(a) a<-table.row.start(a) a<-table.element(a,'optimal lambda',header=TRUE) a<-table.element(a,mxli) a<-table.row.end(a) a<-table.end(a) table.save(a,file='mytable.tab') | Copyright
Software written by Ed van Stee & Patrick Wessa Disclaimer Information provided on this web site is provided "AS IS" without warranty of any kind, either express or implied, including, without limitation, warranties of merchantability, fitness for a particular purpose, and noninfringement. We use reasonable efforts to include accurate and timely information and periodically update the information, and software without notice. However, we make no warranties or representations as to the accuracy or completeness of such information (or software), and we assume no liability or responsibility for errors or omissions in the content of this web site, or any software bugs in online applications. Your use of this web site is AT YOUR OWN RISK. Under no circumstances and under no legal theory shall we be liable to you or any other person for any direct, indirect, special, incidental, exemplary, or consequential damages arising from your access to, or use of, this web site. Privacy Policy We may request personal information to be submitted to our servers in order to be able to:
We NEVER allow other companies to directly offer registered users information about their products and services. Banner references and hyperlinks of third parties NEVER contain any personal data of the visitor. We do NOT sell, nor transmit by any means, personal information, nor statistical data series uploaded by you to third parties.
We store a unique ANONYMOUS USER ID in the form of a small 'Cookie' on your computer. This allows us to track your progress when using this website which is necessary to create state-dependent features. The cookie is used for NO OTHER PURPOSE. At any time you may opt to disallow cookies from this website - this will not affect other features of this website. We examine cookies that are used by third-parties (banner and online ads) very closely: abuse from third-parties automatically results in termination of the advertising contract without refund. We have very good reason to believe that the cookies that are produced by third parties (banner ads) do NOT cause any privacy or security risk. FreeStatistics.org is safe. There is no need to download any software to use the applications and services contained in this website. Hence, your system's security is not compromised by their use, and your personal data - other than data you submit in the account application form, and the user-agent information that is transmitted by your browser - is never transmitted to our servers. As a general rule, we do not log on-line behavior of individuals (other than normal logging of webserver 'hits'). However, in cases of abuse, hacking, unauthorized access, Denial of Service attacks, illegal copying, hotlinking, non-compliance with international webstandards (such as robots.txt), or any other harmful behavior, our system engineers are empowered to log, track, identify, publish, and ban misbehaving individuals - even if this leads to ban entire blocks of IP addresses, or disclosing user's identity. | ||||||||||||||||||||||||||||||||||||||