Ws 5 | ||||||||||||||||||||||||||||||||||||||||||||||||||||||||||||
| *The author of this computation has been verified* | ||||||||||||||||||||||||||||||||||||||||||||||||||||||||||||
| R Software Module: /rwasp_edauni.wasp (opens new window with default values) | ||||||||||||||||||||||||||||||||||||||||||||||||||||||||||||
| Title produced by software: Univariate Explorative Data Analysis | ||||||||||||||||||||||||||||||||||||||||||||||||||||||||||||
| Date of computation: Thu, 05 Nov 2009 04:03:50 -0700 | ||||||||||||||||||||||||||||||||||||||||||||||||||||||||||||
| Cite this page as follows: | ||||||||||||||||||||||||||||||||||||||||||||||||||||||||||||
| Statistical Computations at FreeStatistics.org, Office for Research Development and Education, URL http://www.freestatistics.org/blog/date/2009/Nov/05/t12574191212f3wyqbb053f49h.htm/, Retrieved Thu, 05 Nov 2009 12:05:29 +0100 | ||||||||||||||||||||||||||||||||||||||||||||||||||||||||||||
| BibTeX entries for LaTeX users: | ||||||||||||||||||||||||||||||||||||||||||||||||||||||||||||
@Manual{KEY,
    author = {{YOUR NAME}},
    publisher = {Office for Research Development and Education},
    title = {Statistical Computations at FreeStatistics.org, URL http://www.freestatistics.org/blog/date/2009/Nov/05/t12574191212f3wyqbb053f49h.htm/},
    year = {2009},
}
@Manual{R,
    title = {R: A Language and Environment for Statistical Computing},
    author = {{R Development Core Team}},
    organization = {R Foundation for Statistical Computing},
    address = {Vienna, Austria},
    year = {2009},
    note = {{ISBN} 3-900051-07-0},
    url = {http://www.R-project.org},
}
| ||||||||||||||||||||||||||||||||||||||||||||||||||||||||||||
| Original text written by user: | ||||||||||||||||||||||||||||||||||||||||||||||||||||||||||||
| IsPrivate? | ||||||||||||||||||||||||||||||||||||||||||||||||||||||||||||
| No (this computation is public) | ||||||||||||||||||||||||||||||||||||||||||||||||||||||||||||
| User-defined keywords: | ||||||||||||||||||||||||||||||||||||||||||||||||||||||||||||
| Y en Z en et | ||||||||||||||||||||||||||||||||||||||||||||||||||||||||||||
| Dataseries X: | ||||||||||||||||||||||||||||||||||||||||||||||||||||||||||||
| » Textbox « » Textfile « » CSV « | ||||||||||||||||||||||||||||||||||||||||||||||||||||||||||||
| -10,513 -8,513 -17,783 -12,875 -18,691 -18,053 -20,961 -29,323 -44,139 -42,139 -42,777 -36,685 -39,323 -43,047 -42,593 -49,409 -47,139 -27,145 -25,691 -20,967 -15,605 -19,513 -14,059 -2,427 7,205 30,285 56,003 20,107 13,475 10,205 10,205 2,751 6,751 5,659 24,291 11,021 10,021 11,021 11,929 24,015 32,923 36,193 37,463 29,285 28,739 30,739 38,009 28,831 24,107 49,641 30,831 23,469 16,745 20,291 20,199 25,561 26,015 14,475 16,837 12,475 18,383 29,469 26,015 30,469 28,015 31,561 21,291 21,291 33,739 34,285 31,831 25,015 18,561 18,653 18,561 21,745 10,659 6,659 15,837 8,113 9,475 7,659 8,113 -7,973 -5,519 -13,243 -16,789 26,469 -4,611 -7,881 -7,427 -26,059 -10,789 -12,789 -12,881 -20,151 -21,605 -27,421 -31,059 -33,875 -33,967 -42,237 -45,145 -36,513 -24,243 -29,151 -16,519 -11,703 -4,703 18,377 38,641 50,273 61,635 65,905 61,997 57,997 58,543 62,089 55,273 46,641 47,641 | ||||||||||||||||||||||||||||||||||||||||||||||||||||||||||||
| Output produced by software: | ||||||||||||||||||||||||||||||||||||||||||||||||||||||||||||
| Charts produced by software: |
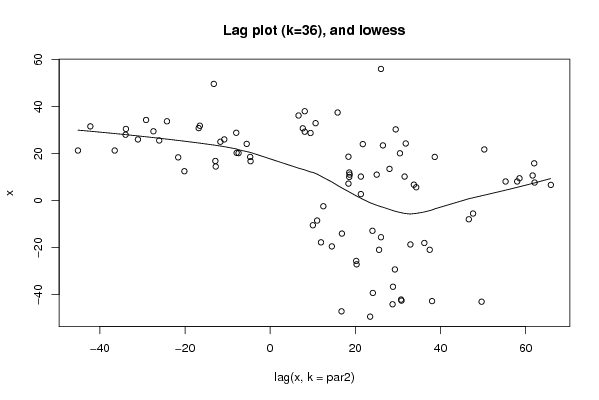
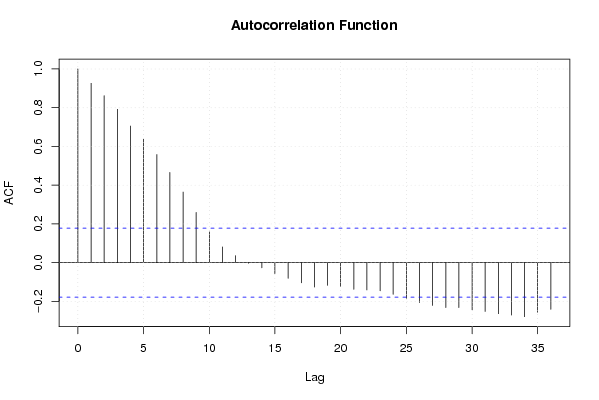
| Parameters (Session): | par1 = 0 ; par2 = 36 ; | | Parameters (R input): | par1 = 0 ; par2 = 36 ; | | R code (references can be found in the software module): | par1 <- as.numeric(par1)
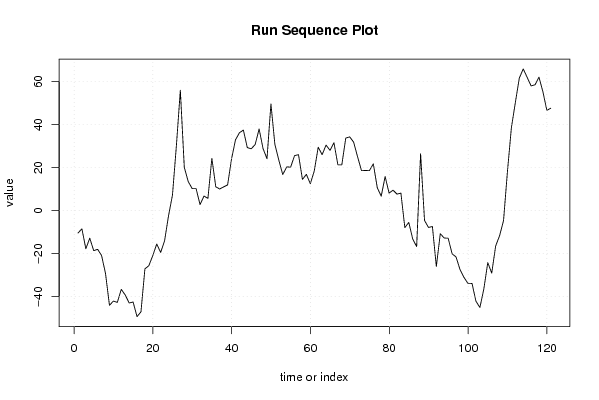
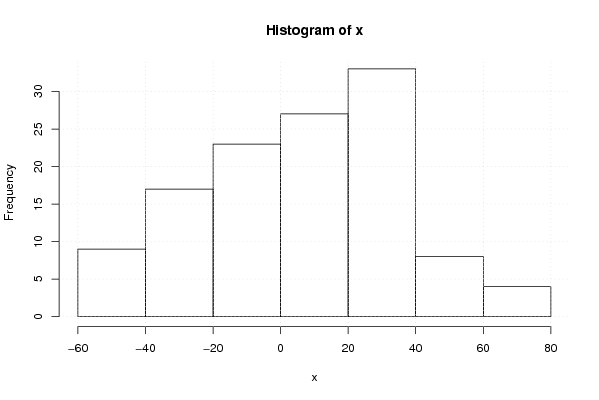
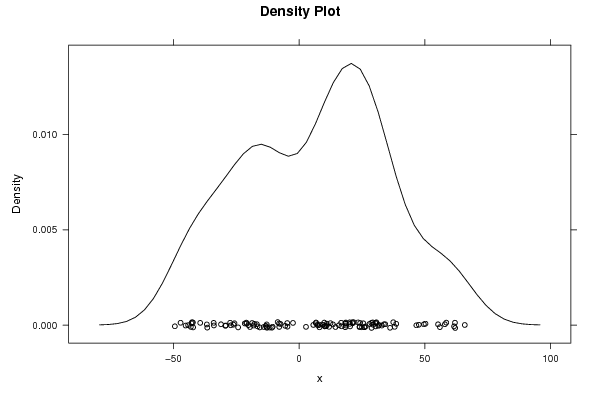
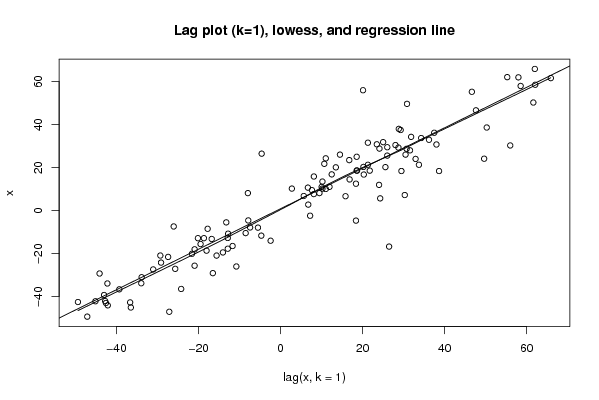
| par2 <- as.numeric(par2) x <- as.ts(x) library(lattice) bitmap(file='pic1.png') plot(x,type='l',main='Run Sequence Plot',xlab='time or index',ylab='value') grid() dev.off() bitmap(file='pic2.png') hist(x) grid() dev.off() bitmap(file='pic3.png') if (par1 > 0) { densityplot(~x,col='black',main=paste('Density Plot bw = ',par1),bw=par1) } else { densityplot(~x,col='black',main='Density Plot') } dev.off() bitmap(file='pic4.png') qqnorm(x) qqline(x) grid() dev.off() if (par2 > 0) { bitmap(file='lagplot1.png') dum <- cbind(lag(x,k=1),x) dum dum1 <- dum[2:length(x),] dum1 z <- as.data.frame(dum1) z plot(z,main='Lag plot (k=1), lowess, and regression line') lines(lowess(z)) abline(lm(z)) dev.off() if (par2 > 1) { bitmap(file='lagplotpar2.png') dum <- cbind(lag(x,k=par2),x) dum dum1 <- dum[(par2+1):length(x),] dum1 z <- as.data.frame(dum1) z mylagtitle <- 'Lag plot (k=' mylagtitle <- paste(mylagtitle,par2,sep='') mylagtitle <- paste(mylagtitle,'), and lowess',sep='') plot(z,main=mylagtitle) lines(lowess(z)) dev.off() } bitmap(file='pic5.png') acf(x,lag.max=par2,main='Autocorrelation Function') grid() dev.off() } summary(x) load(file='createtable') a<-table.start() a<-table.row.start(a) a<-table.element(a,'Descriptive Statistics',2,TRUE) a<-table.row.end(a) a<-table.row.start(a) a<-table.element(a,'# observations',header=TRUE) a<-table.element(a,length(x)) a<-table.row.end(a) a<-table.row.start(a) a<-table.element(a,'minimum',header=TRUE) a<-table.element(a,min(x)) a<-table.row.end(a) a<-table.row.start(a) a<-table.element(a,'Q1',header=TRUE) a<-table.element(a,quantile(x,0.25)) a<-table.row.end(a) a<-table.row.start(a) a<-table.element(a,'median',header=TRUE) a<-table.element(a,median(x)) a<-table.row.end(a) a<-table.row.start(a) a<-table.element(a,'mean',header=TRUE) a<-table.element(a,mean(x)) a<-table.row.end(a) a<-table.row.start(a) a<-table.element(a,'Q3',header=TRUE) a<-table.element(a,quantile(x,0.75)) a<-table.row.end(a) a<-table.row.start(a) a<-table.element(a,'maximum',header=TRUE) a<-table.element(a,max(x)) a<-table.row.end(a) a<-table.end(a) table.save(a,file='mytable.tab') | Copyright
Software written by Ed van Stee & Patrick Wessa Disclaimer Information provided on this web site is provided "AS IS" without warranty of any kind, either express or implied, including, without limitation, warranties of merchantability, fitness for a particular purpose, and noninfringement. We use reasonable efforts to include accurate and timely information and periodically update the information, and software without notice. However, we make no warranties or representations as to the accuracy or completeness of such information (or software), and we assume no liability or responsibility for errors or omissions in the content of this web site, or any software bugs in online applications. Your use of this web site is AT YOUR OWN RISK. Under no circumstances and under no legal theory shall we be liable to you or any other person for any direct, indirect, special, incidental, exemplary, or consequential damages arising from your access to, or use of, this web site. Privacy Policy We may request personal information to be submitted to our servers in order to be able to:
We NEVER allow other companies to directly offer registered users information about their products and services. Banner references and hyperlinks of third parties NEVER contain any personal data of the visitor. We do NOT sell, nor transmit by any means, personal information, nor statistical data series uploaded by you to third parties.
We store a unique ANONYMOUS USER ID in the form of a small 'Cookie' on your computer. This allows us to track your progress when using this website which is necessary to create state-dependent features. The cookie is used for NO OTHER PURPOSE. At any time you may opt to disallow cookies from this website - this will not affect other features of this website. We examine cookies that are used by third-parties (banner and online ads) very closely: abuse from third-parties automatically results in termination of the advertising contract without refund. We have very good reason to believe that the cookies that are produced by third parties (banner ads) do NOT cause any privacy or security risk. FreeStatistics.org is safe. There is no need to download any software to use the applications and services contained in this website. Hence, your system's security is not compromised by their use, and your personal data - other than data you submit in the account application form, and the user-agent information that is transmitted by your browser - is never transmitted to our servers. As a general rule, we do not log on-line behavior of individuals (other than normal logging of webserver 'hits'). However, in cases of abuse, hacking, unauthorized access, Denial of Service attacks, illegal copying, hotlinking, non-compliance with international webstandards (such as robots.txt), or any other harmful behavior, our system engineers are empowered to log, track, identify, publish, and ban misbehaving individuals - even if this leads to ban entire blocks of IP addresses, or disclosing user's identity. | ||||||||||||||||||||||||||||||||||||||||||||||||