| *The author of this computation has been verified* | |||||||||||||||||||||||||||||||||||||||||||||||||||||||||||||||||||||
| R Software Module: /rwasp_edabi.wasp (opens new window with default values) | |||||||||||||||||||||||||||||||||||||||||||||||||||||||||||||||||||||
| Title produced by software: Bivariate Explorative Data Analysis | |||||||||||||||||||||||||||||||||||||||||||||||||||||||||||||||||||||
| Date of computation: Wed, 04 Nov 2009 10:26:42 -0700 | |||||||||||||||||||||||||||||||||||||||||||||||||||||||||||||||||||||
| Cite this page as follows: | |||||||||||||||||||||||||||||||||||||||||||||||||||||||||||||||||||||
| Statistical Computations at FreeStatistics.org, Office for Research Development and Education, URL http://www.freestatistics.org/blog/date/2009/Nov/04/t1257355668a12xrut6m15wz02.htm/, Retrieved Wed, 04 Nov 2009 18:27:48 +0100 | |||||||||||||||||||||||||||||||||||||||||||||||||||||||||||||||||||||
| BibTeX entries for LaTeX users: | |||||||||||||||||||||||||||||||||||||||||||||||||||||||||||||||||||||
@Manual{KEY,
    author = {{YOUR NAME}},
    publisher = {Office for Research Development and Education},
    title = {Statistical Computations at FreeStatistics.org, URL http://www.freestatistics.org/blog/date/2009/Nov/04/t1257355668a12xrut6m15wz02.htm/},
    year = {2009},
}
@Manual{R,
    title = {R: A Language and Environment for Statistical Computing},
    author = {{R Development Core Team}},
    organization = {R Foundation for Statistical Computing},
    address = {Vienna, Austria},
    year = {2009},
    note = {{ISBN} 3-900051-07-0},
    url = {http://www.R-project.org},
}
| |||||||||||||||||||||||||||||||||||||||||||||||||||||||||||||||||||||
| Original text written by user: | |||||||||||||||||||||||||||||||||||||||||||||||||||||||||||||||||||||
| IsPrivate? | |||||||||||||||||||||||||||||||||||||||||||||||||||||||||||||||||||||
| No (this computation is public) | |||||||||||||||||||||||||||||||||||||||||||||||||||||||||||||||||||||
| User-defined keywords: | |||||||||||||||||||||||||||||||||||||||||||||||||||||||||||||||||||||
| shwws5vr1opl7 | |||||||||||||||||||||||||||||||||||||||||||||||||||||||||||||||||||||
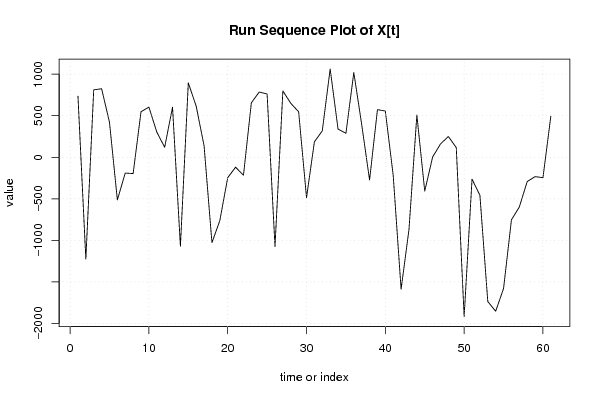
| Dataseries X: | |||||||||||||||||||||||||||||||||||||||||||||||||||||||||||||||||||||
| » Textbox « » Textfile « » CSV « | |||||||||||||||||||||||||||||||||||||||||||||||||||||||||||||||||||||
| 735,07 -1226,348 811,434 824,888 421,362 -513,422 -190,064 -196,224 548,168 603,85 304,79 120,216 602,984 -1070,538 895,432 615,108 140,41 -1028,07 -762,444 -245,956 -119,224 -216,468 655,79 785,424 761,536 -1075,126 798,71 649,59 547,884 -485,194 185,812 317,828 1063,094 339,618 288,61 1020,778 394,24 -273,966 573,402 556,436 -219,1 -1589,666 -868,892 508,342 -407,442 2,922 160,734 249,968 116,214 -1918,548 -262,954 -457,512 -1736,924 -1853,188 -1579,46 -752,802 -598,48 -292,484 -232,932 -245,918 494,592 | |||||||||||||||||||||||||||||||||||||||||||||||||||||||||||||||||||||
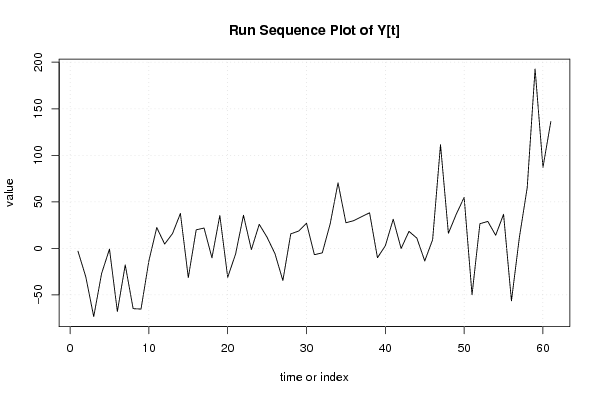
| Dataseries Y: | |||||||||||||||||||||||||||||||||||||||||||||||||||||||||||||||||||||
| » Textbox « » Textfile « » CSV « | |||||||||||||||||||||||||||||||||||||||||||||||||||||||||||||||||||||
| -3,041 -30,8449 -73,4388 -27,0621 -0,7944 -67,9576 -17,8417 -64,8297 -65,2931 -13,417 22,335 4,5873 15,8937 37,4506 -31,5559 19,8439 21,801 -10,213 35,3443 -31,1783 -6,1197 35,5541 -1,42 25,7907 11,8533 -5,8368 -34,609 15,54 18,5837 27,0118 -6,8619 -4,8801 26,2342 70,4244 27,461 29,7524 34,0675 38,1812 -10,1124 2,7433 31,2555 -0,2038 18,2439 10,9496 -13,5786 9,2486 111,4112 16,1069 36,6952 54,7651 -49,9012 26,4429 28,9053 14,0231 36,6025 -56,4916 11,3715 65,1273 192,7919 87,0766 136,3671 | |||||||||||||||||||||||||||||||||||||||||||||||||||||||||||||||||||||
| Output produced by software: | |||||||||||||||||||||||||||||||||||||||||||||||||||||||||||||||||||||
| Charts produced by software: |
| Parameters (Session): | par1 = 0 ; par2 = 36 ; | | Parameters (R input): | par1 = 0 ; par2 = 36 ; | | R code (references can be found in the software module): | par1 <- as.numeric(par1)
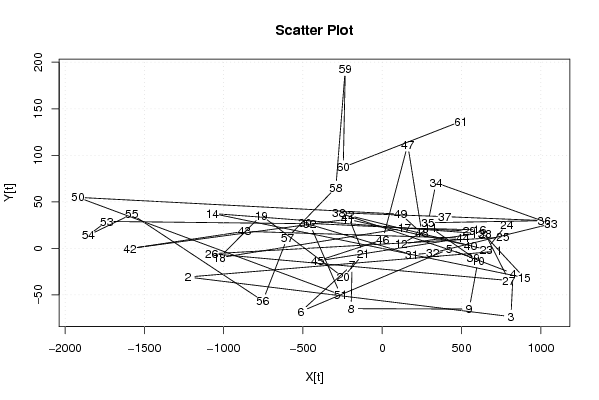
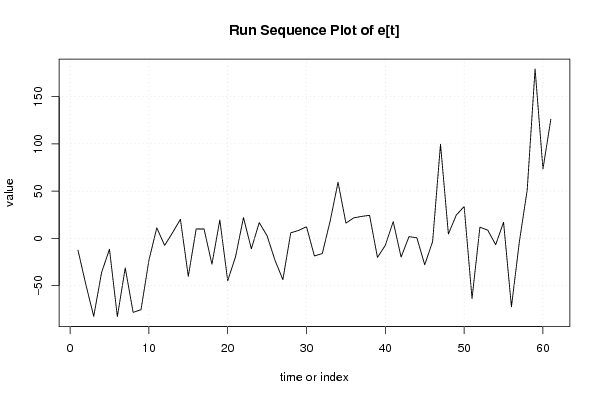
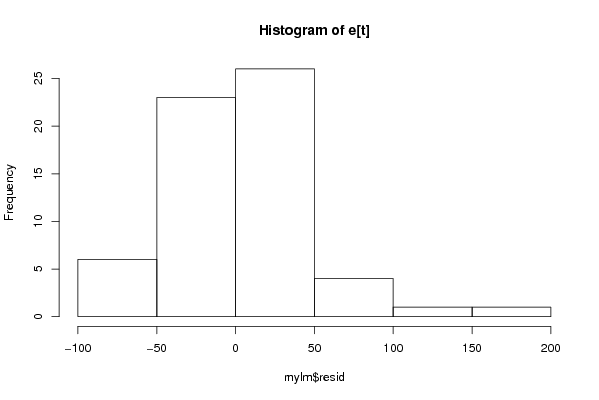
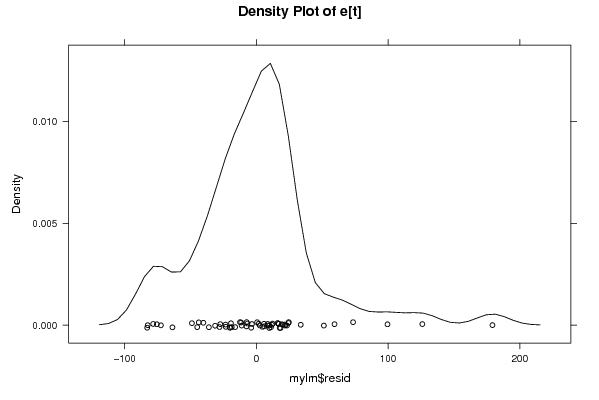
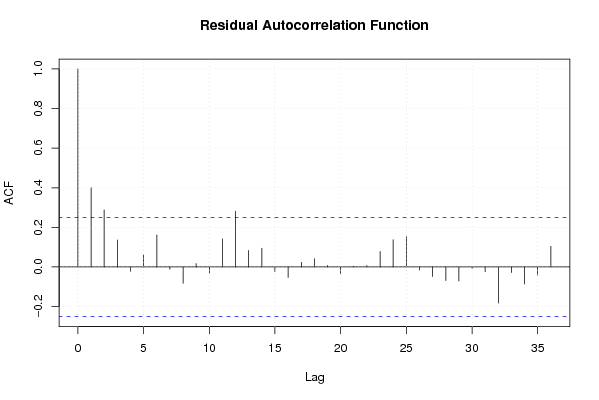
| par2 <- as.numeric(par2) x <- as.ts(x) y <- as.ts(y) mylm <- lm(y~x) cbind(mylm$resid) library(lattice) bitmap(file='pic1.png') plot(y,type='l',main='Run Sequence Plot of Y[t]',xlab='time or index',ylab='value') grid() dev.off() bitmap(file='pic1a.png') plot(x,type='l',main='Run Sequence Plot of X[t]',xlab='time or index',ylab='value') grid() dev.off() bitmap(file='pic1b.png') plot(x,y,main='Scatter Plot',xlab='X[t]',ylab='Y[t]') grid() dev.off() bitmap(file='pic1c.png') plot(mylm$resid,type='l',main='Run Sequence Plot of e[t]',xlab='time or index',ylab='value') grid() dev.off() bitmap(file='pic2.png') hist(mylm$resid,main='Histogram of e[t]') dev.off() bitmap(file='pic3.png') if (par1 > 0) { densityplot(~mylm$resid,col='black',main=paste('Density Plot of e[t] bw = ',par1),bw=par1) } else { densityplot(~mylm$resid,col='black',main='Density Plot of e[t]') } dev.off() bitmap(file='pic4.png') qqnorm(mylm$resid,main='QQ plot of e[t]') qqline(mylm$resid) grid() dev.off() if (par2 > 0) { bitmap(file='pic5.png') acf(mylm$resid,lag.max=par2,main='Residual Autocorrelation Function') grid() dev.off() } summary(x) load(file='createtable') a<-table.start() a<-table.row.start(a) a<-table.element(a,'Model: Y[t] = c + b X[t] + e[t]',2,TRUE) a<-table.row.end(a) a<-table.row.start(a) a<-table.element(a,'c',1,TRUE) a<-table.element(a,mylm$coeff[[1]]) a<-table.row.end(a) a<-table.row.start(a) a<-table.element(a,'b',1,TRUE) a<-table.element(a,mylm$coeff[[2]]) a<-table.row.end(a) a<-table.end(a) table.save(a,file='mytable.tab') a<-table.start() a<-table.row.start(a) a<-table.element(a,'Descriptive Statistics about e[t]',2,TRUE) a<-table.row.end(a) a<-table.row.start(a) a<-table.element(a,'# observations',header=TRUE) a<-table.element(a,length(mylm$resid)) a<-table.row.end(a) a<-table.row.start(a) a<-table.element(a,'minimum',header=TRUE) a<-table.element(a,min(mylm$resid)) a<-table.row.end(a) a<-table.row.start(a) a<-table.element(a,'Q1',header=TRUE) a<-table.element(a,quantile(mylm$resid,0.25)) a<-table.row.end(a) a<-table.row.start(a) a<-table.element(a,'median',header=TRUE) a<-table.element(a,median(mylm$resid)) a<-table.row.end(a) a<-table.row.start(a) a<-table.element(a,'mean',header=TRUE) a<-table.element(a,mean(mylm$resid)) a<-table.row.end(a) a<-table.row.start(a) a<-table.element(a,'Q3',header=TRUE) a<-table.element(a,quantile(mylm$resid,0.75)) a<-table.row.end(a) a<-table.row.start(a) a<-table.element(a,'maximum',header=TRUE) a<-table.element(a,max(mylm$resid)) a<-table.row.end(a) a<-table.end(a) table.save(a,file='mytable.tab') | Copyright
Software written by Ed van Stee & Patrick Wessa Disclaimer Information provided on this web site is provided "AS IS" without warranty of any kind, either express or implied, including, without limitation, warranties of merchantability, fitness for a particular purpose, and noninfringement. We use reasonable efforts to include accurate and timely information and periodically update the information, and software without notice. However, we make no warranties or representations as to the accuracy or completeness of such information (or software), and we assume no liability or responsibility for errors or omissions in the content of this web site, or any software bugs in online applications. Your use of this web site is AT YOUR OWN RISK. Under no circumstances and under no legal theory shall we be liable to you or any other person for any direct, indirect, special, incidental, exemplary, or consequential damages arising from your access to, or use of, this web site. Privacy Policy We may request personal information to be submitted to our servers in order to be able to:
We NEVER allow other companies to directly offer registered users information about their products and services. Banner references and hyperlinks of third parties NEVER contain any personal data of the visitor. We do NOT sell, nor transmit by any means, personal information, nor statistical data series uploaded by you to third parties.
We store a unique ANONYMOUS USER ID in the form of a small 'Cookie' on your computer. This allows us to track your progress when using this website which is necessary to create state-dependent features. The cookie is used for NO OTHER PURPOSE. At any time you may opt to disallow cookies from this website - this will not affect other features of this website. We examine cookies that are used by third-parties (banner and online ads) very closely: abuse from third-parties automatically results in termination of the advertising contract without refund. We have very good reason to believe that the cookies that are produced by third parties (banner ads) do NOT cause any privacy or security risk. FreeStatistics.org is safe. There is no need to download any software to use the applications and services contained in this website. Hence, your system's security is not compromised by their use, and your personal data - other than data you submit in the account application form, and the user-agent information that is transmitted by your browser - is never transmitted to our servers. As a general rule, we do not log on-line behavior of individuals (other than normal logging of webserver 'hits'). However, in cases of abuse, hacking, unauthorized access, Denial of Service attacks, illegal copying, hotlinking, non-compliance with international webstandards (such as robots.txt), or any other harmful behavior, our system engineers are empowered to log, track, identify, publish, and ban misbehaving individuals - even if this leads to ban entire blocks of IP addresses, or disclosing user's identity. | |||||||||||||||||||||||||||||||||||||||||||||||||||||||||