ws5555555555555 | |||||||||||||||||||||||||||||||||||||||||||||||||||||||||||||||||||||
| *Unverified author* | |||||||||||||||||||||||||||||||||||||||||||||||||||||||||||||||||||||
| R Software Module: /rwasp_edabi.wasp (opens new window with default values) | |||||||||||||||||||||||||||||||||||||||||||||||||||||||||||||||||||||
| Title produced by software: Bivariate Explorative Data Analysis | |||||||||||||||||||||||||||||||||||||||||||||||||||||||||||||||||||||
| Date of computation: Tue, 03 Nov 2009 11:04:05 -0700 | |||||||||||||||||||||||||||||||||||||||||||||||||||||||||||||||||||||
| Cite this page as follows: | |||||||||||||||||||||||||||||||||||||||||||||||||||||||||||||||||||||
| Statistical Computations at FreeStatistics.org, Office for Research Development and Education, URL http://www.freestatistics.org/blog/date/2009/Nov/03/t1257271482bijpalgnc0kroq6.htm/, Retrieved Tue, 03 Nov 2009 19:04:51 +0100 | |||||||||||||||||||||||||||||||||||||||||||||||||||||||||||||||||||||
| BibTeX entries for LaTeX users: | |||||||||||||||||||||||||||||||||||||||||||||||||||||||||||||||||||||
@Manual{KEY,
    author = {{YOUR NAME}},
    publisher = {Office for Research Development and Education},
    title = {Statistical Computations at FreeStatistics.org, URL http://www.freestatistics.org/blog/date/2009/Nov/03/t1257271482bijpalgnc0kroq6.htm/},
    year = {2009},
}
@Manual{R,
    title = {R: A Language and Environment for Statistical Computing},
    author = {{R Development Core Team}},
    organization = {R Foundation for Statistical Computing},
    address = {Vienna, Austria},
    year = {2009},
    note = {{ISBN} 3-900051-07-0},
    url = {http://www.R-project.org},
}
| |||||||||||||||||||||||||||||||||||||||||||||||||||||||||||||||||||||
| Original text written by user: | |||||||||||||||||||||||||||||||||||||||||||||||||||||||||||||||||||||
| IsPrivate? | |||||||||||||||||||||||||||||||||||||||||||||||||||||||||||||||||||||
| No (this computation is public) | |||||||||||||||||||||||||||||||||||||||||||||||||||||||||||||||||||||
| User-defined keywords: | |||||||||||||||||||||||||||||||||||||||||||||||||||||||||||||||||||||
| Dataseries X: | |||||||||||||||||||||||||||||||||||||||||||||||||||||||||||||||||||||
| » Textbox « » Textfile « » CSV « | |||||||||||||||||||||||||||||||||||||||||||||||||||||||||||||||||||||
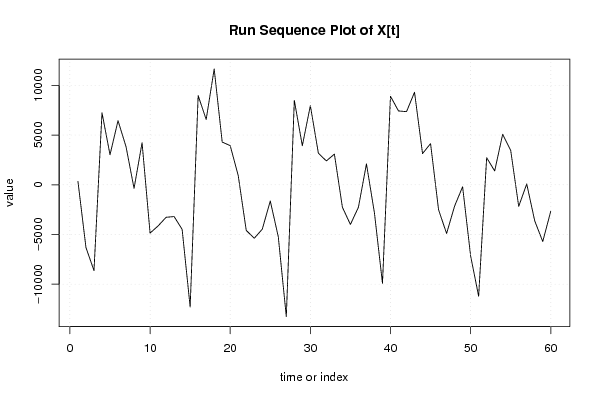
| 335,2807094 -6315,156455 -8630,36 7249,484254 3022,609926 6452,735598 3829,376307 -360,9351859 4232,268359 -4860,450223 -4137,887387 -3268,121007 -3195,19888 -4482,480298 -12291,55817 8975,80112 6572,597575 11656,83119 4297,112613 3942,986941 926,0648141 -4589,216604 -5380,77944 -4466,342276 -1629,54582 -5233,186529 -13266,90511 8499,45418 3926,45418 7970,298433 3178,298433 2400,579851 3087,939142 -2262,701567 -3992,701567 -2256,701567 2104,657724 -2847,982984 -9914,623693 8904,017016 7430,298433 7357,017016 9309,45418 3135,939142 4144,939142 -2513,138731 -4901,060858 -2141,982984 -200,1387307 -7155,498022 -11218,49802 2728,861269 1390,579851 5086,579851 3458,142687 -2174,060858 87,65772447 -3633,982984 -5709,701567 -2663,420149 | |||||||||||||||||||||||||||||||||||||||||||||||||||||||||||||||||||||
| Dataseries Y: | |||||||||||||||||||||||||||||||||||||||||||||||||||||||||||||||||||||
| » Textbox « » Textfile « » CSV « | |||||||||||||||||||||||||||||||||||||||||||||||||||||||||||||||||||||
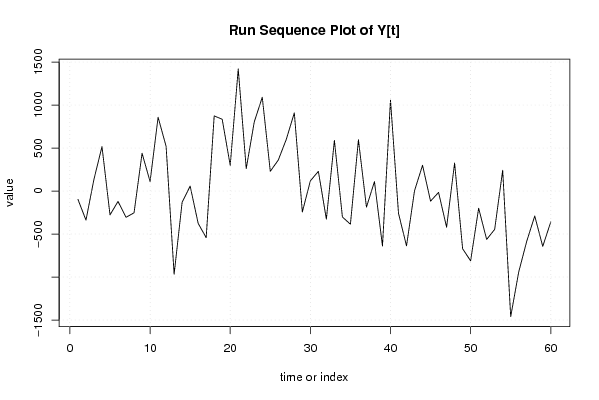
| -97,0413027 -338,0413544 138,4587102 517,4586327 -277,5414708 -120,5415742 -305,0415871 -253,0417423 439,458193 110,4581672 858,4581155 519,9579991 -967,5420397 -129,5420138 57,95794738 -375,5420397 -542,041975 874,4581413 834,4581155 299,4582189 1419,958258 260,9582836 803,9583353 1090,958387 229,4584516 360,9584646 601,9584387 909,4584516 -243,5415484 118,4583741 229,4583741 -326,5416518 589,9583611 -301,5416259 -385,5416259 596,4583741 -187,041613 110,4583999 -639,0415871 1058,4584 -259,5416259 -637,5416001 4,45845164 299,9583611 -117,0416389 -15,54167766 -420,0416389 326,4583999 -670,5416777 -811,0416906 -199,0416906 -562,5416777 -445,5416518 242,4583482 -1460,541704 -941,0416389 -584,041613 -289,5416001 -643,5416259 -358,5416518 | |||||||||||||||||||||||||||||||||||||||||||||||||||||||||||||||||||||
| Output produced by software: | |||||||||||||||||||||||||||||||||||||||||||||||||||||||||||||||||||||
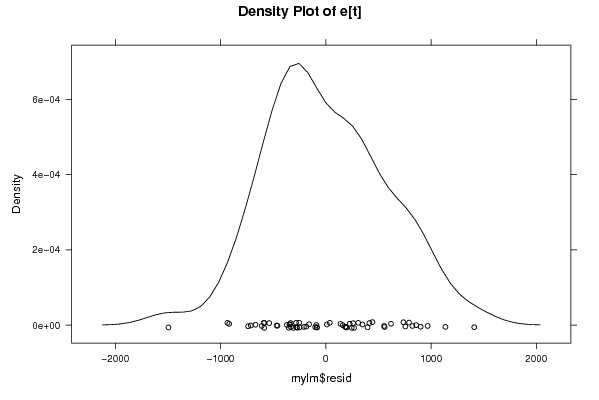
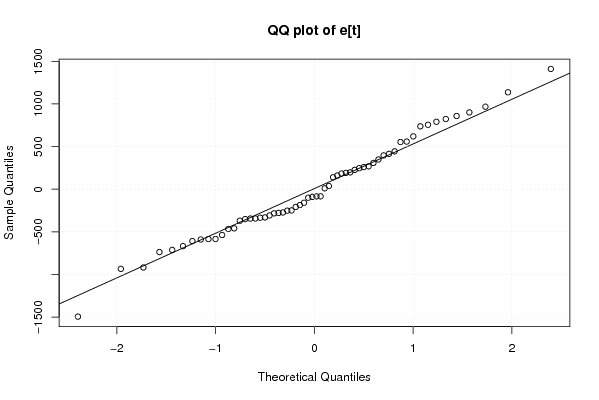
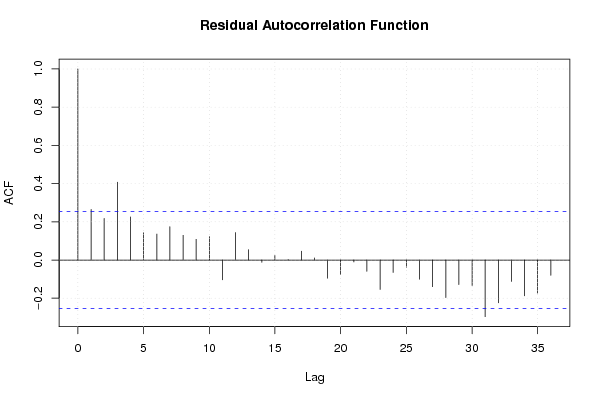
| Charts produced by software: |
| Parameters (Session): | par1 = 0 ; par2 = 36 ; | | Parameters (R input): | par1 = 0 ; par2 = 36 ; | | R code (references can be found in the software module): | par1 <- as.numeric(par1)
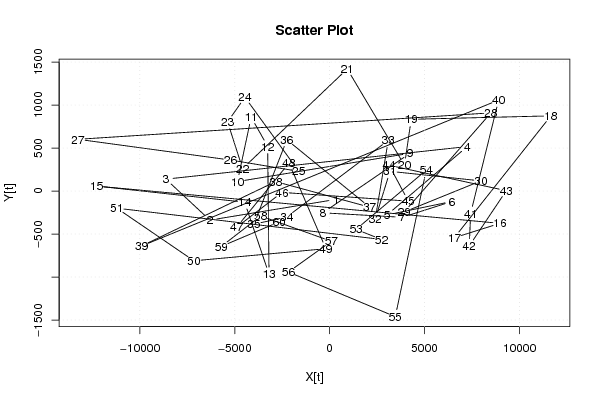
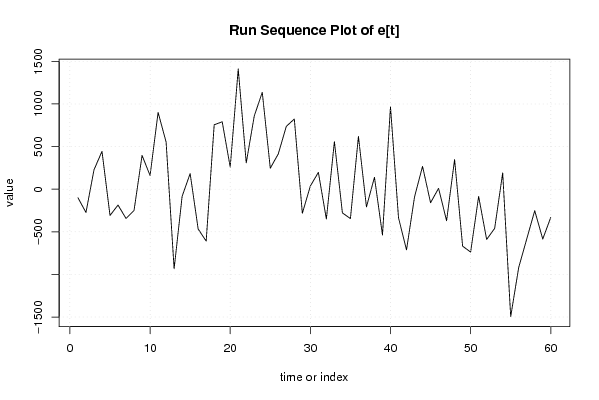
| par2 <- as.numeric(par2) x <- as.ts(x) y <- as.ts(y) mylm <- lm(y~x) cbind(mylm$resid) library(lattice) bitmap(file='pic1.png') plot(y,type='l',main='Run Sequence Plot of Y[t]',xlab='time or index',ylab='value') grid() dev.off() bitmap(file='pic1a.png') plot(x,type='l',main='Run Sequence Plot of X[t]',xlab='time or index',ylab='value') grid() dev.off() bitmap(file='pic1b.png') plot(x,y,main='Scatter Plot',xlab='X[t]',ylab='Y[t]') grid() dev.off() bitmap(file='pic1c.png') plot(mylm$resid,type='l',main='Run Sequence Plot of e[t]',xlab='time or index',ylab='value') grid() dev.off() bitmap(file='pic2.png') hist(mylm$resid,main='Histogram of e[t]') dev.off() bitmap(file='pic3.png') if (par1 > 0) { densityplot(~mylm$resid,col='black',main=paste('Density Plot of e[t] bw = ',par1),bw=par1) } else { densityplot(~mylm$resid,col='black',main='Density Plot of e[t]') } dev.off() bitmap(file='pic4.png') qqnorm(mylm$resid,main='QQ plot of e[t]') qqline(mylm$resid) grid() dev.off() if (par2 > 0) { bitmap(file='pic5.png') acf(mylm$resid,lag.max=par2,main='Residual Autocorrelation Function') grid() dev.off() } summary(x) load(file='createtable') a<-table.start() a<-table.row.start(a) a<-table.element(a,'Model: Y[t] = c + b X[t] + e[t]',2,TRUE) a<-table.row.end(a) a<-table.row.start(a) a<-table.element(a,'c',1,TRUE) a<-table.element(a,mylm$coeff[[1]]) a<-table.row.end(a) a<-table.row.start(a) a<-table.element(a,'b',1,TRUE) a<-table.element(a,mylm$coeff[[2]]) a<-table.row.end(a) a<-table.end(a) table.save(a,file='mytable.tab') a<-table.start() a<-table.row.start(a) a<-table.element(a,'Descriptive Statistics about e[t]',2,TRUE) a<-table.row.end(a) a<-table.row.start(a) a<-table.element(a,'# observations',header=TRUE) a<-table.element(a,length(mylm$resid)) a<-table.row.end(a) a<-table.row.start(a) a<-table.element(a,'minimum',header=TRUE) a<-table.element(a,min(mylm$resid)) a<-table.row.end(a) a<-table.row.start(a) a<-table.element(a,'Q1',header=TRUE) a<-table.element(a,quantile(mylm$resid,0.25)) a<-table.row.end(a) a<-table.row.start(a) a<-table.element(a,'median',header=TRUE) a<-table.element(a,median(mylm$resid)) a<-table.row.end(a) a<-table.row.start(a) a<-table.element(a,'mean',header=TRUE) a<-table.element(a,mean(mylm$resid)) a<-table.row.end(a) a<-table.row.start(a) a<-table.element(a,'Q3',header=TRUE) a<-table.element(a,quantile(mylm$resid,0.75)) a<-table.row.end(a) a<-table.row.start(a) a<-table.element(a,'maximum',header=TRUE) a<-table.element(a,max(mylm$resid)) a<-table.row.end(a) a<-table.end(a) table.save(a,file='mytable.tab') | Copyright
Software written by Ed van Stee & Patrick Wessa Disclaimer Information provided on this web site is provided "AS IS" without warranty of any kind, either express or implied, including, without limitation, warranties of merchantability, fitness for a particular purpose, and noninfringement. We use reasonable efforts to include accurate and timely information and periodically update the information, and software without notice. However, we make no warranties or representations as to the accuracy or completeness of such information (or software), and we assume no liability or responsibility for errors or omissions in the content of this web site, or any software bugs in online applications. Your use of this web site is AT YOUR OWN RISK. Under no circumstances and under no legal theory shall we be liable to you or any other person for any direct, indirect, special, incidental, exemplary, or consequential damages arising from your access to, or use of, this web site. Privacy Policy We may request personal information to be submitted to our servers in order to be able to:
We NEVER allow other companies to directly offer registered users information about their products and services. Banner references and hyperlinks of third parties NEVER contain any personal data of the visitor. We do NOT sell, nor transmit by any means, personal information, nor statistical data series uploaded by you to third parties.
We store a unique ANONYMOUS USER ID in the form of a small 'Cookie' on your computer. This allows us to track your progress when using this website which is necessary to create state-dependent features. The cookie is used for NO OTHER PURPOSE. At any time you may opt to disallow cookies from this website - this will not affect other features of this website. We examine cookies that are used by third-parties (banner and online ads) very closely: abuse from third-parties automatically results in termination of the advertising contract without refund. We have very good reason to believe that the cookies that are produced by third parties (banner ads) do NOT cause any privacy or security risk. FreeStatistics.org is safe. There is no need to download any software to use the applications and services contained in this website. Hence, your system's security is not compromised by their use, and your personal data - other than data you submit in the account application form, and the user-agent information that is transmitted by your browser - is never transmitted to our servers. As a general rule, we do not log on-line behavior of individuals (other than normal logging of webserver 'hits'). However, in cases of abuse, hacking, unauthorized access, Denial of Service attacks, illegal copying, hotlinking, non-compliance with international webstandards (such as robots.txt), or any other harmful behavior, our system engineers are empowered to log, track, identify, publish, and ban misbehaving individuals - even if this leads to ban entire blocks of IP addresses, or disclosing user's identity. | |||||||||||||||||||||||||||||||||||||||||||||||||||||||||