bivar EDA Xt = prim met ; Yt = mach | |||||||||||||||||||||||||||||||||||||||||||||||||||||||||||||||||||||
| *The author of this computation has been verified* | |||||||||||||||||||||||||||||||||||||||||||||||||||||||||||||||||||||
| R Software Module: /rwasp_edabi.wasp (opens new window with default values) | |||||||||||||||||||||||||||||||||||||||||||||||||||||||||||||||||||||
| Title produced by software: Bivariate Explorative Data Analysis | |||||||||||||||||||||||||||||||||||||||||||||||||||||||||||||||||||||
| Date of computation: Mon, 02 Nov 2009 06:38:06 -0700 | |||||||||||||||||||||||||||||||||||||||||||||||||||||||||||||||||||||
| Cite this page as follows: | |||||||||||||||||||||||||||||||||||||||||||||||||||||||||||||||||||||
| Statistical Computations at FreeStatistics.org, Office for Research Development and Education, URL http://www.freestatistics.org/blog/date/2009/Nov/02/t1257169226e4cr2kv05yvlz6e.htm/, Retrieved Mon, 02 Nov 2009 14:40:26 +0100 | |||||||||||||||||||||||||||||||||||||||||||||||||||||||||||||||||||||
| BibTeX entries for LaTeX users: | |||||||||||||||||||||||||||||||||||||||||||||||||||||||||||||||||||||
@Manual{KEY,
    author = {{YOUR NAME}},
    publisher = {Office for Research Development and Education},
    title = {Statistical Computations at FreeStatistics.org, URL http://www.freestatistics.org/blog/date/2009/Nov/02/t1257169226e4cr2kv05yvlz6e.htm/},
    year = {2009},
}
@Manual{R,
    title = {R: A Language and Environment for Statistical Computing},
    author = {{R Development Core Team}},
    organization = {R Foundation for Statistical Computing},
    address = {Vienna, Austria},
    year = {2009},
    note = {{ISBN} 3-900051-07-0},
    url = {http://www.R-project.org},
}
| |||||||||||||||||||||||||||||||||||||||||||||||||||||||||||||||||||||
| Original text written by user: | |||||||||||||||||||||||||||||||||||||||||||||||||||||||||||||||||||||
| IsPrivate? | |||||||||||||||||||||||||||||||||||||||||||||||||||||||||||||||||||||
| No (this computation is public) | |||||||||||||||||||||||||||||||||||||||||||||||||||||||||||||||||||||
| User-defined keywords: | |||||||||||||||||||||||||||||||||||||||||||||||||||||||||||||||||||||
| Dataseries X: | |||||||||||||||||||||||||||||||||||||||||||||||||||||||||||||||||||||
| » Textbox « » Textfile « » CSV « | |||||||||||||||||||||||||||||||||||||||||||||||||||||||||||||||||||||
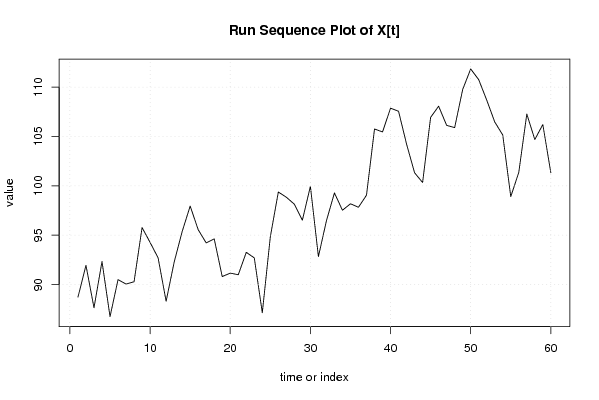
| 88.7233 91.9441 87.6443 92.3349 86.7446 90.4944 90.0456 90.2818 95.7701 94.2684 92.6972 88.3027 92.262 95.3634 97.9526 95.5567 94.2145 94.6263 90.8046 91.1568 90.99 93.2625 92.6989 87.1384 94.8365 99.3737 98.8442 98.1394 96.5231 99.9541 92.8272 96.4591 99.2824 97.5254 98.1819 97.8293 99.0573 105.7607 105.4583 107.8701 107.5543 104.2246 101.322 100.3369 106.9387 108.0687 106.1259 105.9 109.7624 111.8431 110.758 108.6872 106.4739 105.1487 98.9033 101.3615 107.2762 104.6946 106.2082 101.3239 | |||||||||||||||||||||||||||||||||||||||||||||||||||||||||||||||||||||
| Dataseries Y: | |||||||||||||||||||||||||||||||||||||||||||||||||||||||||||||||||||||
| » Textbox « » Textfile « » CSV « | |||||||||||||||||||||||||||||||||||||||||||||||||||||||||||||||||||||
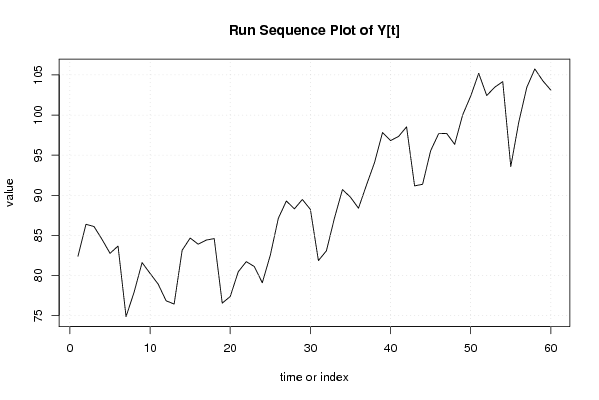
| 82.3975 86.3819 86.1038 84.5059 82.7593 83.6718 74.8676 77.8998 81.6094 80.2569 78.934 76.8461 76.4379 83.14 84.6699 83.9001 84.4128 84.5982 76.5504 77.3826 80.4645 81.7259 81.1172 79.0921 82.5387 87.1251 89.2859 88.3042 89.4752 88.2355 81.8561 83.0776 87.1477 90.7124 89.762 88.3862 91.2844 94.0694 97.8276 96.8148 97.3319 98.5312 91.1703 91.3694 95.5428 97.6763 97.7141 96.3445 100.025 102.3597 105.204 102.4316 103.4731 104.1694 93.5787 99.1232 103.4544 105.7473 104.2672 103.1026 | |||||||||||||||||||||||||||||||||||||||||||||||||||||||||||||||||||||
| Output produced by software: | |||||||||||||||||||||||||||||||||||||||||||||||||||||||||||||||||||||
| Charts produced by software: |
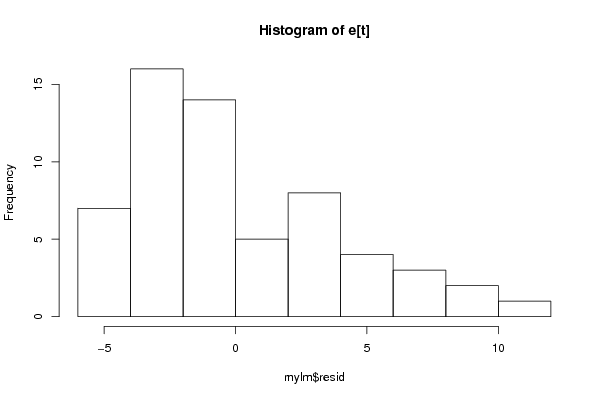
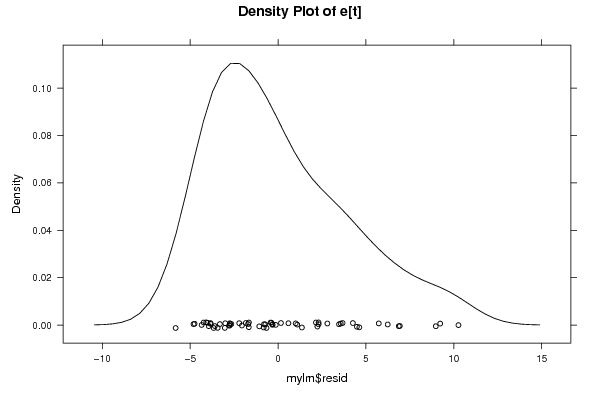
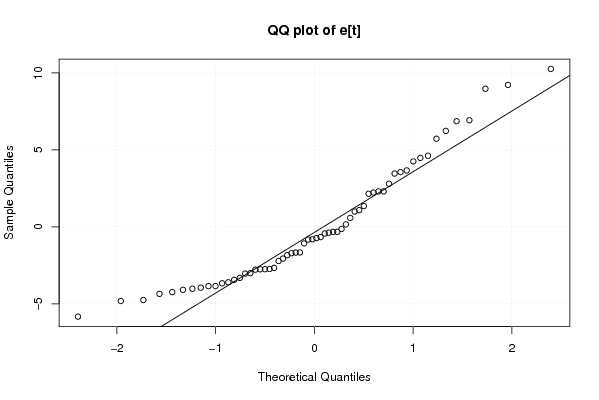
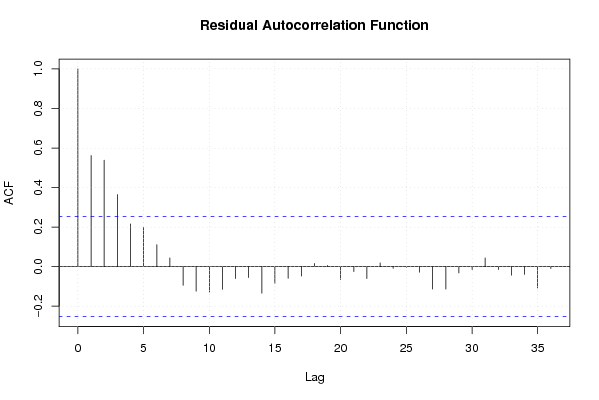
| Parameters (Session): | par1 = 0 ; par2 = 36 ; | | Parameters (R input): | par1 = 0 ; par2 = 36 ; | | R code (references can be found in the software module): | par1 <- as.numeric(par1)
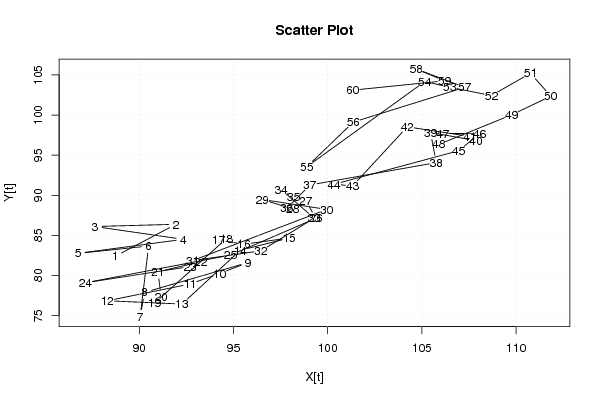
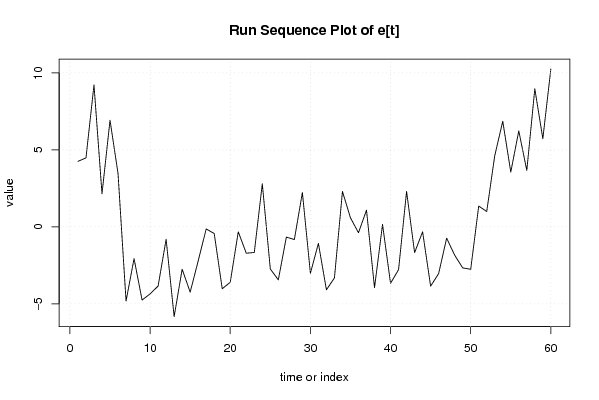
| par2 <- as.numeric(par2) x <- as.ts(x) y <- as.ts(y) mylm <- lm(y~x) cbind(mylm$resid) library(lattice) bitmap(file='pic1.png') plot(y,type='l',main='Run Sequence Plot of Y[t]',xlab='time or index',ylab='value') grid() dev.off() bitmap(file='pic1a.png') plot(x,type='l',main='Run Sequence Plot of X[t]',xlab='time or index',ylab='value') grid() dev.off() bitmap(file='pic1b.png') plot(x,y,main='Scatter Plot',xlab='X[t]',ylab='Y[t]') grid() dev.off() bitmap(file='pic1c.png') plot(mylm$resid,type='l',main='Run Sequence Plot of e[t]',xlab='time or index',ylab='value') grid() dev.off() bitmap(file='pic2.png') hist(mylm$resid,main='Histogram of e[t]') dev.off() bitmap(file='pic3.png') if (par1 > 0) { densityplot(~mylm$resid,col='black',main=paste('Density Plot of e[t] bw = ',par1),bw=par1) } else { densityplot(~mylm$resid,col='black',main='Density Plot of e[t]') } dev.off() bitmap(file='pic4.png') qqnorm(mylm$resid,main='QQ plot of e[t]') qqline(mylm$resid) grid() dev.off() if (par2 > 0) { bitmap(file='pic5.png') acf(mylm$resid,lag.max=par2,main='Residual Autocorrelation Function') grid() dev.off() } summary(x) load(file='createtable') a<-table.start() a<-table.row.start(a) a<-table.element(a,'Model: Y[t] = c + b X[t] + e[t]',2,TRUE) a<-table.row.end(a) a<-table.row.start(a) a<-table.element(a,'c',1,TRUE) a<-table.element(a,mylm$coeff[[1]]) a<-table.row.end(a) a<-table.row.start(a) a<-table.element(a,'b',1,TRUE) a<-table.element(a,mylm$coeff[[2]]) a<-table.row.end(a) a<-table.end(a) table.save(a,file='mytable.tab') a<-table.start() a<-table.row.start(a) a<-table.element(a,'Descriptive Statistics about e[t]',2,TRUE) a<-table.row.end(a) a<-table.row.start(a) a<-table.element(a,'# observations',header=TRUE) a<-table.element(a,length(mylm$resid)) a<-table.row.end(a) a<-table.row.start(a) a<-table.element(a,'minimum',header=TRUE) a<-table.element(a,min(mylm$resid)) a<-table.row.end(a) a<-table.row.start(a) a<-table.element(a,'Q1',header=TRUE) a<-table.element(a,quantile(mylm$resid,0.25)) a<-table.row.end(a) a<-table.row.start(a) a<-table.element(a,'median',header=TRUE) a<-table.element(a,median(mylm$resid)) a<-table.row.end(a) a<-table.row.start(a) a<-table.element(a,'mean',header=TRUE) a<-table.element(a,mean(mylm$resid)) a<-table.row.end(a) a<-table.row.start(a) a<-table.element(a,'Q3',header=TRUE) a<-table.element(a,quantile(mylm$resid,0.75)) a<-table.row.end(a) a<-table.row.start(a) a<-table.element(a,'maximum',header=TRUE) a<-table.element(a,max(mylm$resid)) a<-table.row.end(a) a<-table.end(a) table.save(a,file='mytable.tab') | Copyright
Software written by Ed van Stee & Patrick Wessa Disclaimer Information provided on this web site is provided "AS IS" without warranty of any kind, either express or implied, including, without limitation, warranties of merchantability, fitness for a particular purpose, and noninfringement. We use reasonable efforts to include accurate and timely information and periodically update the information, and software without notice. However, we make no warranties or representations as to the accuracy or completeness of such information (or software), and we assume no liability or responsibility for errors or omissions in the content of this web site, or any software bugs in online applications. Your use of this web site is AT YOUR OWN RISK. Under no circumstances and under no legal theory shall we be liable to you or any other person for any direct, indirect, special, incidental, exemplary, or consequential damages arising from your access to, or use of, this web site. Privacy Policy We may request personal information to be submitted to our servers in order to be able to:
We NEVER allow other companies to directly offer registered users information about their products and services. Banner references and hyperlinks of third parties NEVER contain any personal data of the visitor. We do NOT sell, nor transmit by any means, personal information, nor statistical data series uploaded by you to third parties.
We store a unique ANONYMOUS USER ID in the form of a small 'Cookie' on your computer. This allows us to track your progress when using this website which is necessary to create state-dependent features. The cookie is used for NO OTHER PURPOSE. At any time you may opt to disallow cookies from this website - this will not affect other features of this website. We examine cookies that are used by third-parties (banner and online ads) very closely: abuse from third-parties automatically results in termination of the advertising contract without refund. We have very good reason to believe that the cookies that are produced by third parties (banner ads) do NOT cause any privacy or security risk. FreeStatistics.org is safe. There is no need to download any software to use the applications and services contained in this website. Hence, your system's security is not compromised by their use, and your personal data - other than data you submit in the account application form, and the user-agent information that is transmitted by your browser - is never transmitted to our servers. As a general rule, we do not log on-line behavior of individuals (other than normal logging of webserver 'hits'). However, in cases of abuse, hacking, unauthorized access, Denial of Service attacks, illegal copying, hotlinking, non-compliance with international webstandards (such as robots.txt), or any other harmful behavior, our system engineers are empowered to log, track, identify, publish, and ban misbehaving individuals - even if this leads to ban entire blocks of IP addresses, or disclosing user's identity. | |||||||||||||||||||||||||||||||||||||||||||||||||||||||||