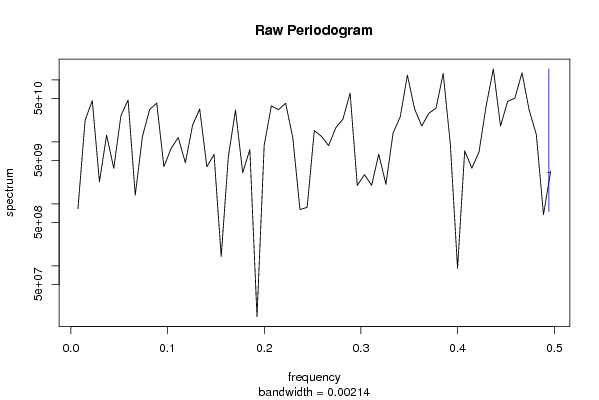
Spectral analyses: raw periodogram (d=0, D=1) - Aantal overnachtingen in België | |||||||||||||||||||||||||||||||||||||||||||||||||||||||||||||||||||||||||||||||||||||||||||||||||||||||||||||||||||||||||||||||||||||||||||||||||||||||||||||||||||||||||||||||||
| *The author of this computation has been verified* | |||||||||||||||||||||||||||||||||||||||||||||||||||||||||||||||||||||||||||||||||||||||||||||||||||||||||||||||||||||||||||||||||||||||||||||||||||||||||||||||||||||||||||||||||
| R Software Module: /rwasp_spectrum.wasp (opens new window with default values) | |||||||||||||||||||||||||||||||||||||||||||||||||||||||||||||||||||||||||||||||||||||||||||||||||||||||||||||||||||||||||||||||||||||||||||||||||||||||||||||||||||||||||||||||||
| Title produced by software: Spectral Analysis | |||||||||||||||||||||||||||||||||||||||||||||||||||||||||||||||||||||||||||||||||||||||||||||||||||||||||||||||||||||||||||||||||||||||||||||||||||||||||||||||||||||||||||||||||
| Date of computation: Sat, 19 Dec 2009 05:07:06 -0700 | |||||||||||||||||||||||||||||||||||||||||||||||||||||||||||||||||||||||||||||||||||||||||||||||||||||||||||||||||||||||||||||||||||||||||||||||||||||||||||||||||||||||||||||||||
| Cite this page as follows: | |||||||||||||||||||||||||||||||||||||||||||||||||||||||||||||||||||||||||||||||||||||||||||||||||||||||||||||||||||||||||||||||||||||||||||||||||||||||||||||||||||||||||||||||||
| Statistical Computations at FreeStatistics.org, Office for Research Development and Education, URL http://www.freestatistics.org/blog/date/2009/Dec/19/t1261224864uep6ulh4x9py3wh.htm/, Retrieved Sat, 19 Dec 2009 13:14:27 +0100 | |||||||||||||||||||||||||||||||||||||||||||||||||||||||||||||||||||||||||||||||||||||||||||||||||||||||||||||||||||||||||||||||||||||||||||||||||||||||||||||||||||||||||||||||||
| BibTeX entries for LaTeX users: | |||||||||||||||||||||||||||||||||||||||||||||||||||||||||||||||||||||||||||||||||||||||||||||||||||||||||||||||||||||||||||||||||||||||||||||||||||||||||||||||||||||||||||||||||
@Manual{KEY,
    author = {{YOUR NAME}},
    publisher = {Office for Research Development and Education},
    title = {Statistical Computations at FreeStatistics.org, URL http://www.freestatistics.org/blog/date/2009/Dec/19/t1261224864uep6ulh4x9py3wh.htm/},
    year = {2009},
}
@Manual{R,
    title = {R: A Language and Environment for Statistical Computing},
    author = {{R Development Core Team}},
    organization = {R Foundation for Statistical Computing},
    address = {Vienna, Austria},
    year = {2009},
    note = {{ISBN} 3-900051-07-0},
    url = {http://www.R-project.org},
}
| |||||||||||||||||||||||||||||||||||||||||||||||||||||||||||||||||||||||||||||||||||||||||||||||||||||||||||||||||||||||||||||||||||||||||||||||||||||||||||||||||||||||||||||||||
| Original text written by user: | |||||||||||||||||||||||||||||||||||||||||||||||||||||||||||||||||||||||||||||||||||||||||||||||||||||||||||||||||||||||||||||||||||||||||||||||||||||||||||||||||||||||||||||||||
| IsPrivate? | |||||||||||||||||||||||||||||||||||||||||||||||||||||||||||||||||||||||||||||||||||||||||||||||||||||||||||||||||||||||||||||||||||||||||||||||||||||||||||||||||||||||||||||||||
| No (this computation is public) | |||||||||||||||||||||||||||||||||||||||||||||||||||||||||||||||||||||||||||||||||||||||||||||||||||||||||||||||||||||||||||||||||||||||||||||||||||||||||||||||||||||||||||||||||
| User-defined keywords: | |||||||||||||||||||||||||||||||||||||||||||||||||||||||||||||||||||||||||||||||||||||||||||||||||||||||||||||||||||||||||||||||||||||||||||||||||||||||||||||||||||||||||||||||||
| Dataseries X: | |||||||||||||||||||||||||||||||||||||||||||||||||||||||||||||||||||||||||||||||||||||||||||||||||||||||||||||||||||||||||||||||||||||||||||||||||||||||||||||||||||||||||||||||||
| » Textbox « » Textfile « » CSV « | |||||||||||||||||||||||||||||||||||||||||||||||||||||||||||||||||||||||||||||||||||||||||||||||||||||||||||||||||||||||||||||||||||||||||||||||||||||||||||||||||||||||||||||||||
| 897262 1133132 1384548 2324057 2502808 2516762 5579822 4945991 2019915 1830905 1251016 949902 923000 1215747 1479112 2371781 2521576 2350559 5673323 4414295 2016902 1958302 1284086 1186305 957833 1255719 1482709 2361136 2508100 2254488 5669953 4227480 2067790 1958419 1318158 1287921 1076982 1293669 1582053 2393005 2310531 2597899 5507587 4194133 2185092 2122018 1413348 1338342 1052655 1370046 1887027 2448017 2550796 2655837 5269499 4247405 2109722 2143145 1582013 1413221 1118520 1478655 2000108 2085234 2651805 2522176 5170142 4150129 2104254 2211398 1505900 1524305 1093144 1449647 1771197 2445932 2678945 2400737 4796880 4118001 2125714 2125515 1508760 1508765 1091075 1514814 1748997 2424406 2747942 2377332 5210706 3882821 2197469 2271155 1618917 1391579 1143249 1445785 1870242 2597788 2436231 2684184 4705109 4331347 2369192 2283947 1749607 1598601 1221234 1497778 1823567 2489908 2532837 2456065 46 etc... | |||||||||||||||||||||||||||||||||||||||||||||||||||||||||||||||||||||||||||||||||||||||||||||||||||||||||||||||||||||||||||||||||||||||||||||||||||||||||||||||||||||||||||||||||
| Output produced by software: | |||||||||||||||||||||||||||||||||||||||||||||||||||||||||||||||||||||||||||||||||||||||||||||||||||||||||||||||||||||||||||||||||||||||||||||||||||||||||||||||||||||||||||||||||
| Charts produced by software: |
| Parameters (Session): | par1 = 1 ; par2 = 0 ; par3 = 1 ; par4 = 12 ; | | Parameters (R input): | par1 = 1 ; par2 = 0 ; par3 = 1 ; par4 = 12 ; | | R code (references can be found in the software module): | par1 <- as.numeric(par1)
| par2 <- as.numeric(par2) par3 <- as.numeric(par3) par4 <- as.numeric(par4) if (par1 == 0) { x <- log(x) } else { x <- (x ^ par1 - 1) / par1 } if (par2 > 0) x <- diff(x,lag=1,difference=par2) if (par3 > 0) x <- diff(x,lag=par4,difference=par3) bitmap(file='test1.png') r <- spectrum(x,main='Raw Periodogram') dev.off() bitmap(file='test2.png') cpgram(x,main='Cumulative Periodogram') dev.off() load(file='createtable') a<-table.start() a<-table.row.start(a) a<-table.element(a,'Raw Periodogram',2,TRUE) a<-table.row.end(a) a<-table.row.start(a) a<-table.element(a,'Parameter',header=TRUE) a<-table.element(a,'Value',header=TRUE) a<-table.row.end(a) a<-table.row.start(a) a<-table.element(a,'Box-Cox transformation parameter (lambda)',header=TRUE) a<-table.element(a,par1) a<-table.row.end(a) a<-table.row.start(a) a<-table.element(a,'Degree of non-seasonal differencing (d)',header=TRUE) a<-table.element(a,par2) a<-table.row.end(a) a<-table.row.start(a) a<-table.element(a,'Degree of seasonal differencing (D)',header=TRUE) a<-table.element(a,par3) a<-table.row.end(a) a<-table.row.start(a) a<-table.element(a,'Seasonal Period (s)',header=TRUE) a<-table.element(a,par4) a<-table.row.end(a) a<-table.row.start(a) a<-table.element(a,'Frequency (Period)',header=TRUE) a<-table.element(a,'Spectrum',header=TRUE) a<-table.row.end(a) for (i in 1:length(r$freq)) { a<-table.row.start(a) mylab <- round(r$freq[i],4) mylab <- paste(mylab,' (',sep='') mylab <- paste(mylab,round(1/r$freq[i],4),sep='') mylab <- paste(mylab,')',sep='') a<-table.element(a,mylab,header=TRUE) a<-table.element(a,round(r$spec[i],6)) a<-table.row.end(a) } a<-table.end(a) table.save(a,file='mytable.tab') | Copyright
Software written by Ed van Stee & Patrick Wessa Disclaimer Information provided on this web site is provided "AS IS" without warranty of any kind, either express or implied, including, without limitation, warranties of merchantability, fitness for a particular purpose, and noninfringement. We use reasonable efforts to include accurate and timely information and periodically update the information, and software without notice. However, we make no warranties or representations as to the accuracy or completeness of such information (or software), and we assume no liability or responsibility for errors or omissions in the content of this web site, or any software bugs in online applications. Your use of this web site is AT YOUR OWN RISK. Under no circumstances and under no legal theory shall we be liable to you or any other person for any direct, indirect, special, incidental, exemplary, or consequential damages arising from your access to, or use of, this web site. Privacy Policy We may request personal information to be submitted to our servers in order to be able to:
We NEVER allow other companies to directly offer registered users information about their products and services. Banner references and hyperlinks of third parties NEVER contain any personal data of the visitor. We do NOT sell, nor transmit by any means, personal information, nor statistical data series uploaded by you to third parties.
We store a unique ANONYMOUS USER ID in the form of a small 'Cookie' on your computer. This allows us to track your progress when using this website which is necessary to create state-dependent features. The cookie is used for NO OTHER PURPOSE. At any time you may opt to disallow cookies from this website - this will not affect other features of this website. We examine cookies that are used by third-parties (banner and online ads) very closely: abuse from third-parties automatically results in termination of the advertising contract without refund. We have very good reason to believe that the cookies that are produced by third parties (banner ads) do NOT cause any privacy or security risk. FreeStatistics.org is safe. There is no need to download any software to use the applications and services contained in this website. Hence, your system's security is not compromised by their use, and your personal data - other than data you submit in the account application form, and the user-agent information that is transmitted by your browser - is never transmitted to our servers. As a general rule, we do not log on-line behavior of individuals (other than normal logging of webserver 'hits'). However, in cases of abuse, hacking, unauthorized access, Denial of Service attacks, illegal copying, hotlinking, non-compliance with international webstandards (such as robots.txt), or any other harmful behavior, our system engineers are empowered to log, track, identify, publish, and ban misbehaving individuals - even if this leads to ban entire blocks of IP addresses, or disclosing user's identity. | |||||||||||||||||||||||||||||||||||||||||||||||||||||||||||||||||||||||||||||||||||||||||||||||||||||||||||||||||||||||||||||||||||||||||||||||||||||||||||||||||||||