Free Statistics
of Irreproducible Research!
Description of Statistical Computation | ||||||||||||||||||||||||||||||
|---|---|---|---|---|---|---|---|---|---|---|---|---|---|---|---|---|---|---|---|---|---|---|---|---|---|---|---|---|---|---|
| Author's title | ||||||||||||||||||||||||||||||
| Author | *The author of this computation has been verified* | |||||||||||||||||||||||||||||
| R Software Module | Ian.Hollidayrwasp_Reddy-Moores DAta.wasp | |||||||||||||||||||||||||||||
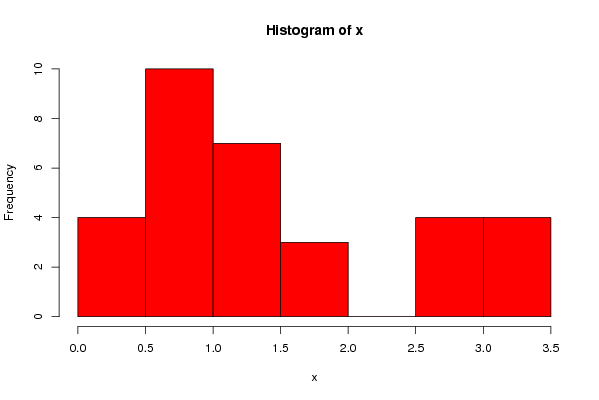
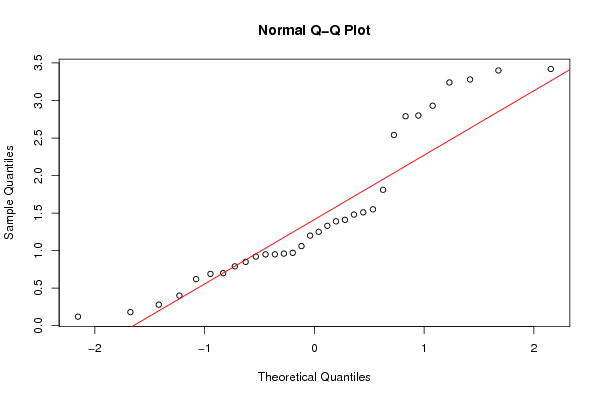
| Title produced by software | Histogram and QQPlot | |||||||||||||||||||||||||||||
| Date of computation | Wed, 16 Dec 2009 16:50:52 +0100 | |||||||||||||||||||||||||||||
| Cite this page as follows | Statistical Computations at FreeStatistics.org, Office for Research Development and Education, URL https://freestatistics.org/blog/index.php?v=date/2009/Dec/16/t12609787499872smjn2o98iog.htm/, Retrieved Tue, 09 Jun 2026 13:21:14 +0000 | |||||||||||||||||||||||||||||
| Statistical Computations at FreeStatistics.org, Office for Research Development and Education, URL https://freestatistics.org/blog/index.php?pk=68441, Retrieved Tue, 09 Jun 2026 13:21:14 +0000 | ||||||||||||||||||||||||||||||
| QR Codes: | ||||||||||||||||||||||||||||||
|
| ||||||||||||||||||||||||||||||
| Original text written by user: | ||||||||||||||||||||||||||||||
| IsPrivate? | No (this computation is public) | |||||||||||||||||||||||||||||
| User-defined keywords | ||||||||||||||||||||||||||||||
| Estimated Impact | 886 | |||||||||||||||||||||||||||||
Tree of Dependent Computations | ||||||||||||||||||||||||||||||
| Family? (F = Feedback message, R = changed R code, M = changed R Module, P = changed Parameters, D = changed Data) | ||||||||||||||||||||||||||||||
| - [Histogram and QQplot] [PY2224 Aston Work...] [2009-10-06 09:57:09] [98fd0e87c3eb04e0cc2efde01dbafab6] - P [Histogram and QQplot] [olivia friday] [2009-10-09 12:41:21] [3fdd735c61ad38cbc9b3393dc997cdb7] - RMPD [Histogram and QQplot] [Reddy Moores Hist...] [2009-10-09 13:23:16] [98fd0e87c3eb04e0cc2efde01dbafab6] - D [Histogram and QQPlot] [Histogram and QQ ...] [2009-12-16 15:50:52] [72e70820461d0e77268e06309fbe41c7] [Current] - [Histogram and QQPlot] [workshop 11] [2009-12-17 12:28:35] [86674042f568b97a0cb1393bb670625c] - [Histogram and QQPlot] [Comp 11 part a i] [2009-12-17 12:34:52] [74be16979710d4c4e7c6647856088456] - D [Histogram and QQPlot] [Comp 11 part a i] [2009-12-17 12:46:53] [74be16979710d4c4e7c6647856088456] - PD [Histogram and QQPlot] [w11] [2009-12-17 12:33:52] [66f61a2d5ef80b1eafe31e5651ad0889] - D [Histogram and QQPlot] [w11] [2009-12-17 12:39:47] [66f61a2d5ef80b1eafe31e5651ad0889] - D [Histogram and QQPlot] [w11] [2009-12-17 12:41:40] [66f61a2d5ef80b1eafe31e5651ad0889] - D [Histogram and QQPlot] [w11] [2009-12-17 12:43:33] [66f61a2d5ef80b1eafe31e5651ad0889] - [Histogram and QQPlot] [Ex 1D] [2010-01-11 15:55:05] [153000c0b3bd367036e4d581452d08df] - [Histogram and QQPlot] [Ex 1C] [2010-01-11 15:54:12] [153000c0b3bd367036e4d581452d08df] - [Histogram and QQPlot] [Ex 1B] [2010-01-11 15:52:54] [153000c0b3bd367036e4d581452d08df] - PD [Histogram and QQPlot] [w11] [2009-12-17 13:35:12] [66f61a2d5ef80b1eafe31e5651ad0889] - D [Histogram and QQPlot] [w11] [2009-12-17 13:39:03] [66f61a2d5ef80b1eafe31e5651ad0889] - [Histogram and QQPlot] [B2] [2010-01-11 15:59:32] [153000c0b3bd367036e4d581452d08df] - [Histogram and QQPlot] [B1] [2010-01-11 15:57:59] [153000c0b3bd367036e4d581452d08df] - [Histogram and QQPlot] [Ex 1A] [2010-01-11 15:49:32] [153000c0b3bd367036e4d581452d08df] - D [Histogram and QQPlot (Reddy-Moores Data)] [] [2010-05-31 21:18:45] [66f61a2d5ef80b1eafe31e5651ad0889] - RMPD [] [lMmPiQCKcZSJ] [1970-01-01 00:00:00] [d3fd8a6ec33d7cd4d78e5822d4e39332] - D [Histogram and QQPlot] [Wk11Q1b] [2009-12-17 12:38:45] [68b4a0d51ad214b1a79d67393064cb7e] - D [Histogram and QQPlot] [week 11] [2009-12-17 12:45:01] [ca384074e13d8ac77eea5bf691c887ff] - D [Histogram and QQPlot] [week 11, non smoker] [2009-12-17 12:48:19] [ca384074e13d8ac77eea5bf691c887ff] - D [Histogram and QQPlot] [week 11, hot] [2009-12-17 12:52:42] [ca384074e13d8ac77eea5bf691c887ff] - D [Histogram and QQPlot] [week 11,mild] [2009-12-17 12:56:54] [ca384074e13d8ac77eea5bf691c887ff] - D [Histogram and QQPlot] [] [2009-12-17 12:44:55] [21e0dc66e9338653c0fd8541e5a86956] - D [Histogram and QQPlot] [] [2009-12-17 12:46:35] [82439cd473f0ddf8a88eb1802dda9b6c] - D [Histogram and QQPlot] [1st blog] [2009-12-17 12:44:19] [5cae40017fc37cfe76436682b5003098] - [Histogram and QQPlot] [week 11 excercise...] [2009-12-17 12:47:51] [a2ec18f77143ca7c2255feafca790c81] - D [Histogram and QQPlot] [] [2009-12-17 12:48:30] [21e0dc66e9338653c0fd8541e5a86956] - [Histogram and QQPlot] [status and taste] [2009-12-17 12:48:38] [e8203e272d1fe64b4ec8ac05ae2152eb] - [Histogram and QQPlot] [comp] [2010-01-11 15:54:38] [153000c0b3bd367036e4d581452d08df] - [Histogram and QQPlot] [comp] [2010-01-12 14:35:50] [153000c0b3bd367036e4d581452d08df] - D [Histogram and QQPlot] [] [2009-12-17 12:53:35] [21e0dc66e9338653c0fd8541e5a86956] - D [Histogram and QQPlot] [] [2009-12-17 12:57:13] [21e0dc66e9338653c0fd8541e5a86956] - [Histogram and QQPlot] [comp 11] [2009-12-17 13:24:52] [981ccd4f0082ace49a11aa7a2b792a9c] - [Histogram and QQPlot] [] [2009-12-17 13:40:23] [a120050d9c71216a504f7d26958aa6f2] - [Histogram and QQPlot] [histogram and QQ ...] [2009-12-17 13:33:10] [cf93fcabe70097db6e8467c3ff511999] - D [Histogram and QQPlot] [workshop 11] [2009-12-17 13:41:06] [74c3e16d305231b554ac00a07222fb5c] - [Histogram and QQPlot] [Boxplots for part A] [2009-12-17 13:47:43] [991f3c16ff1ec6689e9f3866d072593e] - D [Histogram and QQPlot] [] [2009-12-20 15:10:23] [a120050d9c71216a504f7d26958aa6f2] - D [Histogram and QQPlot] [] [2009-12-20 15:19:21] [a120050d9c71216a504f7d26958aa6f2] - D [Histogram and QQPlot] [] [2009-12-20 15:22:21] [a120050d9c71216a504f7d26958aa6f2] - D [Histogram and QQPlot] [] [2009-12-20 15:25:31] [a120050d9c71216a504f7d26958aa6f2] - [Histogram and QQPlot] [Part A Q1] [2009-12-21 00:42:14] [256a42577f5eb7e9c8a1b74c73a90fa8] - [Histogram and QQPlot] [workshop] [2009-12-21 21:34:21] [7ee8584ae92dbbc2a823887b8397aaa8] - [Histogram and QQPlot] [Workshop 11] [2009-12-23 11:21:55] [c0fd4f9a7f3faddc4844dbb572f0833e] - [Histogram and QQPlot] [wk 11 exercise 1 ...] [2009-12-27 21:31:26] [166b3b50b14ad81e946931c96c6ff94f] - D [Histogram and QQPlot] [Curry Data pt 1] [2010-01-03 16:09:09] [226e457c23f16abdaf22fe48e6e411fd] - [Histogram and QQPlot (Reddy-Moores Data)] [] [2010-08-29 17:25:02] [d2db1c86d0f5afc23d9384801205d08d] - [Histogram and QQPlot (Reddy-Moores Data)] [] [2010-08-29 17:30:05] [d2db1c86d0f5afc23d9384801205d08d] [Truncated] | ||||||||||||||||||||||||||||||
| Feedback Forum | ||||||||||||||||||||||||||||||
Post a new message | ||||||||||||||||||||||||||||||
Dataset | ||||||||||||||||||||||||||||||
| Dataseries X: | ||||||||||||||||||||||||||||||
0.28 0.95 0.96 0.97 0.4 0.18 0.12 0.62 1.81 1.51 1.41 1.39 1.2 1.55 1.48 1.25 0.95 1.33 0.92 0.85 1.06 0.69 0.7 0.79 2.93 3.24 3.42 2.79 2.54 3.28 2.8 3.4 | ||||||||||||||||||||||||||||||
Tables (Output of Computation) | ||||||||||||||||||||||||||||||
| ||||||||||||||||||||||||||||||
Figures (Output of Computation) | ||||||||||||||||||||||||||||||
Input Parameters & R Code | ||||||||||||||||||||||||||||||
| Parameters (Session): | ||||||||||||||||||||||||||||||
| par1 = 10 ; | ||||||||||||||||||||||||||||||
| Parameters (R input): | ||||||||||||||||||||||||||||||
| par1 = 10 ; | ||||||||||||||||||||||||||||||
| R code (references can be found in the software module): | ||||||||||||||||||||||||||||||
bitmap(file='test1.png') | ||||||||||||||||||||||||||||||