Free Statistics

of Irreproducible Research!

Author's title

Author*The author of this computation has been verified*
R Software Modulerwasp_multipleregression.wasp
Title produced by softwareMultiple Regression
Date of computationWed, 16 Dec 2009 06:47:46 -0700
Cite this page as followsStatistical Computations at FreeStatistics.org, Office for Research Development and Education, URL https://freestatistics.org/blog/index.php?v=date/2009/Dec/16/t12609714805allwqus7fvgg45.htm/, Retrieved Sun, 28 Apr 2024 21:40:42 +0000
Statistical Computations at FreeStatistics.org, Office for Research Development and Education, URL https://freestatistics.org/blog/index.php?pk=68340, Retrieved Sun, 28 Apr 2024 21:40:42 +0000
QR Codes:

Original text written by user:Uitleg in word document
IsPrivate?No (this computation is public)
User-defined keywords
Estimated Impact139
Family? (F = Feedback message, R = changed R code, M = changed R Module, P = changed Parameters, D = changed Data)
-     [Multiple Regression] [Q1 The Seatbeltlaw] [2007-11-14 19:27:43] [8cd6641b921d30ebe00b648d1481bba0]
- RM D  [Multiple Regression] [Seatbelt] [2009-11-12 14:10:54] [b98453cac15ba1066b407e146608df68]
- R  D    [Multiple Regression] [Regressiemodel 4 ...] [2009-11-20 21:32:43] [54d83950395cfb8ca1091bdb7440f70a]
-    D        [Multiple Regression] [Regressiemodel d=...] [2009-12-16 13:47:46] [8eb8270f5a1cfdf0409dcfcbf10be18b] [Current]
Feedback Forum

Post a new message
Dataseries X:
98.30	100.9	96.96
96.38	108.3	93.11
100.82	113.2	95.62
99.06	105	98.30
94.03	104	96.38
102.07	109.8	100.82
99.31	98.6	99.06
98.64	93.5	94.03
101.82	98.2	102.07
99.14	88	99.31
97.63	85.3	98.64
100.06	96.8	101.82
101.32	98.8	99.14
101.49	110.3	97.63
105.43	111.6	100.06
105.09	111.2	101.32
99.48	106.9	101.49
108.53	117.6	105.43
104.34	97	105.09
106.10	97.3	99.48
107.35	98.4	108.53
103.00	87.6	104.34
104.50	87.4	106.10
105.17	94.7	107.35
104.84	101.5	103.00
106.18	110.4	104.50
108.86	108.4	105.17
107.77	109.7	104.84
102.74	105.2	106.18
112.63	111.1	108.86
106.26	96.2	107.77
108.86	97.3	102.74
111.38	98.9	112.63
106.85	91.7	106.26
107.86	90.9	108.86
107.94	98.8	111.38
111.38	111.5	106.85
111.29	119	107.86
113.72	115.3	107.94
111.88	116.3	111.38
109.87	113.6	111.29
113.72	115.1	113.72
111.71	109.7	111.88
114.81	97.6	109.87
112.05	100.8	113.72
111.54	94	111.71
110.87	87.2	114.81
110.87	102.9	112.05
115.48	111.3	111.54
111.63	106.6	110.87
116.24	108.9	110.87
113.56	108.3	115.48
106.01	100.5	111.63
110.45	104	116.24
107.77	89.9	113.56
108.61	86.8	106.01
108.19	91.2	110.45


Summary of computational transaction
Raw Inputview raw input (R code)
Raw Outputview raw output of R engine
Computing time7 seconds
R Server'Gwilym Jenkins' @ 72.249.127.135

\begin{tabular}{lllllllll}
\hline
Summary of computational transaction \tabularnewline
Raw Input & view raw input (R code)  \tabularnewline
Raw Output & view raw output of R engine  \tabularnewline
Computing time & 7 seconds \tabularnewline
R Server & 'Gwilym Jenkins' @ 72.249.127.135 \tabularnewline
\hline
\end{tabular}
%Source: https://freestatistics.org/blog/index.php?pk=68340&T=0

[TABLE]
[ROW][C]Summary of computational transaction[/C][/ROW]
[ROW][C]Raw Input[/C][C]view raw input (R code) [/C][/ROW]
[ROW][C]Raw Output[/C][C]view raw output of R engine [/C][/ROW]
[ROW][C]Computing time[/C][C]7 seconds[/C][/ROW]
[ROW][C]R Server[/C][C]'Gwilym Jenkins' @ 72.249.127.135[/C][/ROW]
[/TABLE]
Source: https://freestatistics.org/blog/index.php?pk=68340&T=0

Globally Unique Identifier (entire table): ba.freestatistics.org/blog/index.php?pk=68340&T=0

As an alternative you can also use a QR Code:  

The GUIDs for individual cells are displayed in the table below:

Summary of computational transaction
Raw Inputview raw input (R code)
Raw Outputview raw output of R engine
Computing time7 seconds
R Server'Gwilym Jenkins' @ 72.249.127.135


Multiple Linear Regression - Estimated Regression Equation
BESTC[t] = -0.75448327137553 + 0.307049523018442INDUSTR[t] + 0.694996652147111Y3[t] + 1.72757373099391M1[t] -0.579545947732459M2[t] + 2.03034588826871M3[t] -0.75591220373799M4[t] -3.99789829388022M5[t] -1.18967180175891M6[t] + 0.298094479651019M7[t] + 6.44444054242996M8[t] + 1.32753134816382M9[t] + 3.57349423814607M10[t] + 3.23498817808467M11[t] + 0.0472542409650887t + e[t]

\begin{tabular}{lllllllll}
\hline
Multiple Linear Regression - Estimated Regression Equation \tabularnewline
BESTC[t] =  -0.75448327137553 +  0.307049523018442INDUSTR[t] +  0.694996652147111Y3[t] +  1.72757373099391M1[t] -0.579545947732459M2[t] +  2.03034588826871M3[t] -0.75591220373799M4[t] -3.99789829388022M5[t] -1.18967180175891M6[t] +  0.298094479651019M7[t] +  6.44444054242996M8[t] +  1.32753134816382M9[t] +  3.57349423814607M10[t] +  3.23498817808467M11[t] +  0.0472542409650887t  + e[t] \tabularnewline
\hline
\end{tabular}
%Source: https://freestatistics.org/blog/index.php?pk=68340&T=1

[TABLE]
[ROW][C]Multiple Linear Regression - Estimated Regression Equation[/C][/ROW]
[ROW][C]BESTC[t] =  -0.75448327137553 +  0.307049523018442INDUSTR[t] +  0.694996652147111Y3[t] +  1.72757373099391M1[t] -0.579545947732459M2[t] +  2.03034588826871M3[t] -0.75591220373799M4[t] -3.99789829388022M5[t] -1.18967180175891M6[t] +  0.298094479651019M7[t] +  6.44444054242996M8[t] +  1.32753134816382M9[t] +  3.57349423814607M10[t] +  3.23498817808467M11[t] +  0.0472542409650887t  + e[t][/C][/ROW]
[/TABLE]
Source: https://freestatistics.org/blog/index.php?pk=68340&T=1

Globally Unique Identifier (entire table): ba.freestatistics.org/blog/index.php?pk=68340&T=1

As an alternative you can also use a QR Code:  

The GUIDs for individual cells are displayed in the table below:

Multiple Linear Regression - Estimated Regression Equation
BESTC[t] = -0.75448327137553 + 0.307049523018442INDUSTR[t] + 0.694996652147111Y3[t] + 1.72757373099391M1[t] -0.579545947732459M2[t] + 2.03034588826871M3[t] -0.75591220373799M4[t] -3.99789829388022M5[t] -1.18967180175891M6[t] + 0.298094479651019M7[t] + 6.44444054242996M8[t] + 1.32753134816382M9[t] + 3.57349423814607M10[t] + 3.23498817808467M11[t] + 0.0472542409650887t + e[t]


Multiple Linear Regression - Ordinary Least Squares
VariableParameterS.D.T-STATH0: parameter = 02-tail p-value1-tail p-value
(Intercept)-0.754483271375538.666941-0.08710.9310430.465522
INDUSTR0.3070495230184420.0383778.000800
Y30.6949966521471110.0962517.220700
M11.727573730993910.86379120.0519960.025998
M2-0.5795459477324591.040881-0.55680.580630.290315
M32.030345888268711.0104332.00940.0509510.025476
M4-0.755912203737990.893009-0.84650.4020840.201042
M5-3.997898293880220.855833-4.67143.1e-051.5e-05
M6-1.189671801758910.871828-1.36460.1796550.089827
M70.2980944796510190.7347040.40570.6869970.343499
M86.444440542429960.9233446.979500
M91.327531348163820.7313091.81530.0766250.038313
M103.573494238146070.8201744.3578.3e-054.2e-05
M113.234988178084670.85783.77130.0005020.000251
t0.04725424096508870.0314331.50330.1402350.070117

\begin{tabular}{lllllllll}
\hline
Multiple Linear Regression - Ordinary Least Squares \tabularnewline
Variable & Parameter & S.D. & T-STATH0: parameter = 0 & 2-tail p-value & 1-tail p-value \tabularnewline
(Intercept) & -0.75448327137553 & 8.666941 & -0.0871 & 0.931043 & 0.465522 \tabularnewline
INDUSTR & 0.307049523018442 & 0.038377 & 8.0008 & 0 & 0 \tabularnewline
Y3 & 0.694996652147111 & 0.096251 & 7.2207 & 0 & 0 \tabularnewline
M1 & 1.72757373099391 & 0.863791 & 2 & 0.051996 & 0.025998 \tabularnewline
M2 & -0.579545947732459 & 1.040881 & -0.5568 & 0.58063 & 0.290315 \tabularnewline
M3 & 2.03034588826871 & 1.010433 & 2.0094 & 0.050951 & 0.025476 \tabularnewline
M4 & -0.75591220373799 & 0.893009 & -0.8465 & 0.402084 & 0.201042 \tabularnewline
M5 & -3.99789829388022 & 0.855833 & -4.6714 & 3.1e-05 & 1.5e-05 \tabularnewline
M6 & -1.18967180175891 & 0.871828 & -1.3646 & 0.179655 & 0.089827 \tabularnewline
M7 & 0.298094479651019 & 0.734704 & 0.4057 & 0.686997 & 0.343499 \tabularnewline
M8 & 6.44444054242996 & 0.923344 & 6.9795 & 0 & 0 \tabularnewline
M9 & 1.32753134816382 & 0.731309 & 1.8153 & 0.076625 & 0.038313 \tabularnewline
M10 & 3.57349423814607 & 0.820174 & 4.357 & 8.3e-05 & 4.2e-05 \tabularnewline
M11 & 3.23498817808467 & 0.8578 & 3.7713 & 0.000502 & 0.000251 \tabularnewline
t & 0.0472542409650887 & 0.031433 & 1.5033 & 0.140235 & 0.070117 \tabularnewline
\hline
\end{tabular}
%Source: https://freestatistics.org/blog/index.php?pk=68340&T=2

[TABLE]
[ROW][C]Multiple Linear Regression - Ordinary Least Squares[/C][/ROW]
[ROW][C]Variable[/C][C]Parameter[/C][C]S.D.[/C][C]T-STATH0: parameter = 0[/C][C]2-tail p-value[/C][C]1-tail p-value[/C][/ROW]
[ROW][C](Intercept)[/C][C]-0.75448327137553[/C][C]8.666941[/C][C]-0.0871[/C][C]0.931043[/C][C]0.465522[/C][/ROW]
[ROW][C]INDUSTR[/C][C]0.307049523018442[/C][C]0.038377[/C][C]8.0008[/C][C]0[/C][C]0[/C][/ROW]
[ROW][C]Y3[/C][C]0.694996652147111[/C][C]0.096251[/C][C]7.2207[/C][C]0[/C][C]0[/C][/ROW]
[ROW][C]M1[/C][C]1.72757373099391[/C][C]0.863791[/C][C]2[/C][C]0.051996[/C][C]0.025998[/C][/ROW]
[ROW][C]M2[/C][C]-0.579545947732459[/C][C]1.040881[/C][C]-0.5568[/C][C]0.58063[/C][C]0.290315[/C][/ROW]
[ROW][C]M3[/C][C]2.03034588826871[/C][C]1.010433[/C][C]2.0094[/C][C]0.050951[/C][C]0.025476[/C][/ROW]
[ROW][C]M4[/C][C]-0.75591220373799[/C][C]0.893009[/C][C]-0.8465[/C][C]0.402084[/C][C]0.201042[/C][/ROW]
[ROW][C]M5[/C][C]-3.99789829388022[/C][C]0.855833[/C][C]-4.6714[/C][C]3.1e-05[/C][C]1.5e-05[/C][/ROW]
[ROW][C]M6[/C][C]-1.18967180175891[/C][C]0.871828[/C][C]-1.3646[/C][C]0.179655[/C][C]0.089827[/C][/ROW]
[ROW][C]M7[/C][C]0.298094479651019[/C][C]0.734704[/C][C]0.4057[/C][C]0.686997[/C][C]0.343499[/C][/ROW]
[ROW][C]M8[/C][C]6.44444054242996[/C][C]0.923344[/C][C]6.9795[/C][C]0[/C][C]0[/C][/ROW]
[ROW][C]M9[/C][C]1.32753134816382[/C][C]0.731309[/C][C]1.8153[/C][C]0.076625[/C][C]0.038313[/C][/ROW]
[ROW][C]M10[/C][C]3.57349423814607[/C][C]0.820174[/C][C]4.357[/C][C]8.3e-05[/C][C]4.2e-05[/C][/ROW]
[ROW][C]M11[/C][C]3.23498817808467[/C][C]0.8578[/C][C]3.7713[/C][C]0.000502[/C][C]0.000251[/C][/ROW]
[ROW][C]t[/C][C]0.0472542409650887[/C][C]0.031433[/C][C]1.5033[/C][C]0.140235[/C][C]0.070117[/C][/ROW]
[/TABLE]
Source: https://freestatistics.org/blog/index.php?pk=68340&T=2

Globally Unique Identifier (entire table): ba.freestatistics.org/blog/index.php?pk=68340&T=2

As an alternative you can also use a QR Code:  

The GUIDs for individual cells are displayed in the table below:

Multiple Linear Regression - Ordinary Least Squares
VariableParameterS.D.T-STATH0: parameter = 02-tail p-value1-tail p-value
(Intercept)-0.754483271375538.666941-0.08710.9310430.465522
INDUSTR0.3070495230184420.0383778.000800
Y30.6949966521471110.0962517.220700
M11.727573730993910.86379120.0519960.025998
M2-0.5795459477324591.040881-0.55680.580630.290315
M32.030345888268711.0104332.00940.0509510.025476
M4-0.755912203737990.893009-0.84650.4020840.201042
M5-3.997898293880220.855833-4.67143.1e-051.5e-05
M6-1.189671801758910.871828-1.36460.1796550.089827
M70.2980944796510190.7347040.40570.6869970.343499
M86.444440542429960.9233446.979500
M91.327531348163820.7313091.81530.0766250.038313
M103.573494238146070.8201744.3578.3e-054.2e-05
M113.234988178084670.85783.77130.0005020.000251
t0.04725424096508870.0314331.50330.1402350.070117


Multiple Linear Regression - Regression Statistics
Multiple R0.98466733380303
R-squared0.969569758258765
Adjusted R-squared0.95942634434502
F-TEST (value)95.586137616345
F-TEST (DF numerator)14
F-TEST (DF denominator)42
p-value0
Multiple Linear Regression - Residual Statistics
Residual Standard Deviation1.0859361766499
Sum Squared Residuals49.5288099497942

\begin{tabular}{lllllllll}
\hline
Multiple Linear Regression - Regression Statistics \tabularnewline
Multiple R & 0.98466733380303 \tabularnewline
R-squared & 0.969569758258765 \tabularnewline
Adjusted R-squared & 0.95942634434502 \tabularnewline
F-TEST (value) & 95.586137616345 \tabularnewline
F-TEST (DF numerator) & 14 \tabularnewline
F-TEST (DF denominator) & 42 \tabularnewline
p-value & 0 \tabularnewline
Multiple Linear Regression - Residual Statistics \tabularnewline
Residual Standard Deviation & 1.0859361766499 \tabularnewline
Sum Squared Residuals & 49.5288099497942 \tabularnewline
\hline
\end{tabular}
%Source: https://freestatistics.org/blog/index.php?pk=68340&T=3

[TABLE]
[ROW][C]Multiple Linear Regression - Regression Statistics[/C][/ROW]
[ROW][C]Multiple R[/C][C]0.98466733380303[/C][/ROW]
[ROW][C]R-squared[/C][C]0.969569758258765[/C][/ROW]
[ROW][C]Adjusted R-squared[/C][C]0.95942634434502[/C][/ROW]
[ROW][C]F-TEST (value)[/C][C]95.586137616345[/C][/ROW]
[ROW][C]F-TEST (DF numerator)[/C][C]14[/C][/ROW]
[ROW][C]F-TEST (DF denominator)[/C][C]42[/C][/ROW]
[ROW][C]p-value[/C][C]0[/C][/ROW]
[ROW][C]Multiple Linear Regression - Residual Statistics[/C][/ROW]
[ROW][C]Residual Standard Deviation[/C][C]1.0859361766499[/C][/ROW]
[ROW][C]Sum Squared Residuals[/C][C]49.5288099497942[/C][/ROW]
[/TABLE]
Source: https://freestatistics.org/blog/index.php?pk=68340&T=3

Globally Unique Identifier (entire table): ba.freestatistics.org/blog/index.php?pk=68340&T=3

As an alternative you can also use a QR Code:  

The GUIDs for individual cells are displayed in the table below:

Multiple Linear Regression - Regression Statistics
Multiple R0.98466733380303
R-squared0.969569758258765
Adjusted R-squared0.95942634434502
F-TEST (value)95.586137616345
F-TEST (DF numerator)14
F-TEST (DF denominator)42
p-value0
Multiple Linear Regression - Residual Statistics
Residual Standard Deviation1.0859361766499
Sum Squared Residuals49.5288099497942


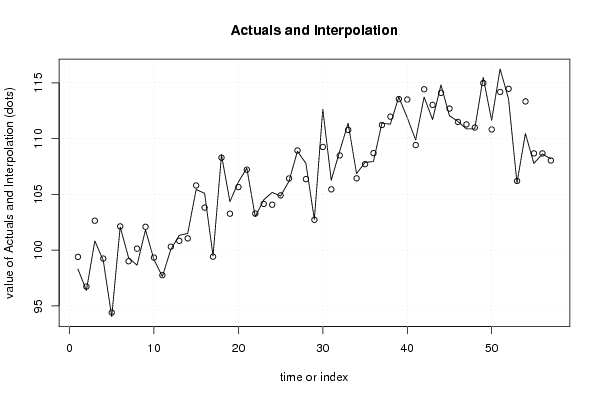
Multiple Linear Regression - Actuals, Interpolation, and Residuals
Time or IndexActualsInterpolationForecastResidualsPrediction Error
198.399.3885169653282-1.08851696532819
296.3896.725080887137-0.345080887136932
3100.82102.631211223783-1.81121122378281
499.0699.2369923117442-0.176992311744223
594.0394.4008173674262-0.370817367426193
6102.07102.122970469553-0.0529704695527258
799.3198.99584222634230.314157773657726
898.64100.127656802392-1.48765680239229
9101.82102.088907690541-0.268907690540689
1099.1499.332028926774-0.192028926773886
1197.6397.7460956385892-0.116095638589223
12100.06100.299520570010-0.239520570009528
13101.32100.8258565602510.494143439748832
14101.49101.0476156924600.442384307540174
15105.43105.792768014068-0.362768014067527
16105.09103.8066401355241.2833598644761
1799.4899.40974476823250.0702552317675301
18108.53108.2889422070760.241057792924179
19104.34103.2624436935411.07755630645909
20106.1105.6492276356450.450772364354807
21107.35107.2070468595960.142953140404218
22103103.272093169448-0.272093169447541
23104.5104.1426255535260.357374446473547
24105.17104.0650989496251.10490105037461
25104.84104.904628241270-0.0646282412698626
26106.18106.419998536593-0.239998536593377
27108.86108.928693324461-0.068693324461323
28107.77106.3595049581351.41049504186485
29102.74102.7143457692520.0256542307478491
30112.63109.2440097159023.3859902840984
31106.26105.4464459944610.813554005538527
32108.86108.4819676132260.378032386774175
33111.38110.7771087864890.602891213510783
34106.85106.4324406775270.417559322473321
35107.86107.7025405355980.157459464401905
36107.94108.691889393735-0.751889393734923
37111.38111.2179114738020.162088526198271
38111.29111.962864077347-0.672864077347334
39113.72113.5395266513170.180473348682869
40111.88113.49836080668-1.61836080668003
41109.87109.4120455466600.457954453340149
42113.72114.416942428991-0.696942428991389
43111.71113.015101687116-1.30510168711614
44114.81114.0964594915210.713540508478675
45112.05112.685100122646-0.635100122645671
46111.54111.4934372262520.0465627737481058
47110.87111.268738272286-0.398738272286228
48110.87110.983491086630-0.113491086630163
49115.48114.9830867593490.496913240650947
50111.63110.8144408064630.815559193537468
51116.24114.1778007863712.06219921362879
52113.56114.458501787917-0.898501787916705
53106.01106.193046548429-0.183046548429334
54110.45113.327135178478-2.87713517847846
55107.77108.670166398539-0.9001663985392
56108.61108.664688457215-0.0546884572153699
57108.19108.0318365407290.158163459271359

\begin{tabular}{lllllllll}
\hline
Multiple Linear Regression - Actuals, Interpolation, and Residuals \tabularnewline
Time or Index & Actuals & InterpolationForecast & ResidualsPrediction Error \tabularnewline
1 & 98.3 & 99.3885169653282 & -1.08851696532819 \tabularnewline
2 & 96.38 & 96.725080887137 & -0.345080887136932 \tabularnewline
3 & 100.82 & 102.631211223783 & -1.81121122378281 \tabularnewline
4 & 99.06 & 99.2369923117442 & -0.176992311744223 \tabularnewline
5 & 94.03 & 94.4008173674262 & -0.370817367426193 \tabularnewline
6 & 102.07 & 102.122970469553 & -0.0529704695527258 \tabularnewline
7 & 99.31 & 98.9958422263423 & 0.314157773657726 \tabularnewline
8 & 98.64 & 100.127656802392 & -1.48765680239229 \tabularnewline
9 & 101.82 & 102.088907690541 & -0.268907690540689 \tabularnewline
10 & 99.14 & 99.332028926774 & -0.192028926773886 \tabularnewline
11 & 97.63 & 97.7460956385892 & -0.116095638589223 \tabularnewline
12 & 100.06 & 100.299520570010 & -0.239520570009528 \tabularnewline
13 & 101.32 & 100.825856560251 & 0.494143439748832 \tabularnewline
14 & 101.49 & 101.047615692460 & 0.442384307540174 \tabularnewline
15 & 105.43 & 105.792768014068 & -0.362768014067527 \tabularnewline
16 & 105.09 & 103.806640135524 & 1.2833598644761 \tabularnewline
17 & 99.48 & 99.4097447682325 & 0.0702552317675301 \tabularnewline
18 & 108.53 & 108.288942207076 & 0.241057792924179 \tabularnewline
19 & 104.34 & 103.262443693541 & 1.07755630645909 \tabularnewline
20 & 106.1 & 105.649227635645 & 0.450772364354807 \tabularnewline
21 & 107.35 & 107.207046859596 & 0.142953140404218 \tabularnewline
22 & 103 & 103.272093169448 & -0.272093169447541 \tabularnewline
23 & 104.5 & 104.142625553526 & 0.357374446473547 \tabularnewline
24 & 105.17 & 104.065098949625 & 1.10490105037461 \tabularnewline
25 & 104.84 & 104.904628241270 & -0.0646282412698626 \tabularnewline
26 & 106.18 & 106.419998536593 & -0.239998536593377 \tabularnewline
27 & 108.86 & 108.928693324461 & -0.068693324461323 \tabularnewline
28 & 107.77 & 106.359504958135 & 1.41049504186485 \tabularnewline
29 & 102.74 & 102.714345769252 & 0.0256542307478491 \tabularnewline
30 & 112.63 & 109.244009715902 & 3.3859902840984 \tabularnewline
31 & 106.26 & 105.446445994461 & 0.813554005538527 \tabularnewline
32 & 108.86 & 108.481967613226 & 0.378032386774175 \tabularnewline
33 & 111.38 & 110.777108786489 & 0.602891213510783 \tabularnewline
34 & 106.85 & 106.432440677527 & 0.417559322473321 \tabularnewline
35 & 107.86 & 107.702540535598 & 0.157459464401905 \tabularnewline
36 & 107.94 & 108.691889393735 & -0.751889393734923 \tabularnewline
37 & 111.38 & 111.217911473802 & 0.162088526198271 \tabularnewline
38 & 111.29 & 111.962864077347 & -0.672864077347334 \tabularnewline
39 & 113.72 & 113.539526651317 & 0.180473348682869 \tabularnewline
40 & 111.88 & 113.49836080668 & -1.61836080668003 \tabularnewline
41 & 109.87 & 109.412045546660 & 0.457954453340149 \tabularnewline
42 & 113.72 & 114.416942428991 & -0.696942428991389 \tabularnewline
43 & 111.71 & 113.015101687116 & -1.30510168711614 \tabularnewline
44 & 114.81 & 114.096459491521 & 0.713540508478675 \tabularnewline
45 & 112.05 & 112.685100122646 & -0.635100122645671 \tabularnewline
46 & 111.54 & 111.493437226252 & 0.0465627737481058 \tabularnewline
47 & 110.87 & 111.268738272286 & -0.398738272286228 \tabularnewline
48 & 110.87 & 110.983491086630 & -0.113491086630163 \tabularnewline
49 & 115.48 & 114.983086759349 & 0.496913240650947 \tabularnewline
50 & 111.63 & 110.814440806463 & 0.815559193537468 \tabularnewline
51 & 116.24 & 114.177800786371 & 2.06219921362879 \tabularnewline
52 & 113.56 & 114.458501787917 & -0.898501787916705 \tabularnewline
53 & 106.01 & 106.193046548429 & -0.183046548429334 \tabularnewline
54 & 110.45 & 113.327135178478 & -2.87713517847846 \tabularnewline
55 & 107.77 & 108.670166398539 & -0.9001663985392 \tabularnewline
56 & 108.61 & 108.664688457215 & -0.0546884572153699 \tabularnewline
57 & 108.19 & 108.031836540729 & 0.158163459271359 \tabularnewline
\hline
\end{tabular}
%Source: https://freestatistics.org/blog/index.php?pk=68340&T=4

[TABLE]
[ROW][C]Multiple Linear Regression - Actuals, Interpolation, and Residuals[/C][/ROW]
[ROW][C]Time or Index[/C][C]Actuals[/C][C]InterpolationForecast[/C][C]ResidualsPrediction Error[/C][/ROW]
[ROW][C]1[/C][C]98.3[/C][C]99.3885169653282[/C][C]-1.08851696532819[/C][/ROW]
[ROW][C]2[/C][C]96.38[/C][C]96.725080887137[/C][C]-0.345080887136932[/C][/ROW]
[ROW][C]3[/C][C]100.82[/C][C]102.631211223783[/C][C]-1.81121122378281[/C][/ROW]
[ROW][C]4[/C][C]99.06[/C][C]99.2369923117442[/C][C]-0.176992311744223[/C][/ROW]
[ROW][C]5[/C][C]94.03[/C][C]94.4008173674262[/C][C]-0.370817367426193[/C][/ROW]
[ROW][C]6[/C][C]102.07[/C][C]102.122970469553[/C][C]-0.0529704695527258[/C][/ROW]
[ROW][C]7[/C][C]99.31[/C][C]98.9958422263423[/C][C]0.314157773657726[/C][/ROW]
[ROW][C]8[/C][C]98.64[/C][C]100.127656802392[/C][C]-1.48765680239229[/C][/ROW]
[ROW][C]9[/C][C]101.82[/C][C]102.088907690541[/C][C]-0.268907690540689[/C][/ROW]
[ROW][C]10[/C][C]99.14[/C][C]99.332028926774[/C][C]-0.192028926773886[/C][/ROW]
[ROW][C]11[/C][C]97.63[/C][C]97.7460956385892[/C][C]-0.116095638589223[/C][/ROW]
[ROW][C]12[/C][C]100.06[/C][C]100.299520570010[/C][C]-0.239520570009528[/C][/ROW]
[ROW][C]13[/C][C]101.32[/C][C]100.825856560251[/C][C]0.494143439748832[/C][/ROW]
[ROW][C]14[/C][C]101.49[/C][C]101.047615692460[/C][C]0.442384307540174[/C][/ROW]
[ROW][C]15[/C][C]105.43[/C][C]105.792768014068[/C][C]-0.362768014067527[/C][/ROW]
[ROW][C]16[/C][C]105.09[/C][C]103.806640135524[/C][C]1.2833598644761[/C][/ROW]
[ROW][C]17[/C][C]99.48[/C][C]99.4097447682325[/C][C]0.0702552317675301[/C][/ROW]
[ROW][C]18[/C][C]108.53[/C][C]108.288942207076[/C][C]0.241057792924179[/C][/ROW]
[ROW][C]19[/C][C]104.34[/C][C]103.262443693541[/C][C]1.07755630645909[/C][/ROW]
[ROW][C]20[/C][C]106.1[/C][C]105.649227635645[/C][C]0.450772364354807[/C][/ROW]
[ROW][C]21[/C][C]107.35[/C][C]107.207046859596[/C][C]0.142953140404218[/C][/ROW]
[ROW][C]22[/C][C]103[/C][C]103.272093169448[/C][C]-0.272093169447541[/C][/ROW]
[ROW][C]23[/C][C]104.5[/C][C]104.142625553526[/C][C]0.357374446473547[/C][/ROW]
[ROW][C]24[/C][C]105.17[/C][C]104.065098949625[/C][C]1.10490105037461[/C][/ROW]
[ROW][C]25[/C][C]104.84[/C][C]104.904628241270[/C][C]-0.0646282412698626[/C][/ROW]
[ROW][C]26[/C][C]106.18[/C][C]106.419998536593[/C][C]-0.239998536593377[/C][/ROW]
[ROW][C]27[/C][C]108.86[/C][C]108.928693324461[/C][C]-0.068693324461323[/C][/ROW]
[ROW][C]28[/C][C]107.77[/C][C]106.359504958135[/C][C]1.41049504186485[/C][/ROW]
[ROW][C]29[/C][C]102.74[/C][C]102.714345769252[/C][C]0.0256542307478491[/C][/ROW]
[ROW][C]30[/C][C]112.63[/C][C]109.244009715902[/C][C]3.3859902840984[/C][/ROW]
[ROW][C]31[/C][C]106.26[/C][C]105.446445994461[/C][C]0.813554005538527[/C][/ROW]
[ROW][C]32[/C][C]108.86[/C][C]108.481967613226[/C][C]0.378032386774175[/C][/ROW]
[ROW][C]33[/C][C]111.38[/C][C]110.777108786489[/C][C]0.602891213510783[/C][/ROW]
[ROW][C]34[/C][C]106.85[/C][C]106.432440677527[/C][C]0.417559322473321[/C][/ROW]
[ROW][C]35[/C][C]107.86[/C][C]107.702540535598[/C][C]0.157459464401905[/C][/ROW]
[ROW][C]36[/C][C]107.94[/C][C]108.691889393735[/C][C]-0.751889393734923[/C][/ROW]
[ROW][C]37[/C][C]111.38[/C][C]111.217911473802[/C][C]0.162088526198271[/C][/ROW]
[ROW][C]38[/C][C]111.29[/C][C]111.962864077347[/C][C]-0.672864077347334[/C][/ROW]
[ROW][C]39[/C][C]113.72[/C][C]113.539526651317[/C][C]0.180473348682869[/C][/ROW]
[ROW][C]40[/C][C]111.88[/C][C]113.49836080668[/C][C]-1.61836080668003[/C][/ROW]
[ROW][C]41[/C][C]109.87[/C][C]109.412045546660[/C][C]0.457954453340149[/C][/ROW]
[ROW][C]42[/C][C]113.72[/C][C]114.416942428991[/C][C]-0.696942428991389[/C][/ROW]
[ROW][C]43[/C][C]111.71[/C][C]113.015101687116[/C][C]-1.30510168711614[/C][/ROW]
[ROW][C]44[/C][C]114.81[/C][C]114.096459491521[/C][C]0.713540508478675[/C][/ROW]
[ROW][C]45[/C][C]112.05[/C][C]112.685100122646[/C][C]-0.635100122645671[/C][/ROW]
[ROW][C]46[/C][C]111.54[/C][C]111.493437226252[/C][C]0.0465627737481058[/C][/ROW]
[ROW][C]47[/C][C]110.87[/C][C]111.268738272286[/C][C]-0.398738272286228[/C][/ROW]
[ROW][C]48[/C][C]110.87[/C][C]110.983491086630[/C][C]-0.113491086630163[/C][/ROW]
[ROW][C]49[/C][C]115.48[/C][C]114.983086759349[/C][C]0.496913240650947[/C][/ROW]
[ROW][C]50[/C][C]111.63[/C][C]110.814440806463[/C][C]0.815559193537468[/C][/ROW]
[ROW][C]51[/C][C]116.24[/C][C]114.177800786371[/C][C]2.06219921362879[/C][/ROW]
[ROW][C]52[/C][C]113.56[/C][C]114.458501787917[/C][C]-0.898501787916705[/C][/ROW]
[ROW][C]53[/C][C]106.01[/C][C]106.193046548429[/C][C]-0.183046548429334[/C][/ROW]
[ROW][C]54[/C][C]110.45[/C][C]113.327135178478[/C][C]-2.87713517847846[/C][/ROW]
[ROW][C]55[/C][C]107.77[/C][C]108.670166398539[/C][C]-0.9001663985392[/C][/ROW]
[ROW][C]56[/C][C]108.61[/C][C]108.664688457215[/C][C]-0.0546884572153699[/C][/ROW]
[ROW][C]57[/C][C]108.19[/C][C]108.031836540729[/C][C]0.158163459271359[/C][/ROW]
[/TABLE]
Source: https://freestatistics.org/blog/index.php?pk=68340&T=4

Globally Unique Identifier (entire table): ba.freestatistics.org/blog/index.php?pk=68340&T=4

As an alternative you can also use a QR Code:  

The GUIDs for individual cells are displayed in the table below:

Multiple Linear Regression - Actuals, Interpolation, and Residuals
Time or IndexActualsInterpolationForecastResidualsPrediction Error
198.399.3885169653282-1.08851696532819
296.3896.725080887137-0.345080887136932
3100.82102.631211223783-1.81121122378281
499.0699.2369923117442-0.176992311744223
594.0394.4008173674262-0.370817367426193
6102.07102.122970469553-0.0529704695527258
799.3198.99584222634230.314157773657726
898.64100.127656802392-1.48765680239229
9101.82102.088907690541-0.268907690540689
1099.1499.332028926774-0.192028926773886
1197.6397.7460956385892-0.116095638589223
12100.06100.299520570010-0.239520570009528
13101.32100.8258565602510.494143439748832
14101.49101.0476156924600.442384307540174
15105.43105.792768014068-0.362768014067527
16105.09103.8066401355241.2833598644761
1799.4899.40974476823250.0702552317675301
18108.53108.2889422070760.241057792924179
19104.34103.2624436935411.07755630645909
20106.1105.6492276356450.450772364354807
21107.35107.2070468595960.142953140404218
22103103.272093169448-0.272093169447541
23104.5104.1426255535260.357374446473547
24105.17104.0650989496251.10490105037461
25104.84104.904628241270-0.0646282412698626
26106.18106.419998536593-0.239998536593377
27108.86108.928693324461-0.068693324461323
28107.77106.3595049581351.41049504186485
29102.74102.7143457692520.0256542307478491
30112.63109.2440097159023.3859902840984
31106.26105.4464459944610.813554005538527
32108.86108.4819676132260.378032386774175
33111.38110.7771087864890.602891213510783
34106.85106.4324406775270.417559322473321
35107.86107.7025405355980.157459464401905
36107.94108.691889393735-0.751889393734923
37111.38111.2179114738020.162088526198271
38111.29111.962864077347-0.672864077347334
39113.72113.5395266513170.180473348682869
40111.88113.49836080668-1.61836080668003
41109.87109.4120455466600.457954453340149
42113.72114.416942428991-0.696942428991389
43111.71113.015101687116-1.30510168711614
44114.81114.0964594915210.713540508478675
45112.05112.685100122646-0.635100122645671
46111.54111.4934372262520.0465627737481058
47110.87111.268738272286-0.398738272286228
48110.87110.983491086630-0.113491086630163
49115.48114.9830867593490.496913240650947
50111.63110.8144408064630.815559193537468
51116.24114.1778007863712.06219921362879
52113.56114.458501787917-0.898501787916705
53106.01106.193046548429-0.183046548429334
54110.45113.327135178478-2.87713517847846
55107.77108.670166398539-0.9001663985392
56108.61108.664688457215-0.0546884572153699
57108.19108.0318365407290.158163459271359


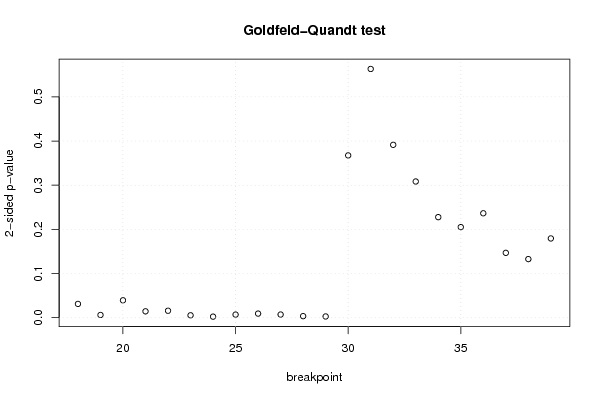
Goldfeld-Quandt test for Heteroskedasticity
p-valuesAlternative Hypothesis
breakpoint indexgreater2-sidedless
180.01563202351338990.03126404702677980.98436797648661
190.003127300668048340.006254601336096690.996872699331952
200.01973792946901860.03947585893803720.980262070530981
210.007269611340143990.01453922268028800.992730388659856
220.007922794006554880.01584558801310980.992077205993445
230.002757479010820160.005514958021640320.99724252098918
240.001228550380293540.002457100760587090.998771449619706
250.003550539681264610.007101079362529230.996449460318735
260.004689183759738490.009378367519476980.995310816240262
270.003613163636918910.007226327273837830.996386836363081
280.001812044796571470.003624089593142940.998187955203429
290.001446932305353610.002893864610707230.998553067694646
300.1837092311371810.3674184622743620.81629076886282
310.2815657457938180.5631314915876360.718434254206182
320.1956944405677510.3913888811355020.80430555943225
330.1541804320586970.3083608641173940.845819567941303
340.1138406212128360.2276812424256720.886159378787164
350.1025722739794820.2051445479589650.897427726020518
360.1182359448535220.2364718897070440.881764055146478
370.07344270333092550.1468854066618510.926557296669074
380.0663568917294430.1327137834588860.933643108270557
390.0897395279302110.1794790558604220.910260472069789

\begin{tabular}{lllllllll}
\hline
Goldfeld-Quandt test for Heteroskedasticity \tabularnewline
p-values & Alternative Hypothesis \tabularnewline
breakpoint index & greater & 2-sided & less \tabularnewline
18 & 0.0156320235133899 & 0.0312640470267798 & 0.98436797648661 \tabularnewline
19 & 0.00312730066804834 & 0.00625460133609669 & 0.996872699331952 \tabularnewline
20 & 0.0197379294690186 & 0.0394758589380372 & 0.980262070530981 \tabularnewline
21 & 0.00726961134014399 & 0.0145392226802880 & 0.992730388659856 \tabularnewline
22 & 0.00792279400655488 & 0.0158455880131098 & 0.992077205993445 \tabularnewline
23 & 0.00275747901082016 & 0.00551495802164032 & 0.99724252098918 \tabularnewline
24 & 0.00122855038029354 & 0.00245710076058709 & 0.998771449619706 \tabularnewline
25 & 0.00355053968126461 & 0.00710107936252923 & 0.996449460318735 \tabularnewline
26 & 0.00468918375973849 & 0.00937836751947698 & 0.995310816240262 \tabularnewline
27 & 0.00361316363691891 & 0.00722632727383783 & 0.996386836363081 \tabularnewline
28 & 0.00181204479657147 & 0.00362408959314294 & 0.998187955203429 \tabularnewline
29 & 0.00144693230535361 & 0.00289386461070723 & 0.998553067694646 \tabularnewline
30 & 0.183709231137181 & 0.367418462274362 & 0.81629076886282 \tabularnewline
31 & 0.281565745793818 & 0.563131491587636 & 0.718434254206182 \tabularnewline
32 & 0.195694440567751 & 0.391388881135502 & 0.80430555943225 \tabularnewline
33 & 0.154180432058697 & 0.308360864117394 & 0.845819567941303 \tabularnewline
34 & 0.113840621212836 & 0.227681242425672 & 0.886159378787164 \tabularnewline
35 & 0.102572273979482 & 0.205144547958965 & 0.897427726020518 \tabularnewline
36 & 0.118235944853522 & 0.236471889707044 & 0.881764055146478 \tabularnewline
37 & 0.0734427033309255 & 0.146885406661851 & 0.926557296669074 \tabularnewline
38 & 0.066356891729443 & 0.132713783458886 & 0.933643108270557 \tabularnewline
39 & 0.089739527930211 & 0.179479055860422 & 0.910260472069789 \tabularnewline
\hline
\end{tabular}
%Source: https://freestatistics.org/blog/index.php?pk=68340&T=5

[TABLE]
[ROW][C]Goldfeld-Quandt test for Heteroskedasticity[/C][/ROW]
[ROW][C]p-values[/C][C]Alternative Hypothesis[/C][/ROW]
[ROW][C]breakpoint index[/C][C]greater[/C][C]2-sided[/C][C]less[/C][/ROW]
[ROW][C]18[/C][C]0.0156320235133899[/C][C]0.0312640470267798[/C][C]0.98436797648661[/C][/ROW]
[ROW][C]19[/C][C]0.00312730066804834[/C][C]0.00625460133609669[/C][C]0.996872699331952[/C][/ROW]
[ROW][C]20[/C][C]0.0197379294690186[/C][C]0.0394758589380372[/C][C]0.980262070530981[/C][/ROW]
[ROW][C]21[/C][C]0.00726961134014399[/C][C]0.0145392226802880[/C][C]0.992730388659856[/C][/ROW]
[ROW][C]22[/C][C]0.00792279400655488[/C][C]0.0158455880131098[/C][C]0.992077205993445[/C][/ROW]
[ROW][C]23[/C][C]0.00275747901082016[/C][C]0.00551495802164032[/C][C]0.99724252098918[/C][/ROW]
[ROW][C]24[/C][C]0.00122855038029354[/C][C]0.00245710076058709[/C][C]0.998771449619706[/C][/ROW]
[ROW][C]25[/C][C]0.00355053968126461[/C][C]0.00710107936252923[/C][C]0.996449460318735[/C][/ROW]
[ROW][C]26[/C][C]0.00468918375973849[/C][C]0.00937836751947698[/C][C]0.995310816240262[/C][/ROW]
[ROW][C]27[/C][C]0.00361316363691891[/C][C]0.00722632727383783[/C][C]0.996386836363081[/C][/ROW]
[ROW][C]28[/C][C]0.00181204479657147[/C][C]0.00362408959314294[/C][C]0.998187955203429[/C][/ROW]
[ROW][C]29[/C][C]0.00144693230535361[/C][C]0.00289386461070723[/C][C]0.998553067694646[/C][/ROW]
[ROW][C]30[/C][C]0.183709231137181[/C][C]0.367418462274362[/C][C]0.81629076886282[/C][/ROW]
[ROW][C]31[/C][C]0.281565745793818[/C][C]0.563131491587636[/C][C]0.718434254206182[/C][/ROW]
[ROW][C]32[/C][C]0.195694440567751[/C][C]0.391388881135502[/C][C]0.80430555943225[/C][/ROW]
[ROW][C]33[/C][C]0.154180432058697[/C][C]0.308360864117394[/C][C]0.845819567941303[/C][/ROW]
[ROW][C]34[/C][C]0.113840621212836[/C][C]0.227681242425672[/C][C]0.886159378787164[/C][/ROW]
[ROW][C]35[/C][C]0.102572273979482[/C][C]0.205144547958965[/C][C]0.897427726020518[/C][/ROW]
[ROW][C]36[/C][C]0.118235944853522[/C][C]0.236471889707044[/C][C]0.881764055146478[/C][/ROW]
[ROW][C]37[/C][C]0.0734427033309255[/C][C]0.146885406661851[/C][C]0.926557296669074[/C][/ROW]
[ROW][C]38[/C][C]0.066356891729443[/C][C]0.132713783458886[/C][C]0.933643108270557[/C][/ROW]
[ROW][C]39[/C][C]0.089739527930211[/C][C]0.179479055860422[/C][C]0.910260472069789[/C][/ROW]
[/TABLE]
Source: https://freestatistics.org/blog/index.php?pk=68340&T=5

Globally Unique Identifier (entire table): ba.freestatistics.org/blog/index.php?pk=68340&T=5

As an alternative you can also use a QR Code:  

The GUIDs for individual cells are displayed in the table below:

Goldfeld-Quandt test for Heteroskedasticity
p-valuesAlternative Hypothesis
breakpoint indexgreater2-sidedless
180.01563202351338990.03126404702677980.98436797648661
190.003127300668048340.006254601336096690.996872699331952
200.01973792946901860.03947585893803720.980262070530981
210.007269611340143990.01453922268028800.992730388659856
220.007922794006554880.01584558801310980.992077205993445
230.002757479010820160.005514958021640320.99724252098918
240.001228550380293540.002457100760587090.998771449619706
250.003550539681264610.007101079362529230.996449460318735
260.004689183759738490.009378367519476980.995310816240262
270.003613163636918910.007226327273837830.996386836363081
280.001812044796571470.003624089593142940.998187955203429
290.001446932305353610.002893864610707230.998553067694646
300.1837092311371810.3674184622743620.81629076886282
310.2815657457938180.5631314915876360.718434254206182
320.1956944405677510.3913888811355020.80430555943225
330.1541804320586970.3083608641173940.845819567941303
340.1138406212128360.2276812424256720.886159378787164
350.1025722739794820.2051445479589650.897427726020518
360.1182359448535220.2364718897070440.881764055146478
370.07344270333092550.1468854066618510.926557296669074
380.0663568917294430.1327137834588860.933643108270557
390.0897395279302110.1794790558604220.910260472069789


Meta Analysis of Goldfeld-Quandt test for Heteroskedasticity
Description# significant tests% significant testsOK/NOK
1% type I error level80.363636363636364NOK
5% type I error level120.545454545454545NOK
10% type I error level120.545454545454545NOK

\begin{tabular}{lllllllll}
\hline
Meta Analysis of Goldfeld-Quandt test for Heteroskedasticity \tabularnewline
Description & # significant tests & % significant tests & OK/NOK \tabularnewline
1% type I error level & 8 & 0.363636363636364 & NOK \tabularnewline
5% type I error level & 12 & 0.545454545454545 & NOK \tabularnewline
10% type I error level & 12 & 0.545454545454545 & NOK \tabularnewline
\hline
\end{tabular}
%Source: https://freestatistics.org/blog/index.php?pk=68340&T=6

[TABLE]
[ROW][C]Meta Analysis of Goldfeld-Quandt test for Heteroskedasticity[/C][/ROW]
[ROW][C]Description[/C][C]# significant tests[/C][C]% significant tests[/C][C]OK/NOK[/C][/ROW]
[ROW][C]1% type I error level[/C][C]8[/C][C]0.363636363636364[/C][C]NOK[/C][/ROW]
[ROW][C]5% type I error level[/C][C]12[/C][C]0.545454545454545[/C][C]NOK[/C][/ROW]
[ROW][C]10% type I error level[/C][C]12[/C][C]0.545454545454545[/C][C]NOK[/C][/ROW]
[/TABLE]
Source: https://freestatistics.org/blog/index.php?pk=68340&T=6

Globally Unique Identifier (entire table): ba.freestatistics.org/blog/index.php?pk=68340&T=6

As an alternative you can also use a QR Code:  

The GUIDs for individual cells are displayed in the table below:

Meta Analysis of Goldfeld-Quandt test for Heteroskedasticity
Description# significant tests% significant testsOK/NOK
1% type I error level80.363636363636364NOK
5% type I error level120.545454545454545NOK
10% type I error level120.545454545454545NOK


Parameters (Session):
par1 = 1 ; par2 = Include Monthly Dummies ; par3 = Linear Trend ;
Parameters (R input):
par1 = 1 ; par2 = Include Monthly Dummies ; par3 = Linear Trend ;
R code (references can be found in the software module):
library(lattice)
library(lmtest)
n25 <- 25 #minimum number of obs. for Goldfeld-Quandt test
par1 <- as.numeric(par1)
x <- t(y)
k <- length(x[1,])
n <- length(x[,1])
x1 <- cbind(x[,par1], x[,1:k!=par1])
mycolnames <- c(colnames(x)[par1], colnames(x)[1:k!=par1])
colnames(x1) <- mycolnames #colnames(x)[par1]
x <- x1
if (par3 == 'First Differences'){
x2 <- array(0, dim=c(n-1,k), dimnames=list(1:(n-1), paste('(1-B)',colnames(x),sep='')))
for (i in 1:n-1) {
for (j in 1:k) {
x2[i,j] <- x[i+1,j] - x[i,j]
}
}
x <- x2
}
if (par2 == 'Include Monthly Dummies'){
x2 <- array(0, dim=c(n,11), dimnames=list(1:n, paste('M', seq(1:11), sep ='')))
for (i in 1:11){
x2[seq(i,n,12),i] <- 1
}
x <- cbind(x, x2)
}
if (par2 == 'Include Quarterly Dummies'){
x2 <- array(0, dim=c(n,3), dimnames=list(1:n, paste('Q', seq(1:3), sep ='')))
for (i in 1:3){
x2[seq(i,n,4),i] <- 1
}
x <- cbind(x, x2)
}
k <- length(x[1,])
if (par3 == 'Linear Trend'){
x <- cbind(x, c(1:n))
colnames(x)[k+1] <- 't'
}
x
k <- length(x[1,])
df <- as.data.frame(x)
(mylm <- lm(df))
(mysum <- summary(mylm))
if (n > n25) {
kp3 <- k + 3
nmkm3 <- n - k - 3
gqarr <- array(NA, dim=c(nmkm3-kp3+1,3))
numgqtests <- 0
numsignificant1 <- 0
numsignificant5 <- 0
numsignificant10 <- 0
for (mypoint in kp3:nmkm3) {
j <- 0
numgqtests <- numgqtests + 1
for (myalt in c('greater', 'two.sided', 'less')) {
j <- j + 1
gqarr[mypoint-kp3+1,j] <- gqtest(mylm, point=mypoint, alternative=myalt)$p.value
}
if (gqarr[mypoint-kp3+1,2] < 0.01) numsignificant1 <- numsignificant1 + 1
if (gqarr[mypoint-kp3+1,2] < 0.05) numsignificant5 <- numsignificant5 + 1
if (gqarr[mypoint-kp3+1,2] < 0.10) numsignificant10 <- numsignificant10 + 1
}
gqarr
}
bitmap(file='test0.png')
plot(x[,1], type='l', main='Actuals and Interpolation', ylab='value of Actuals and Interpolation (dots)', xlab='time or index')
points(x[,1]-mysum$resid)
grid()
dev.off()
bitmap(file='test1.png')
plot(mysum$resid, type='b', pch=19, main='Residuals', ylab='value of Residuals', xlab='time or index')
grid()
dev.off()
bitmap(file='test2.png')
hist(mysum$resid, main='Residual Histogram', xlab='values of Residuals')
grid()
dev.off()
bitmap(file='test3.png')
densityplot(~mysum$resid,col='black',main='Residual Density Plot', xlab='values of Residuals')
dev.off()
bitmap(file='test4.png')
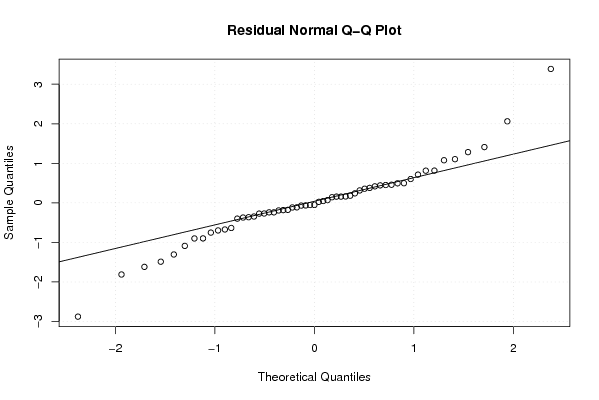
qqnorm(mysum$resid, main='Residual Normal Q-Q Plot')
qqline(mysum$resid)
grid()
dev.off()
(myerror <- as.ts(mysum$resid))
bitmap(file='test5.png')
dum <- cbind(lag(myerror,k=1),myerror)
dum
dum1 <- dum[2:length(myerror),]
dum1
z <- as.data.frame(dum1)
z
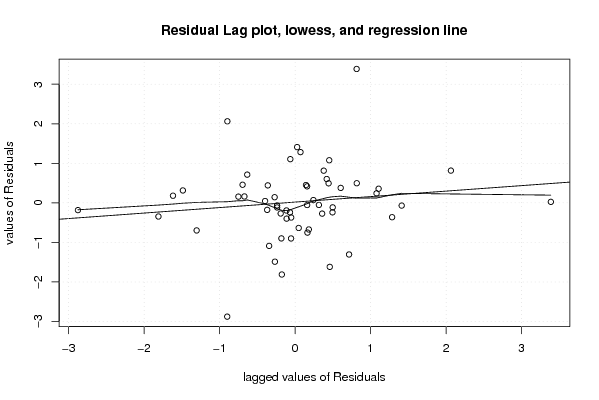
plot(z,main=paste('Residual Lag plot, lowess, and regression line'), ylab='values of Residuals', xlab='lagged values of Residuals')
lines(lowess(z))
abline(lm(z))
grid()
dev.off()
bitmap(file='test6.png')
acf(mysum$resid, lag.max=length(mysum$resid)/2, main='Residual Autocorrelation Function')
grid()
dev.off()
bitmap(file='test7.png')
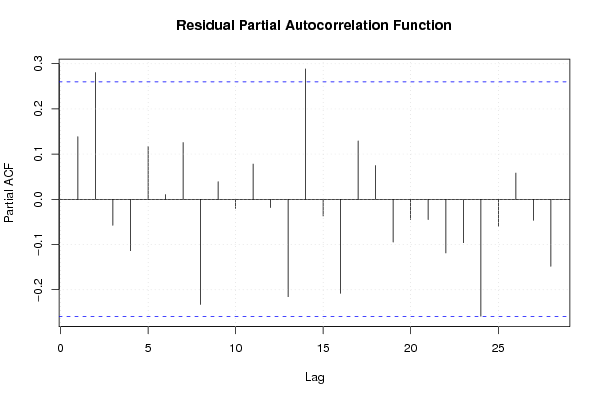
pacf(mysum$resid, lag.max=length(mysum$resid)/2, main='Residual Partial Autocorrelation Function')
grid()
dev.off()
bitmap(file='test8.png')
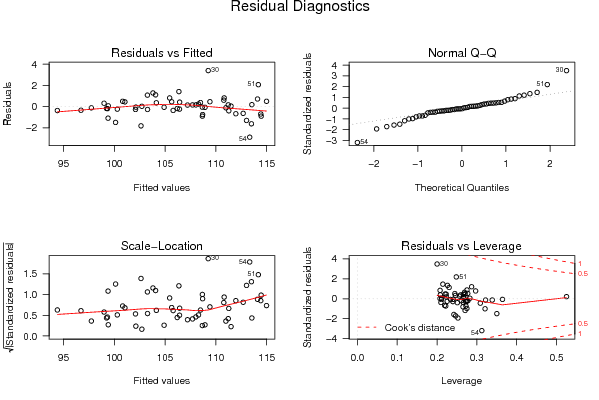
opar <- par(mfrow = c(2,2), oma = c(0, 0, 1.1, 0))
plot(mylm, las = 1, sub='Residual Diagnostics')
par(opar)
dev.off()
if (n > n25) {
bitmap(file='test9.png')
plot(kp3:nmkm3,gqarr[,2], main='Goldfeld-Quandt test',ylab='2-sided p-value',xlab='breakpoint')
grid()
dev.off()
}
load(file='createtable')
a<-table.start()
a<-table.row.start(a)
a<-table.element(a, 'Multiple Linear Regression - Estimated Regression Equation', 1, TRUE)
a<-table.row.end(a)
myeq <- colnames(x)[1]
myeq <- paste(myeq, '[t] = ', sep='')
for (i in 1:k){
if (mysum$coefficients[i,1] > 0) myeq <- paste(myeq, '+', '')
myeq <- paste(myeq, mysum$coefficients[i,1], sep=' ')
if (rownames(mysum$coefficients)[i] != '(Intercept)') {
myeq <- paste(myeq, rownames(mysum$coefficients)[i], sep='')
if (rownames(mysum$coefficients)[i] != 't') myeq <- paste(myeq, '[t]', sep='')
}
}
myeq <- paste(myeq, ' + e[t]')
a<-table.row.start(a)
a<-table.element(a, myeq)
a<-table.row.end(a)
a<-table.end(a)
table.save(a,file='mytable1.tab')
a<-table.start()
a<-table.row.start(a)
a<-table.element(a,hyperlink('ols1.htm','Multiple Linear Regression - Ordinary Least Squares',''), 6, TRUE)
a<-table.row.end(a)
a<-table.row.start(a)
a<-table.element(a,'Variable',header=TRUE)
a<-table.element(a,'Parameter',header=TRUE)
a<-table.element(a,'S.D.',header=TRUE)
a<-table.element(a,'T-STAT
H0: parameter = 0',header=TRUE)
a<-table.element(a,'2-tail p-value',header=TRUE)
a<-table.element(a,'1-tail p-value',header=TRUE)
a<-table.row.end(a)
for (i in 1:k){
a<-table.row.start(a)
a<-table.element(a,rownames(mysum$coefficients)[i],header=TRUE)
a<-table.element(a,mysum$coefficients[i,1])
a<-table.element(a, round(mysum$coefficients[i,2],6))
a<-table.element(a, round(mysum$coefficients[i,3],4))
a<-table.element(a, round(mysum$coefficients[i,4],6))
a<-table.element(a, round(mysum$coefficients[i,4]/2,6))
a<-table.row.end(a)
}
a<-table.end(a)
table.save(a,file='mytable2.tab')
a<-table.start()
a<-table.row.start(a)
a<-table.element(a, 'Multiple Linear Regression - Regression Statistics', 2, TRUE)
a<-table.row.end(a)
a<-table.row.start(a)
a<-table.element(a, 'Multiple R',1,TRUE)
a<-table.element(a, sqrt(mysum$r.squared))
a<-table.row.end(a)
a<-table.row.start(a)
a<-table.element(a, 'R-squared',1,TRUE)
a<-table.element(a, mysum$r.squared)
a<-table.row.end(a)
a<-table.row.start(a)
a<-table.element(a, 'Adjusted R-squared',1,TRUE)
a<-table.element(a, mysum$adj.r.squared)
a<-table.row.end(a)
a<-table.row.start(a)
a<-table.element(a, 'F-TEST (value)',1,TRUE)
a<-table.element(a, mysum$fstatistic[1])
a<-table.row.end(a)
a<-table.row.start(a)
a<-table.element(a, 'F-TEST (DF numerator)',1,TRUE)
a<-table.element(a, mysum$fstatistic[2])
a<-table.row.end(a)
a<-table.row.start(a)
a<-table.element(a, 'F-TEST (DF denominator)',1,TRUE)
a<-table.element(a, mysum$fstatistic[3])
a<-table.row.end(a)
a<-table.row.start(a)
a<-table.element(a, 'p-value',1,TRUE)
a<-table.element(a, 1-pf(mysum$fstatistic[1],mysum$fstatistic[2],mysum$fstatistic[3]))
a<-table.row.end(a)
a<-table.row.start(a)
a<-table.element(a, 'Multiple Linear Regression - Residual Statistics', 2, TRUE)
a<-table.row.end(a)
a<-table.row.start(a)
a<-table.element(a, 'Residual Standard Deviation',1,TRUE)
a<-table.element(a, mysum$sigma)
a<-table.row.end(a)
a<-table.row.start(a)
a<-table.element(a, 'Sum Squared Residuals',1,TRUE)
a<-table.element(a, sum(myerror*myerror))
a<-table.row.end(a)
a<-table.end(a)
table.save(a,file='mytable3.tab')
a<-table.start()
a<-table.row.start(a)
a<-table.element(a, 'Multiple Linear Regression - Actuals, Interpolation, and Residuals', 4, TRUE)
a<-table.row.end(a)
a<-table.row.start(a)
a<-table.element(a, 'Time or Index', 1, TRUE)
a<-table.element(a, 'Actuals', 1, TRUE)
a<-table.element(a, 'Interpolation
Forecast', 1, TRUE)
a<-table.element(a, 'Residuals
Prediction Error', 1, TRUE)
a<-table.row.end(a)
for (i in 1:n) {
a<-table.row.start(a)
a<-table.element(a,i, 1, TRUE)
a<-table.element(a,x[i])
a<-table.element(a,x[i]-mysum$resid[i])
a<-table.element(a,mysum$resid[i])
a<-table.row.end(a)
}
a<-table.end(a)
table.save(a,file='mytable4.tab')
if (n > n25) {
a<-table.start()
a<-table.row.start(a)
a<-table.element(a,'Goldfeld-Quandt test for Heteroskedasticity',4,TRUE)
a<-table.row.end(a)
a<-table.row.start(a)
a<-table.element(a,'p-values',header=TRUE)
a<-table.element(a,'Alternative Hypothesis',3,header=TRUE)
a<-table.row.end(a)
a<-table.row.start(a)
a<-table.element(a,'breakpoint index',header=TRUE)
a<-table.element(a,'greater',header=TRUE)
a<-table.element(a,'2-sided',header=TRUE)
a<-table.element(a,'less',header=TRUE)
a<-table.row.end(a)
for (mypoint in kp3:nmkm3) {
a<-table.row.start(a)
a<-table.element(a,mypoint,header=TRUE)
a<-table.element(a,gqarr[mypoint-kp3+1,1])
a<-table.element(a,gqarr[mypoint-kp3+1,2])
a<-table.element(a,gqarr[mypoint-kp3+1,3])
a<-table.row.end(a)
}
a<-table.end(a)
table.save(a,file='mytable5.tab')
a<-table.start()
a<-table.row.start(a)
a<-table.element(a,'Meta Analysis of Goldfeld-Quandt test for Heteroskedasticity',4,TRUE)
a<-table.row.end(a)
a<-table.row.start(a)
a<-table.element(a,'Description',header=TRUE)
a<-table.element(a,'# significant tests',header=TRUE)
a<-table.element(a,'% significant tests',header=TRUE)
a<-table.element(a,'OK/NOK',header=TRUE)
a<-table.row.end(a)
a<-table.row.start(a)
a<-table.element(a,'1% type I error level',header=TRUE)
a<-table.element(a,numsignificant1)
a<-table.element(a,numsignificant1/numgqtests)
if (numsignificant1/numgqtests < 0.01) dum <- 'OK' else dum <- 'NOK'
a<-table.element(a,dum)
a<-table.row.end(a)
a<-table.row.start(a)
a<-table.element(a,'5% type I error level',header=TRUE)
a<-table.element(a,numsignificant5)
a<-table.element(a,numsignificant5/numgqtests)
if (numsignificant5/numgqtests < 0.05) dum <- 'OK' else dum <- 'NOK'
a<-table.element(a,dum)
a<-table.row.end(a)
a<-table.row.start(a)
a<-table.element(a,'10% type I error level',header=TRUE)
a<-table.element(a,numsignificant10)
a<-table.element(a,numsignificant10/numgqtests)
if (numsignificant10/numgqtests < 0.1) dum <- 'OK' else dum <- 'NOK'
a<-table.element(a,dum)
a<-table.row.end(a)
a<-table.end(a)
table.save(a,file='mytable6.tab')
}