Free Statistics

of Irreproducible Research!

Author's title

Author*The author of this computation has been verified*
R Software Modulerwasp_multipleregression.wasp
Title produced by softwareMultiple Regression
Date of computationTue, 15 Dec 2009 11:47:48 -0700
Cite this page as followsStatistical Computations at FreeStatistics.org, Office for Research Development and Education, URL https://freestatistics.org/blog/index.php?v=date/2009/Dec/15/t1260903434e2a4421cjqd736i.htm/, Retrieved Mon, 29 Apr 2024 05:45:58 +0000
Statistical Computations at FreeStatistics.org, Office for Research Development and Education, URL https://freestatistics.org/blog/index.php?pk=68075, Retrieved Mon, 29 Apr 2024 05:45:58 +0000
QR Codes:

Original text written by user:
IsPrivate?No (this computation is public)
User-defined keywords
Estimated Impact106
Family? (F = Feedback message, R = changed R code, M = changed R Module, P = changed Parameters, D = changed Data)
-     [Multiple Regression] [Q1 The Seatbeltlaw] [2007-11-14 19:27:43] [8cd6641b921d30ebe00b648d1481bba0]
- RMPD  [Multiple Regression] [Seatbelt] [2009-11-12 14:03:14] [b98453cac15ba1066b407e146608df68]
-    D    [Multiple Regression] [] [2009-11-20 18:17:33] [4b0ddbda2a8eb8bbc60159112cb39d44]
-    D        [Multiple Regression] [] [2009-12-15 18:47:48] [8cd69d0f4298074aa572ca2f9b39b6ae] [Current]
Feedback Forum

Post a new message
Dataseries X:
564	-0.9
581	-1
597	-0.7
587	-1.7
536	-1
524	-0.2
537	0.7
536	0.6
533	1.9
528	2.1
516	2.7
502	3.2
506	4.8
518	5.5
534	5.4
528	5.9
478	5.8
469	5.1
490	4.1
493	4.4
508	3.6
517	3.5
514	3.1
510	2.9
527	2.2
542	1.4
565	1.2
555	1.3
499	1.3
511	1.3
526	1.8
532	1.8
549	1.8
561	1.7
557	2.1
566	2
588	1.7
620	1.9
626	2.3
620	2.4
573	2.5
573	2.8
574	2.6
580	2.2
590	2.8
593	2.8
597	2.8
595	2.3
612	2.2
628	3
629	2.9
621	2.7
569	2.7
567	2.3
573	2.4
584	2.8
589	2.3
591	2
595	1.9
594	2.3


Summary of computational transaction
Raw Inputview raw input (R code)
Raw Outputview raw output of R engine
Computing time4 seconds
R Server'Gwilym Jenkins' @ 72.249.127.135

\begin{tabular}{lllllllll}
\hline
Summary of computational transaction \tabularnewline
Raw Input & view raw input (R code)  \tabularnewline
Raw Output & view raw output of R engine  \tabularnewline
Computing time & 4 seconds \tabularnewline
R Server & 'Gwilym Jenkins' @ 72.249.127.135 \tabularnewline
\hline
\end{tabular}
%Source: https://freestatistics.org/blog/index.php?pk=68075&T=0

[TABLE]
[ROW][C]Summary of computational transaction[/C][/ROW]
[ROW][C]Raw Input[/C][C]view raw input (R code) [/C][/ROW]
[ROW][C]Raw Output[/C][C]view raw output of R engine [/C][/ROW]
[ROW][C]Computing time[/C][C]4 seconds[/C][/ROW]
[ROW][C]R Server[/C][C]'Gwilym Jenkins' @ 72.249.127.135[/C][/ROW]
[/TABLE]
Source: https://freestatistics.org/blog/index.php?pk=68075&T=0

Globally Unique Identifier (entire table): ba.freestatistics.org/blog/index.php?pk=68075&T=0

As an alternative you can also use a QR Code:  

The GUIDs for individual cells are displayed in the table below:

Summary of computational transaction
Raw Inputview raw input (R code)
Raw Outputview raw output of R engine
Computing time4 seconds
R Server'Gwilym Jenkins' @ 72.249.127.135


Multiple Linear Regression - Estimated Regression Equation
Y[t] = + 574.162403631772 -8.1741746581782X[t] + 1.58594568458370M1[t] + 21.2938136298923M2[t] + 34.184264109383M3[t] + 25.3668466435652M4[t] -24.6887689042899M5[t] -26.8887689042899M6[t] -15.1983184247992M7[t] -9.87135143847206M8[t] -0.090450479490666M9[t] + 3.61909904101863M10[t] + 2.23651650683645M11[t] + e[t]

\begin{tabular}{lllllllll}
\hline
Multiple Linear Regression - Estimated Regression Equation \tabularnewline
Y[t] =  +  574.162403631772 -8.1741746581782X[t] +  1.58594568458370M1[t] +  21.2938136298923M2[t] +  34.184264109383M3[t] +  25.3668466435652M4[t] -24.6887689042899M5[t] -26.8887689042899M6[t] -15.1983184247992M7[t] -9.87135143847206M8[t] -0.090450479490666M9[t] +  3.61909904101863M10[t] +  2.23651650683645M11[t]  + e[t] \tabularnewline
\hline
\end{tabular}
%Source: https://freestatistics.org/blog/index.php?pk=68075&T=1

[TABLE]
[ROW][C]Multiple Linear Regression - Estimated Regression Equation[/C][/ROW]
[ROW][C]Y[t] =  +  574.162403631772 -8.1741746581782X[t] +  1.58594568458370M1[t] +  21.2938136298923M2[t] +  34.184264109383M3[t] +  25.3668466435652M4[t] -24.6887689042899M5[t] -26.8887689042899M6[t] -15.1983184247992M7[t] -9.87135143847206M8[t] -0.090450479490666M9[t] +  3.61909904101863M10[t] +  2.23651650683645M11[t]  + e[t][/C][/ROW]
[/TABLE]
Source: https://freestatistics.org/blog/index.php?pk=68075&T=1

Globally Unique Identifier (entire table): ba.freestatistics.org/blog/index.php?pk=68075&T=1

As an alternative you can also use a QR Code:  

The GUIDs for individual cells are displayed in the table below:

Multiple Linear Regression - Estimated Regression Equation
Y[t] = + 574.162403631772 -8.1741746581782X[t] + 1.58594568458370M1[t] + 21.2938136298923M2[t] + 34.184264109383M3[t] + 25.3668466435652M4[t] -24.6887689042899M5[t] -26.8887689042899M6[t] -15.1983184247992M7[t] -9.87135143847206M8[t] -0.090450479490666M9[t] + 3.61909904101863M10[t] + 2.23651650683645M11[t] + e[t]


Multiple Linear Regression - Ordinary Least Squares
VariableParameterS.D.T-STATH0: parameter = 02-tail p-value1-tail p-value
(Intercept)574.16240363177218.9918430.232100
X-8.17417465817823.155104-2.59080.0127140.006357
M11.5859456845837024.4097420.0650.9484720.474236
M221.293813629892324.3797080.87340.3868730.193437
M334.18426410938324.3711321.40270.1672910.083646
M425.366846643565224.3862411.04020.3035630.151782
M5-24.688768904289924.36623-1.01320.3161350.158067
M6-26.888768904289924.36623-1.10350.2754170.137708
M7-15.198318424799224.360101-0.62390.5357080.267854
M8-9.8713514384720624.356832-0.40530.687110.343555
M9-0.09045047949066624.350946-0.00370.9970520.498526
M103.6190990410186324.3531530.14860.8824980.441249
M112.2365165068364524.3502920.09180.9272090.463605

\begin{tabular}{lllllllll}
\hline
Multiple Linear Regression - Ordinary Least Squares \tabularnewline
Variable & Parameter & S.D. & T-STATH0: parameter = 0 & 2-tail p-value & 1-tail p-value \tabularnewline
(Intercept) & 574.162403631772 & 18.99184 & 30.2321 & 0 & 0 \tabularnewline
X & -8.1741746581782 & 3.155104 & -2.5908 & 0.012714 & 0.006357 \tabularnewline
M1 & 1.58594568458370 & 24.409742 & 0.065 & 0.948472 & 0.474236 \tabularnewline
M2 & 21.2938136298923 & 24.379708 & 0.8734 & 0.386873 & 0.193437 \tabularnewline
M3 & 34.184264109383 & 24.371132 & 1.4027 & 0.167291 & 0.083646 \tabularnewline
M4 & 25.3668466435652 & 24.386241 & 1.0402 & 0.303563 & 0.151782 \tabularnewline
M5 & -24.6887689042899 & 24.36623 & -1.0132 & 0.316135 & 0.158067 \tabularnewline
M6 & -26.8887689042899 & 24.36623 & -1.1035 & 0.275417 & 0.137708 \tabularnewline
M7 & -15.1983184247992 & 24.360101 & -0.6239 & 0.535708 & 0.267854 \tabularnewline
M8 & -9.87135143847206 & 24.356832 & -0.4053 & 0.68711 & 0.343555 \tabularnewline
M9 & -0.090450479490666 & 24.350946 & -0.0037 & 0.997052 & 0.498526 \tabularnewline
M10 & 3.61909904101863 & 24.353153 & 0.1486 & 0.882498 & 0.441249 \tabularnewline
M11 & 2.23651650683645 & 24.350292 & 0.0918 & 0.927209 & 0.463605 \tabularnewline
\hline
\end{tabular}
%Source: https://freestatistics.org/blog/index.php?pk=68075&T=2

[TABLE]
[ROW][C]Multiple Linear Regression - Ordinary Least Squares[/C][/ROW]
[ROW][C]Variable[/C][C]Parameter[/C][C]S.D.[/C][C]T-STATH0: parameter = 0[/C][C]2-tail p-value[/C][C]1-tail p-value[/C][/ROW]
[ROW][C](Intercept)[/C][C]574.162403631772[/C][C]18.99184[/C][C]30.2321[/C][C]0[/C][C]0[/C][/ROW]
[ROW][C]X[/C][C]-8.1741746581782[/C][C]3.155104[/C][C]-2.5908[/C][C]0.012714[/C][C]0.006357[/C][/ROW]
[ROW][C]M1[/C][C]1.58594568458370[/C][C]24.409742[/C][C]0.065[/C][C]0.948472[/C][C]0.474236[/C][/ROW]
[ROW][C]M2[/C][C]21.2938136298923[/C][C]24.379708[/C][C]0.8734[/C][C]0.386873[/C][C]0.193437[/C][/ROW]
[ROW][C]M3[/C][C]34.184264109383[/C][C]24.371132[/C][C]1.4027[/C][C]0.167291[/C][C]0.083646[/C][/ROW]
[ROW][C]M4[/C][C]25.3668466435652[/C][C]24.386241[/C][C]1.0402[/C][C]0.303563[/C][C]0.151782[/C][/ROW]
[ROW][C]M5[/C][C]-24.6887689042899[/C][C]24.36623[/C][C]-1.0132[/C][C]0.316135[/C][C]0.158067[/C][/ROW]
[ROW][C]M6[/C][C]-26.8887689042899[/C][C]24.36623[/C][C]-1.1035[/C][C]0.275417[/C][C]0.137708[/C][/ROW]
[ROW][C]M7[/C][C]-15.1983184247992[/C][C]24.360101[/C][C]-0.6239[/C][C]0.535708[/C][C]0.267854[/C][/ROW]
[ROW][C]M8[/C][C]-9.87135143847206[/C][C]24.356832[/C][C]-0.4053[/C][C]0.68711[/C][C]0.343555[/C][/ROW]
[ROW][C]M9[/C][C]-0.090450479490666[/C][C]24.350946[/C][C]-0.0037[/C][C]0.997052[/C][C]0.498526[/C][/ROW]
[ROW][C]M10[/C][C]3.61909904101863[/C][C]24.353153[/C][C]0.1486[/C][C]0.882498[/C][C]0.441249[/C][/ROW]
[ROW][C]M11[/C][C]2.23651650683645[/C][C]24.350292[/C][C]0.0918[/C][C]0.927209[/C][C]0.463605[/C][/ROW]
[/TABLE]
Source: https://freestatistics.org/blog/index.php?pk=68075&T=2

Globally Unique Identifier (entire table): ba.freestatistics.org/blog/index.php?pk=68075&T=2

As an alternative you can also use a QR Code:  

The GUIDs for individual cells are displayed in the table below:

Multiple Linear Regression - Ordinary Least Squares
VariableParameterS.D.T-STATH0: parameter = 02-tail p-value1-tail p-value
(Intercept)574.16240363177218.9918430.232100
X-8.17417465817823.155104-2.59080.0127140.006357
M11.5859456845837024.4097420.0650.9484720.474236
M221.293813629892324.3797080.87340.3868730.193437
M334.18426410938324.3711321.40270.1672910.083646
M425.366846643565224.3862411.04020.3035630.151782
M5-24.688768904289924.36623-1.01320.3161350.158067
M6-26.888768904289924.36623-1.10350.2754170.137708
M7-15.198318424799224.360101-0.62390.5357080.267854
M8-9.8713514384720624.356832-0.40530.687110.343555
M9-0.09045047949066624.350946-0.00370.9970520.498526
M103.6190990410186324.3531530.14860.8824980.441249
M112.2365165068364524.3502920.09180.9272090.463605


Multiple Linear Regression - Regression Statistics
Multiple R0.551464014387481
R-squared0.304112559164356
Adjusted R-squared0.126439170014830
F-TEST (value)1.71163819534292
F-TEST (DF numerator)12
F-TEST (DF denominator)47
p-value0.094537415037612
Multiple Linear Regression - Residual Statistics
Residual Standard Deviation38.5010623246821
Sum Squared Residuals69669.5946060655

\begin{tabular}{lllllllll}
\hline
Multiple Linear Regression - Regression Statistics \tabularnewline
Multiple R & 0.551464014387481 \tabularnewline
R-squared & 0.304112559164356 \tabularnewline
Adjusted R-squared & 0.126439170014830 \tabularnewline
F-TEST (value) & 1.71163819534292 \tabularnewline
F-TEST (DF numerator) & 12 \tabularnewline
F-TEST (DF denominator) & 47 \tabularnewline
p-value & 0.094537415037612 \tabularnewline
Multiple Linear Regression - Residual Statistics \tabularnewline
Residual Standard Deviation & 38.5010623246821 \tabularnewline
Sum Squared Residuals & 69669.5946060655 \tabularnewline
\hline
\end{tabular}
%Source: https://freestatistics.org/blog/index.php?pk=68075&T=3

[TABLE]
[ROW][C]Multiple Linear Regression - Regression Statistics[/C][/ROW]
[ROW][C]Multiple R[/C][C]0.551464014387481[/C][/ROW]
[ROW][C]R-squared[/C][C]0.304112559164356[/C][/ROW]
[ROW][C]Adjusted R-squared[/C][C]0.126439170014830[/C][/ROW]
[ROW][C]F-TEST (value)[/C][C]1.71163819534292[/C][/ROW]
[ROW][C]F-TEST (DF numerator)[/C][C]12[/C][/ROW]
[ROW][C]F-TEST (DF denominator)[/C][C]47[/C][/ROW]
[ROW][C]p-value[/C][C]0.094537415037612[/C][/ROW]
[ROW][C]Multiple Linear Regression - Residual Statistics[/C][/ROW]
[ROW][C]Residual Standard Deviation[/C][C]38.5010623246821[/C][/ROW]
[ROW][C]Sum Squared Residuals[/C][C]69669.5946060655[/C][/ROW]
[/TABLE]
Source: https://freestatistics.org/blog/index.php?pk=68075&T=3

Globally Unique Identifier (entire table): ba.freestatistics.org/blog/index.php?pk=68075&T=3

As an alternative you can also use a QR Code:  

The GUIDs for individual cells are displayed in the table below:

Multiple Linear Regression - Regression Statistics
Multiple R0.551464014387481
R-squared0.304112559164356
Adjusted R-squared0.126439170014830
F-TEST (value)1.71163819534292
F-TEST (DF numerator)12
F-TEST (DF denominator)47
p-value0.094537415037612
Multiple Linear Regression - Residual Statistics
Residual Standard Deviation38.5010623246821
Sum Squared Residuals69669.5946060655


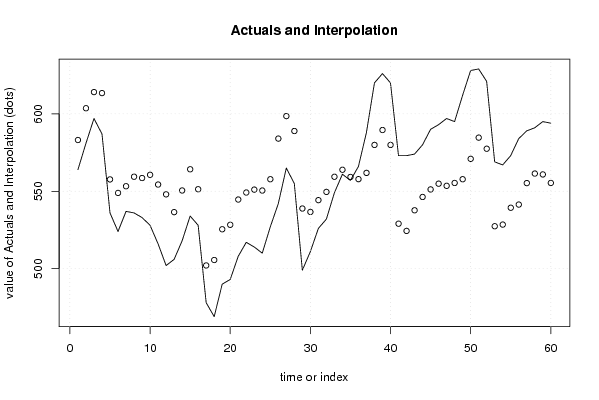
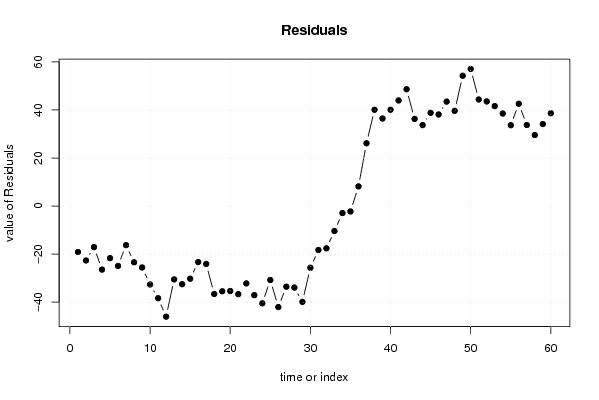
Multiple Linear Regression - Actuals, Interpolation, and Residuals
Time or IndexActualsInterpolationForecastResidualsPrediction Error
1564583.105106508717-19.1051065087171
2581603.630391919843-22.6303919198431
3597614.06859000188-17.0685900018803
4587613.425347194241-26.4253471942407
5536557.647809385661-21.6478093856610
6524548.908469659118-24.9084696591184
7537553.242162946249-16.2421629462487
8536559.386547398394-23.3865473983936
9533558.541021301743-25.5410213017433
10528560.615735890617-32.615735890617
11516554.328648561528-38.3286485615279
12502548.005044725602-46.0050447256024
13506536.512310957101-30.512310957101
14518550.498256641685-32.4982566416848
15534564.206124586993-30.2061245869933
16528551.301619792086-23.3016197920864
17478502.063421710049-24.0634217100492
18469505.585343970774-36.5853439707739
19490525.449969108443-35.4499691084428
20493528.324683697316-35.3246836973165
21508544.64492438284-36.6449243828404
22517549.171891369167-32.1718913691675
23514551.058978698257-37.0589786982567
24510550.457297123056-40.4572971230559
25527557.765165068364-30.7651650683643
26542584.012372740215-42.0123727402154
27565598.537658151342-33.5376581513417
28555588.902823219706-33.9028232197061
29499538.847207671851-39.847207671851
30511536.647207671851-25.6472076718511
31526544.250570822253-18.2505708222527
32532549.57753780858-17.5775378085798
33549559.358438767561-10.3584387675612
34561563.885405753888-2.8854057538883
35557559.233153356435-2.23315335643485
36566557.8140543154168.18594568458379
37588561.85225239745326.1477476025466
38620579.92528541112640.0747145888737
39626589.54606602734636.4539339726543
40620579.9112310957140.0887689042899
41573529.03819808203743.9618019179628
42573524.38594568458448.6140543154162
43574537.7112310957136.2887689042899
44580546.30786794530933.6921320546915
45590551.18426410938338.815735890617
46593554.89381362989238.1061863701077
47597553.5112310957143.4887689042899
48595555.36180191796339.6381980820372
49612557.76516506836454.2348349316357
50628570.9336932871357.0663067128697
51629584.64156123243944.3584387675612
52621577.45897869825743.5410213017433
53569527.40336315040241.5966368495984
54567528.47303301367338.5269669863271
55573539.34606602734633.6539339726543
56584541.40336315040242.5966368495984
57589555.27135143847233.7286485615279
58591561.43315335643529.5668466435652
59595560.8679882880734.1320117119295
60594555.36180191796338.6381980820372

\begin{tabular}{lllllllll}
\hline
Multiple Linear Regression - Actuals, Interpolation, and Residuals \tabularnewline
Time or Index & Actuals & InterpolationForecast & ResidualsPrediction Error \tabularnewline
1 & 564 & 583.105106508717 & -19.1051065087171 \tabularnewline
2 & 581 & 603.630391919843 & -22.6303919198431 \tabularnewline
3 & 597 & 614.06859000188 & -17.0685900018803 \tabularnewline
4 & 587 & 613.425347194241 & -26.4253471942407 \tabularnewline
5 & 536 & 557.647809385661 & -21.6478093856610 \tabularnewline
6 & 524 & 548.908469659118 & -24.9084696591184 \tabularnewline
7 & 537 & 553.242162946249 & -16.2421629462487 \tabularnewline
8 & 536 & 559.386547398394 & -23.3865473983936 \tabularnewline
9 & 533 & 558.541021301743 & -25.5410213017433 \tabularnewline
10 & 528 & 560.615735890617 & -32.615735890617 \tabularnewline
11 & 516 & 554.328648561528 & -38.3286485615279 \tabularnewline
12 & 502 & 548.005044725602 & -46.0050447256024 \tabularnewline
13 & 506 & 536.512310957101 & -30.512310957101 \tabularnewline
14 & 518 & 550.498256641685 & -32.4982566416848 \tabularnewline
15 & 534 & 564.206124586993 & -30.2061245869933 \tabularnewline
16 & 528 & 551.301619792086 & -23.3016197920864 \tabularnewline
17 & 478 & 502.063421710049 & -24.0634217100492 \tabularnewline
18 & 469 & 505.585343970774 & -36.5853439707739 \tabularnewline
19 & 490 & 525.449969108443 & -35.4499691084428 \tabularnewline
20 & 493 & 528.324683697316 & -35.3246836973165 \tabularnewline
21 & 508 & 544.64492438284 & -36.6449243828404 \tabularnewline
22 & 517 & 549.171891369167 & -32.1718913691675 \tabularnewline
23 & 514 & 551.058978698257 & -37.0589786982567 \tabularnewline
24 & 510 & 550.457297123056 & -40.4572971230559 \tabularnewline
25 & 527 & 557.765165068364 & -30.7651650683643 \tabularnewline
26 & 542 & 584.012372740215 & -42.0123727402154 \tabularnewline
27 & 565 & 598.537658151342 & -33.5376581513417 \tabularnewline
28 & 555 & 588.902823219706 & -33.9028232197061 \tabularnewline
29 & 499 & 538.847207671851 & -39.847207671851 \tabularnewline
30 & 511 & 536.647207671851 & -25.6472076718511 \tabularnewline
31 & 526 & 544.250570822253 & -18.2505708222527 \tabularnewline
32 & 532 & 549.57753780858 & -17.5775378085798 \tabularnewline
33 & 549 & 559.358438767561 & -10.3584387675612 \tabularnewline
34 & 561 & 563.885405753888 & -2.8854057538883 \tabularnewline
35 & 557 & 559.233153356435 & -2.23315335643485 \tabularnewline
36 & 566 & 557.814054315416 & 8.18594568458379 \tabularnewline
37 & 588 & 561.852252397453 & 26.1477476025466 \tabularnewline
38 & 620 & 579.925285411126 & 40.0747145888737 \tabularnewline
39 & 626 & 589.546066027346 & 36.4539339726543 \tabularnewline
40 & 620 & 579.91123109571 & 40.0887689042899 \tabularnewline
41 & 573 & 529.038198082037 & 43.9618019179628 \tabularnewline
42 & 573 & 524.385945684584 & 48.6140543154162 \tabularnewline
43 & 574 & 537.71123109571 & 36.2887689042899 \tabularnewline
44 & 580 & 546.307867945309 & 33.6921320546915 \tabularnewline
45 & 590 & 551.184264109383 & 38.815735890617 \tabularnewline
46 & 593 & 554.893813629892 & 38.1061863701077 \tabularnewline
47 & 597 & 553.51123109571 & 43.4887689042899 \tabularnewline
48 & 595 & 555.361801917963 & 39.6381980820372 \tabularnewline
49 & 612 & 557.765165068364 & 54.2348349316357 \tabularnewline
50 & 628 & 570.93369328713 & 57.0663067128697 \tabularnewline
51 & 629 & 584.641561232439 & 44.3584387675612 \tabularnewline
52 & 621 & 577.458978698257 & 43.5410213017433 \tabularnewline
53 & 569 & 527.403363150402 & 41.5966368495984 \tabularnewline
54 & 567 & 528.473033013673 & 38.5269669863271 \tabularnewline
55 & 573 & 539.346066027346 & 33.6539339726543 \tabularnewline
56 & 584 & 541.403363150402 & 42.5966368495984 \tabularnewline
57 & 589 & 555.271351438472 & 33.7286485615279 \tabularnewline
58 & 591 & 561.433153356435 & 29.5668466435652 \tabularnewline
59 & 595 & 560.86798828807 & 34.1320117119295 \tabularnewline
60 & 594 & 555.361801917963 & 38.6381980820372 \tabularnewline
\hline
\end{tabular}
%Source: https://freestatistics.org/blog/index.php?pk=68075&T=4

[TABLE]
[ROW][C]Multiple Linear Regression - Actuals, Interpolation, and Residuals[/C][/ROW]
[ROW][C]Time or Index[/C][C]Actuals[/C][C]InterpolationForecast[/C][C]ResidualsPrediction Error[/C][/ROW]
[ROW][C]1[/C][C]564[/C][C]583.105106508717[/C][C]-19.1051065087171[/C][/ROW]
[ROW][C]2[/C][C]581[/C][C]603.630391919843[/C][C]-22.6303919198431[/C][/ROW]
[ROW][C]3[/C][C]597[/C][C]614.06859000188[/C][C]-17.0685900018803[/C][/ROW]
[ROW][C]4[/C][C]587[/C][C]613.425347194241[/C][C]-26.4253471942407[/C][/ROW]
[ROW][C]5[/C][C]536[/C][C]557.647809385661[/C][C]-21.6478093856610[/C][/ROW]
[ROW][C]6[/C][C]524[/C][C]548.908469659118[/C][C]-24.9084696591184[/C][/ROW]
[ROW][C]7[/C][C]537[/C][C]553.242162946249[/C][C]-16.2421629462487[/C][/ROW]
[ROW][C]8[/C][C]536[/C][C]559.386547398394[/C][C]-23.3865473983936[/C][/ROW]
[ROW][C]9[/C][C]533[/C][C]558.541021301743[/C][C]-25.5410213017433[/C][/ROW]
[ROW][C]10[/C][C]528[/C][C]560.615735890617[/C][C]-32.615735890617[/C][/ROW]
[ROW][C]11[/C][C]516[/C][C]554.328648561528[/C][C]-38.3286485615279[/C][/ROW]
[ROW][C]12[/C][C]502[/C][C]548.005044725602[/C][C]-46.0050447256024[/C][/ROW]
[ROW][C]13[/C][C]506[/C][C]536.512310957101[/C][C]-30.512310957101[/C][/ROW]
[ROW][C]14[/C][C]518[/C][C]550.498256641685[/C][C]-32.4982566416848[/C][/ROW]
[ROW][C]15[/C][C]534[/C][C]564.206124586993[/C][C]-30.2061245869933[/C][/ROW]
[ROW][C]16[/C][C]528[/C][C]551.301619792086[/C][C]-23.3016197920864[/C][/ROW]
[ROW][C]17[/C][C]478[/C][C]502.063421710049[/C][C]-24.0634217100492[/C][/ROW]
[ROW][C]18[/C][C]469[/C][C]505.585343970774[/C][C]-36.5853439707739[/C][/ROW]
[ROW][C]19[/C][C]490[/C][C]525.449969108443[/C][C]-35.4499691084428[/C][/ROW]
[ROW][C]20[/C][C]493[/C][C]528.324683697316[/C][C]-35.3246836973165[/C][/ROW]
[ROW][C]21[/C][C]508[/C][C]544.64492438284[/C][C]-36.6449243828404[/C][/ROW]
[ROW][C]22[/C][C]517[/C][C]549.171891369167[/C][C]-32.1718913691675[/C][/ROW]
[ROW][C]23[/C][C]514[/C][C]551.058978698257[/C][C]-37.0589786982567[/C][/ROW]
[ROW][C]24[/C][C]510[/C][C]550.457297123056[/C][C]-40.4572971230559[/C][/ROW]
[ROW][C]25[/C][C]527[/C][C]557.765165068364[/C][C]-30.7651650683643[/C][/ROW]
[ROW][C]26[/C][C]542[/C][C]584.012372740215[/C][C]-42.0123727402154[/C][/ROW]
[ROW][C]27[/C][C]565[/C][C]598.537658151342[/C][C]-33.5376581513417[/C][/ROW]
[ROW][C]28[/C][C]555[/C][C]588.902823219706[/C][C]-33.9028232197061[/C][/ROW]
[ROW][C]29[/C][C]499[/C][C]538.847207671851[/C][C]-39.847207671851[/C][/ROW]
[ROW][C]30[/C][C]511[/C][C]536.647207671851[/C][C]-25.6472076718511[/C][/ROW]
[ROW][C]31[/C][C]526[/C][C]544.250570822253[/C][C]-18.2505708222527[/C][/ROW]
[ROW][C]32[/C][C]532[/C][C]549.57753780858[/C][C]-17.5775378085798[/C][/ROW]
[ROW][C]33[/C][C]549[/C][C]559.358438767561[/C][C]-10.3584387675612[/C][/ROW]
[ROW][C]34[/C][C]561[/C][C]563.885405753888[/C][C]-2.8854057538883[/C][/ROW]
[ROW][C]35[/C][C]557[/C][C]559.233153356435[/C][C]-2.23315335643485[/C][/ROW]
[ROW][C]36[/C][C]566[/C][C]557.814054315416[/C][C]8.18594568458379[/C][/ROW]
[ROW][C]37[/C][C]588[/C][C]561.852252397453[/C][C]26.1477476025466[/C][/ROW]
[ROW][C]38[/C][C]620[/C][C]579.925285411126[/C][C]40.0747145888737[/C][/ROW]
[ROW][C]39[/C][C]626[/C][C]589.546066027346[/C][C]36.4539339726543[/C][/ROW]
[ROW][C]40[/C][C]620[/C][C]579.91123109571[/C][C]40.0887689042899[/C][/ROW]
[ROW][C]41[/C][C]573[/C][C]529.038198082037[/C][C]43.9618019179628[/C][/ROW]
[ROW][C]42[/C][C]573[/C][C]524.385945684584[/C][C]48.6140543154162[/C][/ROW]
[ROW][C]43[/C][C]574[/C][C]537.71123109571[/C][C]36.2887689042899[/C][/ROW]
[ROW][C]44[/C][C]580[/C][C]546.307867945309[/C][C]33.6921320546915[/C][/ROW]
[ROW][C]45[/C][C]590[/C][C]551.184264109383[/C][C]38.815735890617[/C][/ROW]
[ROW][C]46[/C][C]593[/C][C]554.893813629892[/C][C]38.1061863701077[/C][/ROW]
[ROW][C]47[/C][C]597[/C][C]553.51123109571[/C][C]43.4887689042899[/C][/ROW]
[ROW][C]48[/C][C]595[/C][C]555.361801917963[/C][C]39.6381980820372[/C][/ROW]
[ROW][C]49[/C][C]612[/C][C]557.765165068364[/C][C]54.2348349316357[/C][/ROW]
[ROW][C]50[/C][C]628[/C][C]570.93369328713[/C][C]57.0663067128697[/C][/ROW]
[ROW][C]51[/C][C]629[/C][C]584.641561232439[/C][C]44.3584387675612[/C][/ROW]
[ROW][C]52[/C][C]621[/C][C]577.458978698257[/C][C]43.5410213017433[/C][/ROW]
[ROW][C]53[/C][C]569[/C][C]527.403363150402[/C][C]41.5966368495984[/C][/ROW]
[ROW][C]54[/C][C]567[/C][C]528.473033013673[/C][C]38.5269669863271[/C][/ROW]
[ROW][C]55[/C][C]573[/C][C]539.346066027346[/C][C]33.6539339726543[/C][/ROW]
[ROW][C]56[/C][C]584[/C][C]541.403363150402[/C][C]42.5966368495984[/C][/ROW]
[ROW][C]57[/C][C]589[/C][C]555.271351438472[/C][C]33.7286485615279[/C][/ROW]
[ROW][C]58[/C][C]591[/C][C]561.433153356435[/C][C]29.5668466435652[/C][/ROW]
[ROW][C]59[/C][C]595[/C][C]560.86798828807[/C][C]34.1320117119295[/C][/ROW]
[ROW][C]60[/C][C]594[/C][C]555.361801917963[/C][C]38.6381980820372[/C][/ROW]
[/TABLE]
Source: https://freestatistics.org/blog/index.php?pk=68075&T=4

Globally Unique Identifier (entire table): ba.freestatistics.org/blog/index.php?pk=68075&T=4

As an alternative you can also use a QR Code:  

The GUIDs for individual cells are displayed in the table below:

Multiple Linear Regression - Actuals, Interpolation, and Residuals
Time or IndexActualsInterpolationForecastResidualsPrediction Error
1564583.105106508717-19.1051065087171
2581603.630391919843-22.6303919198431
3597614.06859000188-17.0685900018803
4587613.425347194241-26.4253471942407
5536557.647809385661-21.6478093856610
6524548.908469659118-24.9084696591184
7537553.242162946249-16.2421629462487
8536559.386547398394-23.3865473983936
9533558.541021301743-25.5410213017433
10528560.615735890617-32.615735890617
11516554.328648561528-38.3286485615279
12502548.005044725602-46.0050447256024
13506536.512310957101-30.512310957101
14518550.498256641685-32.4982566416848
15534564.206124586993-30.2061245869933
16528551.301619792086-23.3016197920864
17478502.063421710049-24.0634217100492
18469505.585343970774-36.5853439707739
19490525.449969108443-35.4499691084428
20493528.324683697316-35.3246836973165
21508544.64492438284-36.6449243828404
22517549.171891369167-32.1718913691675
23514551.058978698257-37.0589786982567
24510550.457297123056-40.4572971230559
25527557.765165068364-30.7651650683643
26542584.012372740215-42.0123727402154
27565598.537658151342-33.5376581513417
28555588.902823219706-33.9028232197061
29499538.847207671851-39.847207671851
30511536.647207671851-25.6472076718511
31526544.250570822253-18.2505708222527
32532549.57753780858-17.5775378085798
33549559.358438767561-10.3584387675612
34561563.885405753888-2.8854057538883
35557559.233153356435-2.23315335643485
36566557.8140543154168.18594568458379
37588561.85225239745326.1477476025466
38620579.92528541112640.0747145888737
39626589.54606602734636.4539339726543
40620579.9112310957140.0887689042899
41573529.03819808203743.9618019179628
42573524.38594568458448.6140543154162
43574537.7112310957136.2887689042899
44580546.30786794530933.6921320546915
45590551.18426410938338.815735890617
46593554.89381362989238.1061863701077
47597553.5112310957143.4887689042899
48595555.36180191796339.6381980820372
49612557.76516506836454.2348349316357
50628570.9336932871357.0663067128697
51629584.64156123243944.3584387675612
52621577.45897869825743.5410213017433
53569527.40336315040241.5966368495984
54567528.47303301367338.5269669863271
55573539.34606602734633.6539339726543
56584541.40336315040242.5966368495984
57589555.27135143847233.7286485615279
58591561.43315335643529.5668466435652
59595560.8679882880734.1320117119295
60594555.36180191796338.6381980820372


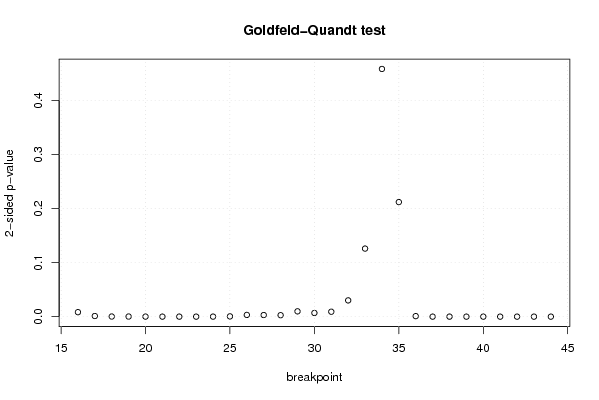
Goldfeld-Quandt test for Heteroskedasticity
p-valuesAlternative Hypothesis
breakpoint indexgreater2-sidedless
160.004150374666641970.008300749333283940.995849625333358
170.0005833512168985940.001166702433797190.999416648783101
180.0001086631959592470.0002173263919184940.99989133680404
199.22595830294697e-050.0001845191660589390.99990774041697
202.88810563720328e-055.77621127440656e-050.999971118943628
211.36370213994757e-052.72740427989514e-050.9999863629786
226.77336906762662e-061.35467381352532e-050.999993226630932
235.64301710395524e-061.12860342079105e-050.999994356982896
242.56100458012116e-055.12200916024231e-050.9999743899542
250.0002408322570448680.0004816645140897360.999759167742955
260.001595544312016410.003191088624032820.998404455687984
270.001476263251485970.002952526502971940.998523736748514
280.001346020971499870.002692041942999740.9986539790285
290.004922093735145410.009844187470290820.995077906264855
300.003422543809912500.006845087619824990.996577456190088
310.004557430000588610.009114860001177210.995442569999411
320.01504648104684030.03009296209368050.98495351895316
330.06292488181808690.1258497636361740.937075118181913
340.2289937332147010.4579874664294020.771006266785299
350.8940695506107180.2118608987785650.105930449389282
360.9995307522736620.0009384954526756760.000469247726337838
370.9999999911535381.76929241069276e-088.84646205346381e-09
380.9999999957909368.41812861216765e-094.20906430608383e-09
390.9999999819472673.61054652711620e-081.80527326355810e-08
400.9999998922357882.15528424826655e-071.07764212413328e-07
410.9999998858392642.28321472155226e-071.14160736077613e-07
420.9999999423393781.15321244310672e-075.76606221553361e-08
430.9999982903420123.41931597681473e-061.70965798840737e-06
440.9999966787808296.64243834242217e-063.32121917121109e-06

\begin{tabular}{lllllllll}
\hline
Goldfeld-Quandt test for Heteroskedasticity \tabularnewline
p-values & Alternative Hypothesis \tabularnewline
breakpoint index & greater & 2-sided & less \tabularnewline
16 & 0.00415037466664197 & 0.00830074933328394 & 0.995849625333358 \tabularnewline
17 & 0.000583351216898594 & 0.00116670243379719 & 0.999416648783101 \tabularnewline
18 & 0.000108663195959247 & 0.000217326391918494 & 0.99989133680404 \tabularnewline
19 & 9.22595830294697e-05 & 0.000184519166058939 & 0.99990774041697 \tabularnewline
20 & 2.88810563720328e-05 & 5.77621127440656e-05 & 0.999971118943628 \tabularnewline
21 & 1.36370213994757e-05 & 2.72740427989514e-05 & 0.9999863629786 \tabularnewline
22 & 6.77336906762662e-06 & 1.35467381352532e-05 & 0.999993226630932 \tabularnewline
23 & 5.64301710395524e-06 & 1.12860342079105e-05 & 0.999994356982896 \tabularnewline
24 & 2.56100458012116e-05 & 5.12200916024231e-05 & 0.9999743899542 \tabularnewline
25 & 0.000240832257044868 & 0.000481664514089736 & 0.999759167742955 \tabularnewline
26 & 0.00159554431201641 & 0.00319108862403282 & 0.998404455687984 \tabularnewline
27 & 0.00147626325148597 & 0.00295252650297194 & 0.998523736748514 \tabularnewline
28 & 0.00134602097149987 & 0.00269204194299974 & 0.9986539790285 \tabularnewline
29 & 0.00492209373514541 & 0.00984418747029082 & 0.995077906264855 \tabularnewline
30 & 0.00342254380991250 & 0.00684508761982499 & 0.996577456190088 \tabularnewline
31 & 0.00455743000058861 & 0.00911486000117721 & 0.995442569999411 \tabularnewline
32 & 0.0150464810468403 & 0.0300929620936805 & 0.98495351895316 \tabularnewline
33 & 0.0629248818180869 & 0.125849763636174 & 0.937075118181913 \tabularnewline
34 & 0.228993733214701 & 0.457987466429402 & 0.771006266785299 \tabularnewline
35 & 0.894069550610718 & 0.211860898778565 & 0.105930449389282 \tabularnewline
36 & 0.999530752273662 & 0.000938495452675676 & 0.000469247726337838 \tabularnewline
37 & 0.999999991153538 & 1.76929241069276e-08 & 8.84646205346381e-09 \tabularnewline
38 & 0.999999995790936 & 8.41812861216765e-09 & 4.20906430608383e-09 \tabularnewline
39 & 0.999999981947267 & 3.61054652711620e-08 & 1.80527326355810e-08 \tabularnewline
40 & 0.999999892235788 & 2.15528424826655e-07 & 1.07764212413328e-07 \tabularnewline
41 & 0.999999885839264 & 2.28321472155226e-07 & 1.14160736077613e-07 \tabularnewline
42 & 0.999999942339378 & 1.15321244310672e-07 & 5.76606221553361e-08 \tabularnewline
43 & 0.999998290342012 & 3.41931597681473e-06 & 1.70965798840737e-06 \tabularnewline
44 & 0.999996678780829 & 6.64243834242217e-06 & 3.32121917121109e-06 \tabularnewline
\hline
\end{tabular}
%Source: https://freestatistics.org/blog/index.php?pk=68075&T=5

[TABLE]
[ROW][C]Goldfeld-Quandt test for Heteroskedasticity[/C][/ROW]
[ROW][C]p-values[/C][C]Alternative Hypothesis[/C][/ROW]
[ROW][C]breakpoint index[/C][C]greater[/C][C]2-sided[/C][C]less[/C][/ROW]
[ROW][C]16[/C][C]0.00415037466664197[/C][C]0.00830074933328394[/C][C]0.995849625333358[/C][/ROW]
[ROW][C]17[/C][C]0.000583351216898594[/C][C]0.00116670243379719[/C][C]0.999416648783101[/C][/ROW]
[ROW][C]18[/C][C]0.000108663195959247[/C][C]0.000217326391918494[/C][C]0.99989133680404[/C][/ROW]
[ROW][C]19[/C][C]9.22595830294697e-05[/C][C]0.000184519166058939[/C][C]0.99990774041697[/C][/ROW]
[ROW][C]20[/C][C]2.88810563720328e-05[/C][C]5.77621127440656e-05[/C][C]0.999971118943628[/C][/ROW]
[ROW][C]21[/C][C]1.36370213994757e-05[/C][C]2.72740427989514e-05[/C][C]0.9999863629786[/C][/ROW]
[ROW][C]22[/C][C]6.77336906762662e-06[/C][C]1.35467381352532e-05[/C][C]0.999993226630932[/C][/ROW]
[ROW][C]23[/C][C]5.64301710395524e-06[/C][C]1.12860342079105e-05[/C][C]0.999994356982896[/C][/ROW]
[ROW][C]24[/C][C]2.56100458012116e-05[/C][C]5.12200916024231e-05[/C][C]0.9999743899542[/C][/ROW]
[ROW][C]25[/C][C]0.000240832257044868[/C][C]0.000481664514089736[/C][C]0.999759167742955[/C][/ROW]
[ROW][C]26[/C][C]0.00159554431201641[/C][C]0.00319108862403282[/C][C]0.998404455687984[/C][/ROW]
[ROW][C]27[/C][C]0.00147626325148597[/C][C]0.00295252650297194[/C][C]0.998523736748514[/C][/ROW]
[ROW][C]28[/C][C]0.00134602097149987[/C][C]0.00269204194299974[/C][C]0.9986539790285[/C][/ROW]
[ROW][C]29[/C][C]0.00492209373514541[/C][C]0.00984418747029082[/C][C]0.995077906264855[/C][/ROW]
[ROW][C]30[/C][C]0.00342254380991250[/C][C]0.00684508761982499[/C][C]0.996577456190088[/C][/ROW]
[ROW][C]31[/C][C]0.00455743000058861[/C][C]0.00911486000117721[/C][C]0.995442569999411[/C][/ROW]
[ROW][C]32[/C][C]0.0150464810468403[/C][C]0.0300929620936805[/C][C]0.98495351895316[/C][/ROW]
[ROW][C]33[/C][C]0.0629248818180869[/C][C]0.125849763636174[/C][C]0.937075118181913[/C][/ROW]
[ROW][C]34[/C][C]0.228993733214701[/C][C]0.457987466429402[/C][C]0.771006266785299[/C][/ROW]
[ROW][C]35[/C][C]0.894069550610718[/C][C]0.211860898778565[/C][C]0.105930449389282[/C][/ROW]
[ROW][C]36[/C][C]0.999530752273662[/C][C]0.000938495452675676[/C][C]0.000469247726337838[/C][/ROW]
[ROW][C]37[/C][C]0.999999991153538[/C][C]1.76929241069276e-08[/C][C]8.84646205346381e-09[/C][/ROW]
[ROW][C]38[/C][C]0.999999995790936[/C][C]8.41812861216765e-09[/C][C]4.20906430608383e-09[/C][/ROW]
[ROW][C]39[/C][C]0.999999981947267[/C][C]3.61054652711620e-08[/C][C]1.80527326355810e-08[/C][/ROW]
[ROW][C]40[/C][C]0.999999892235788[/C][C]2.15528424826655e-07[/C][C]1.07764212413328e-07[/C][/ROW]
[ROW][C]41[/C][C]0.999999885839264[/C][C]2.28321472155226e-07[/C][C]1.14160736077613e-07[/C][/ROW]
[ROW][C]42[/C][C]0.999999942339378[/C][C]1.15321244310672e-07[/C][C]5.76606221553361e-08[/C][/ROW]
[ROW][C]43[/C][C]0.999998290342012[/C][C]3.41931597681473e-06[/C][C]1.70965798840737e-06[/C][/ROW]
[ROW][C]44[/C][C]0.999996678780829[/C][C]6.64243834242217e-06[/C][C]3.32121917121109e-06[/C][/ROW]
[/TABLE]
Source: https://freestatistics.org/blog/index.php?pk=68075&T=5

Globally Unique Identifier (entire table): ba.freestatistics.org/blog/index.php?pk=68075&T=5

As an alternative you can also use a QR Code:  

The GUIDs for individual cells are displayed in the table below:

Goldfeld-Quandt test for Heteroskedasticity
p-valuesAlternative Hypothesis
breakpoint indexgreater2-sidedless
160.004150374666641970.008300749333283940.995849625333358
170.0005833512168985940.001166702433797190.999416648783101
180.0001086631959592470.0002173263919184940.99989133680404
199.22595830294697e-050.0001845191660589390.99990774041697
202.88810563720328e-055.77621127440656e-050.999971118943628
211.36370213994757e-052.72740427989514e-050.9999863629786
226.77336906762662e-061.35467381352532e-050.999993226630932
235.64301710395524e-061.12860342079105e-050.999994356982896
242.56100458012116e-055.12200916024231e-050.9999743899542
250.0002408322570448680.0004816645140897360.999759167742955
260.001595544312016410.003191088624032820.998404455687984
270.001476263251485970.002952526502971940.998523736748514
280.001346020971499870.002692041942999740.9986539790285
290.004922093735145410.009844187470290820.995077906264855
300.003422543809912500.006845087619824990.996577456190088
310.004557430000588610.009114860001177210.995442569999411
320.01504648104684030.03009296209368050.98495351895316
330.06292488181808690.1258497636361740.937075118181913
340.2289937332147010.4579874664294020.771006266785299
350.8940695506107180.2118608987785650.105930449389282
360.9995307522736620.0009384954526756760.000469247726337838
370.9999999911535381.76929241069276e-088.84646205346381e-09
380.9999999957909368.41812861216765e-094.20906430608383e-09
390.9999999819472673.61054652711620e-081.80527326355810e-08
400.9999998922357882.15528424826655e-071.07764212413328e-07
410.9999998858392642.28321472155226e-071.14160736077613e-07
420.9999999423393781.15321244310672e-075.76606221553361e-08
430.9999982903420123.41931597681473e-061.70965798840737e-06
440.9999966787808296.64243834242217e-063.32121917121109e-06


Meta Analysis of Goldfeld-Quandt test for Heteroskedasticity
Description# significant tests% significant testsOK/NOK
1% type I error level250.862068965517241NOK
5% type I error level260.896551724137931NOK
10% type I error level260.896551724137931NOK

\begin{tabular}{lllllllll}
\hline
Meta Analysis of Goldfeld-Quandt test for Heteroskedasticity \tabularnewline
Description & # significant tests & % significant tests & OK/NOK \tabularnewline
1% type I error level & 25 & 0.862068965517241 & NOK \tabularnewline
5% type I error level & 26 & 0.896551724137931 & NOK \tabularnewline
10% type I error level & 26 & 0.896551724137931 & NOK \tabularnewline
\hline
\end{tabular}
%Source: https://freestatistics.org/blog/index.php?pk=68075&T=6

[TABLE]
[ROW][C]Meta Analysis of Goldfeld-Quandt test for Heteroskedasticity[/C][/ROW]
[ROW][C]Description[/C][C]# significant tests[/C][C]% significant tests[/C][C]OK/NOK[/C][/ROW]
[ROW][C]1% type I error level[/C][C]25[/C][C]0.862068965517241[/C][C]NOK[/C][/ROW]
[ROW][C]5% type I error level[/C][C]26[/C][C]0.896551724137931[/C][C]NOK[/C][/ROW]
[ROW][C]10% type I error level[/C][C]26[/C][C]0.896551724137931[/C][C]NOK[/C][/ROW]
[/TABLE]
Source: https://freestatistics.org/blog/index.php?pk=68075&T=6

Globally Unique Identifier (entire table): ba.freestatistics.org/blog/index.php?pk=68075&T=6

As an alternative you can also use a QR Code:  

The GUIDs for individual cells are displayed in the table below:

Meta Analysis of Goldfeld-Quandt test for Heteroskedasticity
Description# significant tests% significant testsOK/NOK
1% type I error level250.862068965517241NOK
5% type I error level260.896551724137931NOK
10% type I error level260.896551724137931NOK


Parameters (Session):
par1 = 1 ; par2 = Include Monthly Dummies ; par3 = No Linear Trend ;
Parameters (R input):
par1 = 1 ; par2 = Include Monthly Dummies ; par3 = No Linear Trend ;
R code (references can be found in the software module):
library(lattice)
library(lmtest)
n25 <- 25 #minimum number of obs. for Goldfeld-Quandt test
par1 <- as.numeric(par1)
x <- t(y)
k <- length(x[1,])
n <- length(x[,1])
x1 <- cbind(x[,par1], x[,1:k!=par1])
mycolnames <- c(colnames(x)[par1], colnames(x)[1:k!=par1])
colnames(x1) <- mycolnames #colnames(x)[par1]
x <- x1
if (par3 == 'First Differences'){
x2 <- array(0, dim=c(n-1,k), dimnames=list(1:(n-1), paste('(1-B)',colnames(x),sep='')))
for (i in 1:n-1) {
for (j in 1:k) {
x2[i,j] <- x[i+1,j] - x[i,j]
}
}
x <- x2
}
if (par2 == 'Include Monthly Dummies'){
x2 <- array(0, dim=c(n,11), dimnames=list(1:n, paste('M', seq(1:11), sep ='')))
for (i in 1:11){
x2[seq(i,n,12),i] <- 1
}
x <- cbind(x, x2)
}
if (par2 == 'Include Quarterly Dummies'){
x2 <- array(0, dim=c(n,3), dimnames=list(1:n, paste('Q', seq(1:3), sep ='')))
for (i in 1:3){
x2[seq(i,n,4),i] <- 1
}
x <- cbind(x, x2)
}
k <- length(x[1,])
if (par3 == 'Linear Trend'){
x <- cbind(x, c(1:n))
colnames(x)[k+1] <- 't'
}
x
k <- length(x[1,])
df <- as.data.frame(x)
(mylm <- lm(df))
(mysum <- summary(mylm))
if (n > n25) {
kp3 <- k + 3
nmkm3 <- n - k - 3
gqarr <- array(NA, dim=c(nmkm3-kp3+1,3))
numgqtests <- 0
numsignificant1 <- 0
numsignificant5 <- 0
numsignificant10 <- 0
for (mypoint in kp3:nmkm3) {
j <- 0
numgqtests <- numgqtests + 1
for (myalt in c('greater', 'two.sided', 'less')) {
j <- j + 1
gqarr[mypoint-kp3+1,j] <- gqtest(mylm, point=mypoint, alternative=myalt)$p.value
}
if (gqarr[mypoint-kp3+1,2] < 0.01) numsignificant1 <- numsignificant1 + 1
if (gqarr[mypoint-kp3+1,2] < 0.05) numsignificant5 <- numsignificant5 + 1
if (gqarr[mypoint-kp3+1,2] < 0.10) numsignificant10 <- numsignificant10 + 1
}
gqarr
}
bitmap(file='test0.png')
plot(x[,1], type='l', main='Actuals and Interpolation', ylab='value of Actuals and Interpolation (dots)', xlab='time or index')
points(x[,1]-mysum$resid)
grid()
dev.off()
bitmap(file='test1.png')
plot(mysum$resid, type='b', pch=19, main='Residuals', ylab='value of Residuals', xlab='time or index')
grid()
dev.off()
bitmap(file='test2.png')
hist(mysum$resid, main='Residual Histogram', xlab='values of Residuals')
grid()
dev.off()
bitmap(file='test3.png')
densityplot(~mysum$resid,col='black',main='Residual Density Plot', xlab='values of Residuals')
dev.off()
bitmap(file='test4.png')
qqnorm(mysum$resid, main='Residual Normal Q-Q Plot')
qqline(mysum$resid)
grid()
dev.off()
(myerror <- as.ts(mysum$resid))
bitmap(file='test5.png')
dum <- cbind(lag(myerror,k=1),myerror)
dum
dum1 <- dum[2:length(myerror),]
dum1
z <- as.data.frame(dum1)
z
plot(z,main=paste('Residual Lag plot, lowess, and regression line'), ylab='values of Residuals', xlab='lagged values of Residuals')
lines(lowess(z))
abline(lm(z))
grid()
dev.off()
bitmap(file='test6.png')
acf(mysum$resid, lag.max=length(mysum$resid)/2, main='Residual Autocorrelation Function')
grid()
dev.off()
bitmap(file='test7.png')
pacf(mysum$resid, lag.max=length(mysum$resid)/2, main='Residual Partial Autocorrelation Function')
grid()
dev.off()
bitmap(file='test8.png')
opar <- par(mfrow = c(2,2), oma = c(0, 0, 1.1, 0))
plot(mylm, las = 1, sub='Residual Diagnostics')
par(opar)
dev.off()
if (n > n25) {
bitmap(file='test9.png')
plot(kp3:nmkm3,gqarr[,2], main='Goldfeld-Quandt test',ylab='2-sided p-value',xlab='breakpoint')
grid()
dev.off()
}
load(file='createtable')
a<-table.start()
a<-table.row.start(a)
a<-table.element(a, 'Multiple Linear Regression - Estimated Regression Equation', 1, TRUE)
a<-table.row.end(a)
myeq <- colnames(x)[1]
myeq <- paste(myeq, '[t] = ', sep='')
for (i in 1:k){
if (mysum$coefficients[i,1] > 0) myeq <- paste(myeq, '+', '')
myeq <- paste(myeq, mysum$coefficients[i,1], sep=' ')
if (rownames(mysum$coefficients)[i] != '(Intercept)') {
myeq <- paste(myeq, rownames(mysum$coefficients)[i], sep='')
if (rownames(mysum$coefficients)[i] != 't') myeq <- paste(myeq, '[t]', sep='')
}
}
myeq <- paste(myeq, ' + e[t]')
a<-table.row.start(a)
a<-table.element(a, myeq)
a<-table.row.end(a)
a<-table.end(a)
table.save(a,file='mytable1.tab')
a<-table.start()
a<-table.row.start(a)
a<-table.element(a,hyperlink('ols1.htm','Multiple Linear Regression - Ordinary Least Squares',''), 6, TRUE)
a<-table.row.end(a)
a<-table.row.start(a)
a<-table.element(a,'Variable',header=TRUE)
a<-table.element(a,'Parameter',header=TRUE)
a<-table.element(a,'S.D.',header=TRUE)
a<-table.element(a,'T-STAT
H0: parameter = 0',header=TRUE)
a<-table.element(a,'2-tail p-value',header=TRUE)
a<-table.element(a,'1-tail p-value',header=TRUE)
a<-table.row.end(a)
for (i in 1:k){
a<-table.row.start(a)
a<-table.element(a,rownames(mysum$coefficients)[i],header=TRUE)
a<-table.element(a,mysum$coefficients[i,1])
a<-table.element(a, round(mysum$coefficients[i,2],6))
a<-table.element(a, round(mysum$coefficients[i,3],4))
a<-table.element(a, round(mysum$coefficients[i,4],6))
a<-table.element(a, round(mysum$coefficients[i,4]/2,6))
a<-table.row.end(a)
}
a<-table.end(a)
table.save(a,file='mytable2.tab')
a<-table.start()
a<-table.row.start(a)
a<-table.element(a, 'Multiple Linear Regression - Regression Statistics', 2, TRUE)
a<-table.row.end(a)
a<-table.row.start(a)
a<-table.element(a, 'Multiple R',1,TRUE)
a<-table.element(a, sqrt(mysum$r.squared))
a<-table.row.end(a)
a<-table.row.start(a)
a<-table.element(a, 'R-squared',1,TRUE)
a<-table.element(a, mysum$r.squared)
a<-table.row.end(a)
a<-table.row.start(a)
a<-table.element(a, 'Adjusted R-squared',1,TRUE)
a<-table.element(a, mysum$adj.r.squared)
a<-table.row.end(a)
a<-table.row.start(a)
a<-table.element(a, 'F-TEST (value)',1,TRUE)
a<-table.element(a, mysum$fstatistic[1])
a<-table.row.end(a)
a<-table.row.start(a)
a<-table.element(a, 'F-TEST (DF numerator)',1,TRUE)
a<-table.element(a, mysum$fstatistic[2])
a<-table.row.end(a)
a<-table.row.start(a)
a<-table.element(a, 'F-TEST (DF denominator)',1,TRUE)
a<-table.element(a, mysum$fstatistic[3])
a<-table.row.end(a)
a<-table.row.start(a)
a<-table.element(a, 'p-value',1,TRUE)
a<-table.element(a, 1-pf(mysum$fstatistic[1],mysum$fstatistic[2],mysum$fstatistic[3]))
a<-table.row.end(a)
a<-table.row.start(a)
a<-table.element(a, 'Multiple Linear Regression - Residual Statistics', 2, TRUE)
a<-table.row.end(a)
a<-table.row.start(a)
a<-table.element(a, 'Residual Standard Deviation',1,TRUE)
a<-table.element(a, mysum$sigma)
a<-table.row.end(a)
a<-table.row.start(a)
a<-table.element(a, 'Sum Squared Residuals',1,TRUE)
a<-table.element(a, sum(myerror*myerror))
a<-table.row.end(a)
a<-table.end(a)
table.save(a,file='mytable3.tab')
a<-table.start()
a<-table.row.start(a)
a<-table.element(a, 'Multiple Linear Regression - Actuals, Interpolation, and Residuals', 4, TRUE)
a<-table.row.end(a)
a<-table.row.start(a)
a<-table.element(a, 'Time or Index', 1, TRUE)
a<-table.element(a, 'Actuals', 1, TRUE)
a<-table.element(a, 'Interpolation
Forecast', 1, TRUE)
a<-table.element(a, 'Residuals
Prediction Error', 1, TRUE)
a<-table.row.end(a)
for (i in 1:n) {
a<-table.row.start(a)
a<-table.element(a,i, 1, TRUE)
a<-table.element(a,x[i])
a<-table.element(a,x[i]-mysum$resid[i])
a<-table.element(a,mysum$resid[i])
a<-table.row.end(a)
}
a<-table.end(a)
table.save(a,file='mytable4.tab')
if (n > n25) {
a<-table.start()
a<-table.row.start(a)
a<-table.element(a,'Goldfeld-Quandt test for Heteroskedasticity',4,TRUE)
a<-table.row.end(a)
a<-table.row.start(a)
a<-table.element(a,'p-values',header=TRUE)
a<-table.element(a,'Alternative Hypothesis',3,header=TRUE)
a<-table.row.end(a)
a<-table.row.start(a)
a<-table.element(a,'breakpoint index',header=TRUE)
a<-table.element(a,'greater',header=TRUE)
a<-table.element(a,'2-sided',header=TRUE)
a<-table.element(a,'less',header=TRUE)
a<-table.row.end(a)
for (mypoint in kp3:nmkm3) {
a<-table.row.start(a)
a<-table.element(a,mypoint,header=TRUE)
a<-table.element(a,gqarr[mypoint-kp3+1,1])
a<-table.element(a,gqarr[mypoint-kp3+1,2])
a<-table.element(a,gqarr[mypoint-kp3+1,3])
a<-table.row.end(a)
}
a<-table.end(a)
table.save(a,file='mytable5.tab')
a<-table.start()
a<-table.row.start(a)
a<-table.element(a,'Meta Analysis of Goldfeld-Quandt test for Heteroskedasticity',4,TRUE)
a<-table.row.end(a)
a<-table.row.start(a)
a<-table.element(a,'Description',header=TRUE)
a<-table.element(a,'# significant tests',header=TRUE)
a<-table.element(a,'% significant tests',header=TRUE)
a<-table.element(a,'OK/NOK',header=TRUE)
a<-table.row.end(a)
a<-table.row.start(a)
a<-table.element(a,'1% type I error level',header=TRUE)
a<-table.element(a,numsignificant1)
a<-table.element(a,numsignificant1/numgqtests)
if (numsignificant1/numgqtests < 0.01) dum <- 'OK' else dum <- 'NOK'
a<-table.element(a,dum)
a<-table.row.end(a)
a<-table.row.start(a)
a<-table.element(a,'5% type I error level',header=TRUE)
a<-table.element(a,numsignificant5)
a<-table.element(a,numsignificant5/numgqtests)
if (numsignificant5/numgqtests < 0.05) dum <- 'OK' else dum <- 'NOK'
a<-table.element(a,dum)
a<-table.row.end(a)
a<-table.row.start(a)
a<-table.element(a,'10% type I error level',header=TRUE)
a<-table.element(a,numsignificant10)
a<-table.element(a,numsignificant10/numgqtests)
if (numsignificant10/numgqtests < 0.1) dum <- 'OK' else dum <- 'NOK'
a<-table.element(a,dum)
a<-table.row.end(a)
a<-table.end(a)
table.save(a,file='mytable6.tab')
}