Free Statistics

of Irreproducible Research!

Author's title

multiple regression toevoeging variabele uit het verleden 2 periodes terug ...

Author*The author of this computation has been verified*
R Software Modulerwasp_multipleregression.wasp
Title produced by softwareMultiple Regression
Date of computationMon, 14 Dec 2009 12:59:10 -0700
Cite this page as followsStatistical Computations at FreeStatistics.org, Office for Research Development and Education, URL https://freestatistics.org/blog/index.php?v=date/2009/Dec/14/t1260820774tef8n6nrg1rpd0k.htm/, Retrieved Sun, 28 Apr 2024 22:41:02 +0000
Statistical Computations at FreeStatistics.org, Office for Research Development and Education, URL https://freestatistics.org/blog/index.php?pk=67653, Retrieved Sun, 28 Apr 2024 22:41:02 +0000
QR Codes:

Original text written by user:
IsPrivate?No (this computation is public)
User-defined keywords
Estimated Impact115
Family? (F = Feedback message, R = changed R code, M = changed R Module, P = changed Parameters, D = changed Data)
-     [Multiple Regression] [Q1 The Seatbeltlaw] [2007-11-14 19:27:43] [8cd6641b921d30ebe00b648d1481bba0]
- RMPD  [Multiple Regression] [Seatbelt] [2009-11-12 14:03:14] [b98453cac15ba1066b407e146608df68]
-   PD    [Multiple Regression] [] [2009-11-19 10:39:42] [d181e5359f7da6c8509e4702d1229fb0]
-    D      [Multiple Regression] [multiple regressi...] [2009-11-20 19:37:54] [34d27ebe78dc2d31581e8710befe8733]
-    D          [Multiple Regression] [multiple regressi...] [2009-12-14 19:59:10] [371dc2189c569d90e2c1567f632c3ec0] [Current]
Feedback Forum

Post a new message
Dataseries X:
452	1870	449	441
462	2263	452	449
455	1802	462	452
461	1863	455	462
461	1989	461	455
463	2197	461	461
462	2409	463	461
456	2502	462	463
455	2593	456	462
456	2598	455	456
472	2053	456	455
472	2213	472	456
471	2238	472	472
465	2359	471	472
459	2151	465	471
465	2474	459	465
468	3079	465	459
467	2312	468	465
463	2565	467	468
460	1972	463	467
462	2484	460	463
461	2202	462	460
476	2151	461	462
476	1976	476	461
471	2012	476	476
453	2114	471	476
443	1772	453	471
442	1957	443	453
444	2070	442	443
438	1990	444	442
427	2182	438	444
424	2008	427	438
416	1916	424	427
406	2397	416	424
431	2114	406	416
434	1778	431	406
418	1641	434	431
412	2186	418	434
404	1773	412	418
409	1785	404	412
412	2217	409	404
406	2153	412	409
398	1895	406	412
397	2475	398	406
385	1793	397	398
390	2308	385	397
413	2051	390	385
413	1898	413	390
401	2142	413	413
397	1874	401	413
397	1560	397	401
409	1808	397	397
419	1575	409	397
424	1525	419	409
428	1997	424	419
430	1753	428	424
424	1623	430	428
433	2251	424	430
456	1890	433	424


Summary of computational transaction
Raw Inputview raw input (R code)
Raw Outputview raw output of R engine
Computing time3 seconds
R Server'Gwilym Jenkins' @ 72.249.127.135

\begin{tabular}{lllllllll}
\hline
Summary of computational transaction \tabularnewline
Raw Input & view raw input (R code)  \tabularnewline
Raw Output & view raw output of R engine  \tabularnewline
Computing time & 3 seconds \tabularnewline
R Server & 'Gwilym Jenkins' @ 72.249.127.135 \tabularnewline
\hline
\end{tabular}
%Source: https://freestatistics.org/blog/index.php?pk=67653&T=0

[TABLE]
[ROW][C]Summary of computational transaction[/C][/ROW]
[ROW][C]Raw Input[/C][C]view raw input (R code) [/C][/ROW]
[ROW][C]Raw Output[/C][C]view raw output of R engine [/C][/ROW]
[ROW][C]Computing time[/C][C]3 seconds[/C][/ROW]
[ROW][C]R Server[/C][C]'Gwilym Jenkins' @ 72.249.127.135[/C][/ROW]
[/TABLE]
Source: https://freestatistics.org/blog/index.php?pk=67653&T=0

Globally Unique Identifier (entire table): ba.freestatistics.org/blog/index.php?pk=67653&T=0

As an alternative you can also use a QR Code:  

The GUIDs for individual cells are displayed in the table below:

Summary of computational transaction
Raw Inputview raw input (R code)
Raw Outputview raw output of R engine
Computing time3 seconds
R Server'Gwilym Jenkins' @ 72.249.127.135


Multiple Linear Regression - Estimated Regression Equation
wkl[t] = + 14.1829759293675 + 0.00268635618666913bvg[t] + 1.29322834059705Y1[t] -0.348397687511171Y2[t] -0.976702766630424M1[t] + 2.55733833239759M2[t] + 1.36787980492116M3[t] + 12.8975224505603M4[t] + 6.56433786984919M5[t] + 3.09364182521555M6[t] + 1.46111795099527M7[t] + 4.22688545632968M8[t] + 0.869449387776794M9[t] + 6.67474551128959M10[t] + 25.1318031332856M11[t] -0.0293336897408048t + e[t]

\begin{tabular}{lllllllll}
\hline
Multiple Linear Regression - Estimated Regression Equation \tabularnewline
wkl[t] =  +  14.1829759293675 +  0.00268635618666913bvg[t] +  1.29322834059705Y1[t] -0.348397687511171Y2[t] -0.976702766630424M1[t] +  2.55733833239759M2[t] +  1.36787980492116M3[t] +  12.8975224505603M4[t] +  6.56433786984919M5[t] +  3.09364182521555M6[t] +  1.46111795099527M7[t] +  4.22688545632968M8[t] +  0.869449387776794M9[t] +  6.67474551128959M10[t] +  25.1318031332856M11[t] -0.0293336897408048t  + e[t] \tabularnewline
\hline
\end{tabular}
%Source: https://freestatistics.org/blog/index.php?pk=67653&T=1

[TABLE]
[ROW][C]Multiple Linear Regression - Estimated Regression Equation[/C][/ROW]
[ROW][C]wkl[t] =  +  14.1829759293675 +  0.00268635618666913bvg[t] +  1.29322834059705Y1[t] -0.348397687511171Y2[t] -0.976702766630424M1[t] +  2.55733833239759M2[t] +  1.36787980492116M3[t] +  12.8975224505603M4[t] +  6.56433786984919M5[t] +  3.09364182521555M6[t] +  1.46111795099527M7[t] +  4.22688545632968M8[t] +  0.869449387776794M9[t] +  6.67474551128959M10[t] +  25.1318031332856M11[t] -0.0293336897408048t  + e[t][/C][/ROW]
[/TABLE]
Source: https://freestatistics.org/blog/index.php?pk=67653&T=1

Globally Unique Identifier (entire table): ba.freestatistics.org/blog/index.php?pk=67653&T=1

As an alternative you can also use a QR Code:  

The GUIDs for individual cells are displayed in the table below:

Multiple Linear Regression - Estimated Regression Equation
wkl[t] = + 14.1829759293675 + 0.00268635618666913bvg[t] + 1.29322834059705Y1[t] -0.348397687511171Y2[t] -0.976702766630424M1[t] + 2.55733833239759M2[t] + 1.36787980492116M3[t] + 12.8975224505603M4[t] + 6.56433786984919M5[t] + 3.09364182521555M6[t] + 1.46111795099527M7[t] + 4.22688545632968M8[t] + 0.869449387776794M9[t] + 6.67474551128959M10[t] + 25.1318031332856M11[t] -0.0293336897408048t + e[t]


Multiple Linear Regression - Ordinary Least Squares
VariableParameterS.D.T-STATH0: parameter = 02-tail p-value1-tail p-value
(Intercept)14.182975929367523.7301030.59770.5531890.276595
bvg0.002686356186669130.0034380.78140.4388340.219417
Y11.293228340597050.1472818.780700
Y2-0.3483976875111710.147768-2.35770.0230060.011503
M1-0.9767027666304244.5515-0.21460.8311020.415551
M22.557338332397595.2485270.48720.6285570.314278
M31.367879804921165.3137250.25740.7980790.39904
M412.89752245056035.3224292.42320.0196660.009833
M56.564337869849194.2486981.5450.1296690.064835
M63.093641825215554.3873330.70510.4845310.242266
M71.461117950995274.762780.30680.7604930.380246
M84.226885456329685.0195760.84210.4044020.202201
M90.8694493877767944.8600840.17890.858860.42943
M106.674745511289595.1460161.29710.2015240.100762
M1125.13180313328564.6044065.45822e-061e-06
t-0.02933368974080480.076274-0.38460.7024410.351221

\begin{tabular}{lllllllll}
\hline
Multiple Linear Regression - Ordinary Least Squares \tabularnewline
Variable & Parameter & S.D. & T-STATH0: parameter = 0 & 2-tail p-value & 1-tail p-value \tabularnewline
(Intercept) & 14.1829759293675 & 23.730103 & 0.5977 & 0.553189 & 0.276595 \tabularnewline
bvg & 0.00268635618666913 & 0.003438 & 0.7814 & 0.438834 & 0.219417 \tabularnewline
Y1 & 1.29322834059705 & 0.147281 & 8.7807 & 0 & 0 \tabularnewline
Y2 & -0.348397687511171 & 0.147768 & -2.3577 & 0.023006 & 0.011503 \tabularnewline
M1 & -0.976702766630424 & 4.5515 & -0.2146 & 0.831102 & 0.415551 \tabularnewline
M2 & 2.55733833239759 & 5.248527 & 0.4872 & 0.628557 & 0.314278 \tabularnewline
M3 & 1.36787980492116 & 5.313725 & 0.2574 & 0.798079 & 0.39904 \tabularnewline
M4 & 12.8975224505603 & 5.322429 & 2.4232 & 0.019666 & 0.009833 \tabularnewline
M5 & 6.56433786984919 & 4.248698 & 1.545 & 0.129669 & 0.064835 \tabularnewline
M6 & 3.09364182521555 & 4.387333 & 0.7051 & 0.484531 & 0.242266 \tabularnewline
M7 & 1.46111795099527 & 4.76278 & 0.3068 & 0.760493 & 0.380246 \tabularnewline
M8 & 4.22688545632968 & 5.019576 & 0.8421 & 0.404402 & 0.202201 \tabularnewline
M9 & 0.869449387776794 & 4.860084 & 0.1789 & 0.85886 & 0.42943 \tabularnewline
M10 & 6.67474551128959 & 5.146016 & 1.2971 & 0.201524 & 0.100762 \tabularnewline
M11 & 25.1318031332856 & 4.604406 & 5.4582 & 2e-06 & 1e-06 \tabularnewline
t & -0.0293336897408048 & 0.076274 & -0.3846 & 0.702441 & 0.351221 \tabularnewline
\hline
\end{tabular}
%Source: https://freestatistics.org/blog/index.php?pk=67653&T=2

[TABLE]
[ROW][C]Multiple Linear Regression - Ordinary Least Squares[/C][/ROW]
[ROW][C]Variable[/C][C]Parameter[/C][C]S.D.[/C][C]T-STATH0: parameter = 0[/C][C]2-tail p-value[/C][C]1-tail p-value[/C][/ROW]
[ROW][C](Intercept)[/C][C]14.1829759293675[/C][C]23.730103[/C][C]0.5977[/C][C]0.553189[/C][C]0.276595[/C][/ROW]
[ROW][C]bvg[/C][C]0.00268635618666913[/C][C]0.003438[/C][C]0.7814[/C][C]0.438834[/C][C]0.219417[/C][/ROW]
[ROW][C]Y1[/C][C]1.29322834059705[/C][C]0.147281[/C][C]8.7807[/C][C]0[/C][C]0[/C][/ROW]
[ROW][C]Y2[/C][C]-0.348397687511171[/C][C]0.147768[/C][C]-2.3577[/C][C]0.023006[/C][C]0.011503[/C][/ROW]
[ROW][C]M1[/C][C]-0.976702766630424[/C][C]4.5515[/C][C]-0.2146[/C][C]0.831102[/C][C]0.415551[/C][/ROW]
[ROW][C]M2[/C][C]2.55733833239759[/C][C]5.248527[/C][C]0.4872[/C][C]0.628557[/C][C]0.314278[/C][/ROW]
[ROW][C]M3[/C][C]1.36787980492116[/C][C]5.313725[/C][C]0.2574[/C][C]0.798079[/C][C]0.39904[/C][/ROW]
[ROW][C]M4[/C][C]12.8975224505603[/C][C]5.322429[/C][C]2.4232[/C][C]0.019666[/C][C]0.009833[/C][/ROW]
[ROW][C]M5[/C][C]6.56433786984919[/C][C]4.248698[/C][C]1.545[/C][C]0.129669[/C][C]0.064835[/C][/ROW]
[ROW][C]M6[/C][C]3.09364182521555[/C][C]4.387333[/C][C]0.7051[/C][C]0.484531[/C][C]0.242266[/C][/ROW]
[ROW][C]M7[/C][C]1.46111795099527[/C][C]4.76278[/C][C]0.3068[/C][C]0.760493[/C][C]0.380246[/C][/ROW]
[ROW][C]M8[/C][C]4.22688545632968[/C][C]5.019576[/C][C]0.8421[/C][C]0.404402[/C][C]0.202201[/C][/ROW]
[ROW][C]M9[/C][C]0.869449387776794[/C][C]4.860084[/C][C]0.1789[/C][C]0.85886[/C][C]0.42943[/C][/ROW]
[ROW][C]M10[/C][C]6.67474551128959[/C][C]5.146016[/C][C]1.2971[/C][C]0.201524[/C][C]0.100762[/C][/ROW]
[ROW][C]M11[/C][C]25.1318031332856[/C][C]4.604406[/C][C]5.4582[/C][C]2e-06[/C][C]1e-06[/C][/ROW]
[ROW][C]t[/C][C]-0.0293336897408048[/C][C]0.076274[/C][C]-0.3846[/C][C]0.702441[/C][C]0.351221[/C][/ROW]
[/TABLE]
Source: https://freestatistics.org/blog/index.php?pk=67653&T=2

Globally Unique Identifier (entire table): ba.freestatistics.org/blog/index.php?pk=67653&T=2

As an alternative you can also use a QR Code:  

The GUIDs for individual cells are displayed in the table below:

Multiple Linear Regression - Ordinary Least Squares
VariableParameterS.D.T-STATH0: parameter = 02-tail p-value1-tail p-value
(Intercept)14.182975929367523.7301030.59770.5531890.276595
bvg0.002686356186669130.0034380.78140.4388340.219417
Y11.293228340597050.1472818.780700
Y2-0.3483976875111710.147768-2.35770.0230060.011503
M1-0.9767027666304244.5515-0.21460.8311020.415551
M22.557338332397595.2485270.48720.6285570.314278
M31.367879804921165.3137250.25740.7980790.39904
M412.89752245056035.3224292.42320.0196660.009833
M56.564337869849194.2486981.5450.1296690.064835
M63.093641825215554.3873330.70510.4845310.242266
M71.461117950995274.762780.30680.7604930.380246
M84.226885456329685.0195760.84210.4044020.202201
M90.8694493877767944.8600840.17890.858860.42943
M106.674745511289595.1460161.29710.2015240.100762
M1125.13180313328564.6044065.45822e-061e-06
t-0.02933368974080480.076274-0.38460.7024410.351221


Multiple Linear Regression - Regression Statistics
Multiple R0.983592476882252
R-squared0.967454160579364
Adjusted R-squared0.956100960781468
F-TEST (value)85.214228393887
F-TEST (DF numerator)15
F-TEST (DF denominator)43
p-value0
Multiple Linear Regression - Residual Statistics
Residual Standard Deviation5.56592155017987
Sum Squared Residuals1332.11775621854

\begin{tabular}{lllllllll}
\hline
Multiple Linear Regression - Regression Statistics \tabularnewline
Multiple R & 0.983592476882252 \tabularnewline
R-squared & 0.967454160579364 \tabularnewline
Adjusted R-squared & 0.956100960781468 \tabularnewline
F-TEST (value) & 85.214228393887 \tabularnewline
F-TEST (DF numerator) & 15 \tabularnewline
F-TEST (DF denominator) & 43 \tabularnewline
p-value & 0 \tabularnewline
Multiple Linear Regression - Residual Statistics \tabularnewline
Residual Standard Deviation & 5.56592155017987 \tabularnewline
Sum Squared Residuals & 1332.11775621854 \tabularnewline
\hline
\end{tabular}
%Source: https://freestatistics.org/blog/index.php?pk=67653&T=3

[TABLE]
[ROW][C]Multiple Linear Regression - Regression Statistics[/C][/ROW]
[ROW][C]Multiple R[/C][C]0.983592476882252[/C][/ROW]
[ROW][C]R-squared[/C][C]0.967454160579364[/C][/ROW]
[ROW][C]Adjusted R-squared[/C][C]0.956100960781468[/C][/ROW]
[ROW][C]F-TEST (value)[/C][C]85.214228393887[/C][/ROW]
[ROW][C]F-TEST (DF numerator)[/C][C]15[/C][/ROW]
[ROW][C]F-TEST (DF denominator)[/C][C]43[/C][/ROW]
[ROW][C]p-value[/C][C]0[/C][/ROW]
[ROW][C]Multiple Linear Regression - Residual Statistics[/C][/ROW]
[ROW][C]Residual Standard Deviation[/C][C]5.56592155017987[/C][/ROW]
[ROW][C]Sum Squared Residuals[/C][C]1332.11775621854[/C][/ROW]
[/TABLE]
Source: https://freestatistics.org/blog/index.php?pk=67653&T=3

Globally Unique Identifier (entire table): ba.freestatistics.org/blog/index.php?pk=67653&T=3

As an alternative you can also use a QR Code:  

The GUIDs for individual cells are displayed in the table below:

Multiple Linear Regression - Regression Statistics
Multiple R0.983592476882252
R-squared0.967454160579364
Adjusted R-squared0.956100960781468
F-TEST (value)85.214228393887
F-TEST (DF numerator)15
F-TEST (DF denominator)43
p-value0
Multiple Linear Regression - Residual Statistics
Residual Standard Deviation5.56592155017987
Sum Squared Residuals1332.11775621854


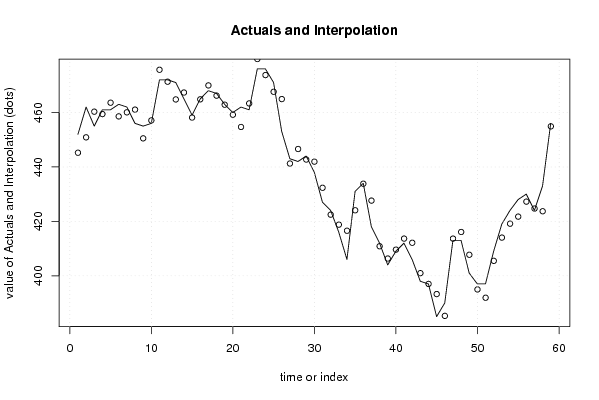
Multiple Linear Regression - Actuals, Interpolation, and Residuals
Time or IndexActualsInterpolationForecastResidualsPrediction Error
1452445.2165702777166.78342972228414
2462450.86951919006611.1304808099344
3455460.299407114231-5.2994071142308
4461459.4270085382251.57299146177506
5461463.601125003454-2.60112500345382
6463458.5694712308404.43052876916047
7462460.0635778596461.93642214035361
8456461.059819084981-5.05981908498085
9455450.5065353836034.49346461639707
10456457.093087382778-1.09308738277824
11472475.698373221407-3.69837322140704
12472471.3103091502890.689690849710761
13471464.7970685984066.202931401594
14465467.333596765683-2.33359676568312
15459458.1450701055680.8549298944324
16465464.8440881912450.155911808755206
17468469.956571582377-1.95657158237703
18467466.1854055495510.81459445044852
19463462.8647746976870.135225302312889
20460459.1836836197090.816316380291088
21462454.6862339572437.31376604275664
22461463.336293690102-2.33629369010226
23476479.636989741218-3.63698974121799
24476473.7525633819912.24743661800868
25471467.6172704356733.38272956432737
26453464.929844473015-11.9298444730149
27443441.2561967467661.74380325323422
28442446.592356566429-4.59235656642849
29444442.7241450795851.27585492041514
30438441.944061218982-3.94406121898215
31427432.341818624257-5.34181862425691
32424422.475700841871.52429915813040
33416418.794475855234-2.79447585523408
34406416.561941952551-10.5619419525511
35431424.0843251780986.91567482190215
36434433.8352580663880.164741933611551
37418427.630933646455-9.63093364645542
38412410.8628586653911.13714133460895
39404406.349594299676-2.34959429967591
40409409.626698930105-0.626698930104898
41412413.678009735369-1.67800973536868
42406412.143749789283-6.1437497892827
43398400.984249223045-2.98424922304517
44397397.023329027198-0.0233290271975336
45385393.298417509088-8.2984175090878
46390385.2875109793414.71248902065898
47413413.671755324742-0.671755324741569
48413416.101869401331-3.10186940133097
49401407.73815704175-6.73815704175009
50397395.0041809058451.99581909415459
51397391.949731733765.05026826624008
52409405.5098477739973.49015222600313
53419414.0401485992164.95985140078437
54424419.1573122113444.84268778865585
55428421.7455795953646.25442040463558
56430427.2574674262432.74253257375690
57424424.714337294832-0.714337294831822
58433423.7211659952279.27883400477259
59456454.9085565345361.09144346546445

\begin{tabular}{lllllllll}
\hline
Multiple Linear Regression - Actuals, Interpolation, and Residuals \tabularnewline
Time or Index & Actuals & InterpolationForecast & ResidualsPrediction Error \tabularnewline
1 & 452 & 445.216570277716 & 6.78342972228414 \tabularnewline
2 & 462 & 450.869519190066 & 11.1304808099344 \tabularnewline
3 & 455 & 460.299407114231 & -5.2994071142308 \tabularnewline
4 & 461 & 459.427008538225 & 1.57299146177506 \tabularnewline
5 & 461 & 463.601125003454 & -2.60112500345382 \tabularnewline
6 & 463 & 458.569471230840 & 4.43052876916047 \tabularnewline
7 & 462 & 460.063577859646 & 1.93642214035361 \tabularnewline
8 & 456 & 461.059819084981 & -5.05981908498085 \tabularnewline
9 & 455 & 450.506535383603 & 4.49346461639707 \tabularnewline
10 & 456 & 457.093087382778 & -1.09308738277824 \tabularnewline
11 & 472 & 475.698373221407 & -3.69837322140704 \tabularnewline
12 & 472 & 471.310309150289 & 0.689690849710761 \tabularnewline
13 & 471 & 464.797068598406 & 6.202931401594 \tabularnewline
14 & 465 & 467.333596765683 & -2.33359676568312 \tabularnewline
15 & 459 & 458.145070105568 & 0.8549298944324 \tabularnewline
16 & 465 & 464.844088191245 & 0.155911808755206 \tabularnewline
17 & 468 & 469.956571582377 & -1.95657158237703 \tabularnewline
18 & 467 & 466.185405549551 & 0.81459445044852 \tabularnewline
19 & 463 & 462.864774697687 & 0.135225302312889 \tabularnewline
20 & 460 & 459.183683619709 & 0.816316380291088 \tabularnewline
21 & 462 & 454.686233957243 & 7.31376604275664 \tabularnewline
22 & 461 & 463.336293690102 & -2.33629369010226 \tabularnewline
23 & 476 & 479.636989741218 & -3.63698974121799 \tabularnewline
24 & 476 & 473.752563381991 & 2.24743661800868 \tabularnewline
25 & 471 & 467.617270435673 & 3.38272956432737 \tabularnewline
26 & 453 & 464.929844473015 & -11.9298444730149 \tabularnewline
27 & 443 & 441.256196746766 & 1.74380325323422 \tabularnewline
28 & 442 & 446.592356566429 & -4.59235656642849 \tabularnewline
29 & 444 & 442.724145079585 & 1.27585492041514 \tabularnewline
30 & 438 & 441.944061218982 & -3.94406121898215 \tabularnewline
31 & 427 & 432.341818624257 & -5.34181862425691 \tabularnewline
32 & 424 & 422.47570084187 & 1.52429915813040 \tabularnewline
33 & 416 & 418.794475855234 & -2.79447585523408 \tabularnewline
34 & 406 & 416.561941952551 & -10.5619419525511 \tabularnewline
35 & 431 & 424.084325178098 & 6.91567482190215 \tabularnewline
36 & 434 & 433.835258066388 & 0.164741933611551 \tabularnewline
37 & 418 & 427.630933646455 & -9.63093364645542 \tabularnewline
38 & 412 & 410.862858665391 & 1.13714133460895 \tabularnewline
39 & 404 & 406.349594299676 & -2.34959429967591 \tabularnewline
40 & 409 & 409.626698930105 & -0.626698930104898 \tabularnewline
41 & 412 & 413.678009735369 & -1.67800973536868 \tabularnewline
42 & 406 & 412.143749789283 & -6.1437497892827 \tabularnewline
43 & 398 & 400.984249223045 & -2.98424922304517 \tabularnewline
44 & 397 & 397.023329027198 & -0.0233290271975336 \tabularnewline
45 & 385 & 393.298417509088 & -8.2984175090878 \tabularnewline
46 & 390 & 385.287510979341 & 4.71248902065898 \tabularnewline
47 & 413 & 413.671755324742 & -0.671755324741569 \tabularnewline
48 & 413 & 416.101869401331 & -3.10186940133097 \tabularnewline
49 & 401 & 407.73815704175 & -6.73815704175009 \tabularnewline
50 & 397 & 395.004180905845 & 1.99581909415459 \tabularnewline
51 & 397 & 391.94973173376 & 5.05026826624008 \tabularnewline
52 & 409 & 405.509847773997 & 3.49015222600313 \tabularnewline
53 & 419 & 414.040148599216 & 4.95985140078437 \tabularnewline
54 & 424 & 419.157312211344 & 4.84268778865585 \tabularnewline
55 & 428 & 421.745579595364 & 6.25442040463558 \tabularnewline
56 & 430 & 427.257467426243 & 2.74253257375690 \tabularnewline
57 & 424 & 424.714337294832 & -0.714337294831822 \tabularnewline
58 & 433 & 423.721165995227 & 9.27883400477259 \tabularnewline
59 & 456 & 454.908556534536 & 1.09144346546445 \tabularnewline
\hline
\end{tabular}
%Source: https://freestatistics.org/blog/index.php?pk=67653&T=4

[TABLE]
[ROW][C]Multiple Linear Regression - Actuals, Interpolation, and Residuals[/C][/ROW]
[ROW][C]Time or Index[/C][C]Actuals[/C][C]InterpolationForecast[/C][C]ResidualsPrediction Error[/C][/ROW]
[ROW][C]1[/C][C]452[/C][C]445.216570277716[/C][C]6.78342972228414[/C][/ROW]
[ROW][C]2[/C][C]462[/C][C]450.869519190066[/C][C]11.1304808099344[/C][/ROW]
[ROW][C]3[/C][C]455[/C][C]460.299407114231[/C][C]-5.2994071142308[/C][/ROW]
[ROW][C]4[/C][C]461[/C][C]459.427008538225[/C][C]1.57299146177506[/C][/ROW]
[ROW][C]5[/C][C]461[/C][C]463.601125003454[/C][C]-2.60112500345382[/C][/ROW]
[ROW][C]6[/C][C]463[/C][C]458.569471230840[/C][C]4.43052876916047[/C][/ROW]
[ROW][C]7[/C][C]462[/C][C]460.063577859646[/C][C]1.93642214035361[/C][/ROW]
[ROW][C]8[/C][C]456[/C][C]461.059819084981[/C][C]-5.05981908498085[/C][/ROW]
[ROW][C]9[/C][C]455[/C][C]450.506535383603[/C][C]4.49346461639707[/C][/ROW]
[ROW][C]10[/C][C]456[/C][C]457.093087382778[/C][C]-1.09308738277824[/C][/ROW]
[ROW][C]11[/C][C]472[/C][C]475.698373221407[/C][C]-3.69837322140704[/C][/ROW]
[ROW][C]12[/C][C]472[/C][C]471.310309150289[/C][C]0.689690849710761[/C][/ROW]
[ROW][C]13[/C][C]471[/C][C]464.797068598406[/C][C]6.202931401594[/C][/ROW]
[ROW][C]14[/C][C]465[/C][C]467.333596765683[/C][C]-2.33359676568312[/C][/ROW]
[ROW][C]15[/C][C]459[/C][C]458.145070105568[/C][C]0.8549298944324[/C][/ROW]
[ROW][C]16[/C][C]465[/C][C]464.844088191245[/C][C]0.155911808755206[/C][/ROW]
[ROW][C]17[/C][C]468[/C][C]469.956571582377[/C][C]-1.95657158237703[/C][/ROW]
[ROW][C]18[/C][C]467[/C][C]466.185405549551[/C][C]0.81459445044852[/C][/ROW]
[ROW][C]19[/C][C]463[/C][C]462.864774697687[/C][C]0.135225302312889[/C][/ROW]
[ROW][C]20[/C][C]460[/C][C]459.183683619709[/C][C]0.816316380291088[/C][/ROW]
[ROW][C]21[/C][C]462[/C][C]454.686233957243[/C][C]7.31376604275664[/C][/ROW]
[ROW][C]22[/C][C]461[/C][C]463.336293690102[/C][C]-2.33629369010226[/C][/ROW]
[ROW][C]23[/C][C]476[/C][C]479.636989741218[/C][C]-3.63698974121799[/C][/ROW]
[ROW][C]24[/C][C]476[/C][C]473.752563381991[/C][C]2.24743661800868[/C][/ROW]
[ROW][C]25[/C][C]471[/C][C]467.617270435673[/C][C]3.38272956432737[/C][/ROW]
[ROW][C]26[/C][C]453[/C][C]464.929844473015[/C][C]-11.9298444730149[/C][/ROW]
[ROW][C]27[/C][C]443[/C][C]441.256196746766[/C][C]1.74380325323422[/C][/ROW]
[ROW][C]28[/C][C]442[/C][C]446.592356566429[/C][C]-4.59235656642849[/C][/ROW]
[ROW][C]29[/C][C]444[/C][C]442.724145079585[/C][C]1.27585492041514[/C][/ROW]
[ROW][C]30[/C][C]438[/C][C]441.944061218982[/C][C]-3.94406121898215[/C][/ROW]
[ROW][C]31[/C][C]427[/C][C]432.341818624257[/C][C]-5.34181862425691[/C][/ROW]
[ROW][C]32[/C][C]424[/C][C]422.47570084187[/C][C]1.52429915813040[/C][/ROW]
[ROW][C]33[/C][C]416[/C][C]418.794475855234[/C][C]-2.79447585523408[/C][/ROW]
[ROW][C]34[/C][C]406[/C][C]416.561941952551[/C][C]-10.5619419525511[/C][/ROW]
[ROW][C]35[/C][C]431[/C][C]424.084325178098[/C][C]6.91567482190215[/C][/ROW]
[ROW][C]36[/C][C]434[/C][C]433.835258066388[/C][C]0.164741933611551[/C][/ROW]
[ROW][C]37[/C][C]418[/C][C]427.630933646455[/C][C]-9.63093364645542[/C][/ROW]
[ROW][C]38[/C][C]412[/C][C]410.862858665391[/C][C]1.13714133460895[/C][/ROW]
[ROW][C]39[/C][C]404[/C][C]406.349594299676[/C][C]-2.34959429967591[/C][/ROW]
[ROW][C]40[/C][C]409[/C][C]409.626698930105[/C][C]-0.626698930104898[/C][/ROW]
[ROW][C]41[/C][C]412[/C][C]413.678009735369[/C][C]-1.67800973536868[/C][/ROW]
[ROW][C]42[/C][C]406[/C][C]412.143749789283[/C][C]-6.1437497892827[/C][/ROW]
[ROW][C]43[/C][C]398[/C][C]400.984249223045[/C][C]-2.98424922304517[/C][/ROW]
[ROW][C]44[/C][C]397[/C][C]397.023329027198[/C][C]-0.0233290271975336[/C][/ROW]
[ROW][C]45[/C][C]385[/C][C]393.298417509088[/C][C]-8.2984175090878[/C][/ROW]
[ROW][C]46[/C][C]390[/C][C]385.287510979341[/C][C]4.71248902065898[/C][/ROW]
[ROW][C]47[/C][C]413[/C][C]413.671755324742[/C][C]-0.671755324741569[/C][/ROW]
[ROW][C]48[/C][C]413[/C][C]416.101869401331[/C][C]-3.10186940133097[/C][/ROW]
[ROW][C]49[/C][C]401[/C][C]407.73815704175[/C][C]-6.73815704175009[/C][/ROW]
[ROW][C]50[/C][C]397[/C][C]395.004180905845[/C][C]1.99581909415459[/C][/ROW]
[ROW][C]51[/C][C]397[/C][C]391.94973173376[/C][C]5.05026826624008[/C][/ROW]
[ROW][C]52[/C][C]409[/C][C]405.509847773997[/C][C]3.49015222600313[/C][/ROW]
[ROW][C]53[/C][C]419[/C][C]414.040148599216[/C][C]4.95985140078437[/C][/ROW]
[ROW][C]54[/C][C]424[/C][C]419.157312211344[/C][C]4.84268778865585[/C][/ROW]
[ROW][C]55[/C][C]428[/C][C]421.745579595364[/C][C]6.25442040463558[/C][/ROW]
[ROW][C]56[/C][C]430[/C][C]427.257467426243[/C][C]2.74253257375690[/C][/ROW]
[ROW][C]57[/C][C]424[/C][C]424.714337294832[/C][C]-0.714337294831822[/C][/ROW]
[ROW][C]58[/C][C]433[/C][C]423.721165995227[/C][C]9.27883400477259[/C][/ROW]
[ROW][C]59[/C][C]456[/C][C]454.908556534536[/C][C]1.09144346546445[/C][/ROW]
[/TABLE]
Source: https://freestatistics.org/blog/index.php?pk=67653&T=4

Globally Unique Identifier (entire table): ba.freestatistics.org/blog/index.php?pk=67653&T=4

As an alternative you can also use a QR Code:  

The GUIDs for individual cells are displayed in the table below:

Multiple Linear Regression - Actuals, Interpolation, and Residuals
Time or IndexActualsInterpolationForecastResidualsPrediction Error
1452445.2165702777166.78342972228414
2462450.86951919006611.1304808099344
3455460.299407114231-5.2994071142308
4461459.4270085382251.57299146177506
5461463.601125003454-2.60112500345382
6463458.5694712308404.43052876916047
7462460.0635778596461.93642214035361
8456461.059819084981-5.05981908498085
9455450.5065353836034.49346461639707
10456457.093087382778-1.09308738277824
11472475.698373221407-3.69837322140704
12472471.3103091502890.689690849710761
13471464.7970685984066.202931401594
14465467.333596765683-2.33359676568312
15459458.1450701055680.8549298944324
16465464.8440881912450.155911808755206
17468469.956571582377-1.95657158237703
18467466.1854055495510.81459445044852
19463462.8647746976870.135225302312889
20460459.1836836197090.816316380291088
21462454.6862339572437.31376604275664
22461463.336293690102-2.33629369010226
23476479.636989741218-3.63698974121799
24476473.7525633819912.24743661800868
25471467.6172704356733.38272956432737
26453464.929844473015-11.9298444730149
27443441.2561967467661.74380325323422
28442446.592356566429-4.59235656642849
29444442.7241450795851.27585492041514
30438441.944061218982-3.94406121898215
31427432.341818624257-5.34181862425691
32424422.475700841871.52429915813040
33416418.794475855234-2.79447585523408
34406416.561941952551-10.5619419525511
35431424.0843251780986.91567482190215
36434433.8352580663880.164741933611551
37418427.630933646455-9.63093364645542
38412410.8628586653911.13714133460895
39404406.349594299676-2.34959429967591
40409409.626698930105-0.626698930104898
41412413.678009735369-1.67800973536868
42406412.143749789283-6.1437497892827
43398400.984249223045-2.98424922304517
44397397.023329027198-0.0233290271975336
45385393.298417509088-8.2984175090878
46390385.2875109793414.71248902065898
47413413.671755324742-0.671755324741569
48413416.101869401331-3.10186940133097
49401407.73815704175-6.73815704175009
50397395.0041809058451.99581909415459
51397391.949731733765.05026826624008
52409405.5098477739973.49015222600313
53419414.0401485992164.95985140078437
54424419.1573122113444.84268778865585
55428421.7455795953646.25442040463558
56430427.2574674262432.74253257375690
57424424.714337294832-0.714337294831822
58433423.7211659952279.27883400477259
59456454.9085565345361.09144346546445


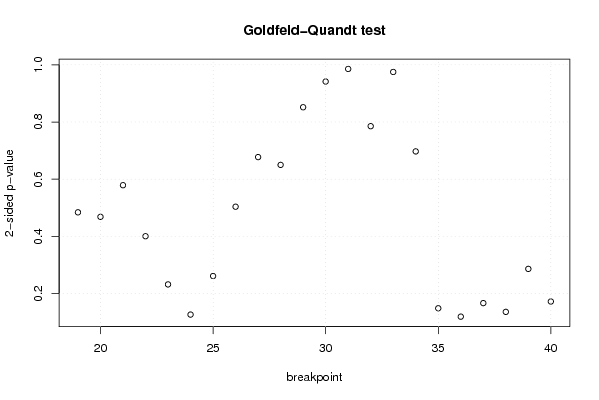
Goldfeld-Quandt test for Heteroskedasticity
p-valuesAlternative Hypothesis
breakpoint indexgreater2-sidedless
190.242072479565770.484144959131540.75792752043423
200.2341802446609170.4683604893218350.765819755339083
210.2894871403388020.5789742806776030.710512859661198
220.2002208464146500.4004416928293010.79977915358535
230.1159430656683010.2318861313366020.884056934331699
240.06314550803874630.1262910160774930.936854491961254
250.1306045931871460.2612091863742930.869395406812854
260.7481274112615180.5037451774769630.251872588738482
270.6613121892407790.6773756215184430.338687810759221
280.6749633683804590.6500732632390820.325036631619541
290.5741484129127150.851703174174570.425851587087285
300.5291584014611260.9416831970777470.470841598538874
310.4928517176316970.9857034352633940.507148282368303
320.3927238405686640.7854476811373280.607276159431336
330.4875650220049410.9751300440098820.512434977995059
340.6513740370281290.6972519259437420.348625962971871
350.9257843457149220.1484313085701560.0742156542850778
360.9404539207111180.1190921585777650.0595460792888824
370.9167569597078750.1664860805842510.0832430402921253
380.932071405855360.1358571882892810.0679285941446407
390.8568895385574790.2862209228850430.143110461442521
400.913970968311260.1720580633774810.0860290316887407

\begin{tabular}{lllllllll}
\hline
Goldfeld-Quandt test for Heteroskedasticity \tabularnewline
p-values & Alternative Hypothesis \tabularnewline
breakpoint index & greater & 2-sided & less \tabularnewline
19 & 0.24207247956577 & 0.48414495913154 & 0.75792752043423 \tabularnewline
20 & 0.234180244660917 & 0.468360489321835 & 0.765819755339083 \tabularnewline
21 & 0.289487140338802 & 0.578974280677603 & 0.710512859661198 \tabularnewline
22 & 0.200220846414650 & 0.400441692829301 & 0.79977915358535 \tabularnewline
23 & 0.115943065668301 & 0.231886131336602 & 0.884056934331699 \tabularnewline
24 & 0.0631455080387463 & 0.126291016077493 & 0.936854491961254 \tabularnewline
25 & 0.130604593187146 & 0.261209186374293 & 0.869395406812854 \tabularnewline
26 & 0.748127411261518 & 0.503745177476963 & 0.251872588738482 \tabularnewline
27 & 0.661312189240779 & 0.677375621518443 & 0.338687810759221 \tabularnewline
28 & 0.674963368380459 & 0.650073263239082 & 0.325036631619541 \tabularnewline
29 & 0.574148412912715 & 0.85170317417457 & 0.425851587087285 \tabularnewline
30 & 0.529158401461126 & 0.941683197077747 & 0.470841598538874 \tabularnewline
31 & 0.492851717631697 & 0.985703435263394 & 0.507148282368303 \tabularnewline
32 & 0.392723840568664 & 0.785447681137328 & 0.607276159431336 \tabularnewline
33 & 0.487565022004941 & 0.975130044009882 & 0.512434977995059 \tabularnewline
34 & 0.651374037028129 & 0.697251925943742 & 0.348625962971871 \tabularnewline
35 & 0.925784345714922 & 0.148431308570156 & 0.0742156542850778 \tabularnewline
36 & 0.940453920711118 & 0.119092158577765 & 0.0595460792888824 \tabularnewline
37 & 0.916756959707875 & 0.166486080584251 & 0.0832430402921253 \tabularnewline
38 & 0.93207140585536 & 0.135857188289281 & 0.0679285941446407 \tabularnewline
39 & 0.856889538557479 & 0.286220922885043 & 0.143110461442521 \tabularnewline
40 & 0.91397096831126 & 0.172058063377481 & 0.0860290316887407 \tabularnewline
\hline
\end{tabular}
%Source: https://freestatistics.org/blog/index.php?pk=67653&T=5

[TABLE]
[ROW][C]Goldfeld-Quandt test for Heteroskedasticity[/C][/ROW]
[ROW][C]p-values[/C][C]Alternative Hypothesis[/C][/ROW]
[ROW][C]breakpoint index[/C][C]greater[/C][C]2-sided[/C][C]less[/C][/ROW]
[ROW][C]19[/C][C]0.24207247956577[/C][C]0.48414495913154[/C][C]0.75792752043423[/C][/ROW]
[ROW][C]20[/C][C]0.234180244660917[/C][C]0.468360489321835[/C][C]0.765819755339083[/C][/ROW]
[ROW][C]21[/C][C]0.289487140338802[/C][C]0.578974280677603[/C][C]0.710512859661198[/C][/ROW]
[ROW][C]22[/C][C]0.200220846414650[/C][C]0.400441692829301[/C][C]0.79977915358535[/C][/ROW]
[ROW][C]23[/C][C]0.115943065668301[/C][C]0.231886131336602[/C][C]0.884056934331699[/C][/ROW]
[ROW][C]24[/C][C]0.0631455080387463[/C][C]0.126291016077493[/C][C]0.936854491961254[/C][/ROW]
[ROW][C]25[/C][C]0.130604593187146[/C][C]0.261209186374293[/C][C]0.869395406812854[/C][/ROW]
[ROW][C]26[/C][C]0.748127411261518[/C][C]0.503745177476963[/C][C]0.251872588738482[/C][/ROW]
[ROW][C]27[/C][C]0.661312189240779[/C][C]0.677375621518443[/C][C]0.338687810759221[/C][/ROW]
[ROW][C]28[/C][C]0.674963368380459[/C][C]0.650073263239082[/C][C]0.325036631619541[/C][/ROW]
[ROW][C]29[/C][C]0.574148412912715[/C][C]0.85170317417457[/C][C]0.425851587087285[/C][/ROW]
[ROW][C]30[/C][C]0.529158401461126[/C][C]0.941683197077747[/C][C]0.470841598538874[/C][/ROW]
[ROW][C]31[/C][C]0.492851717631697[/C][C]0.985703435263394[/C][C]0.507148282368303[/C][/ROW]
[ROW][C]32[/C][C]0.392723840568664[/C][C]0.785447681137328[/C][C]0.607276159431336[/C][/ROW]
[ROW][C]33[/C][C]0.487565022004941[/C][C]0.975130044009882[/C][C]0.512434977995059[/C][/ROW]
[ROW][C]34[/C][C]0.651374037028129[/C][C]0.697251925943742[/C][C]0.348625962971871[/C][/ROW]
[ROW][C]35[/C][C]0.925784345714922[/C][C]0.148431308570156[/C][C]0.0742156542850778[/C][/ROW]
[ROW][C]36[/C][C]0.940453920711118[/C][C]0.119092158577765[/C][C]0.0595460792888824[/C][/ROW]
[ROW][C]37[/C][C]0.916756959707875[/C][C]0.166486080584251[/C][C]0.0832430402921253[/C][/ROW]
[ROW][C]38[/C][C]0.93207140585536[/C][C]0.135857188289281[/C][C]0.0679285941446407[/C][/ROW]
[ROW][C]39[/C][C]0.856889538557479[/C][C]0.286220922885043[/C][C]0.143110461442521[/C][/ROW]
[ROW][C]40[/C][C]0.91397096831126[/C][C]0.172058063377481[/C][C]0.0860290316887407[/C][/ROW]
[/TABLE]
Source: https://freestatistics.org/blog/index.php?pk=67653&T=5

Globally Unique Identifier (entire table): ba.freestatistics.org/blog/index.php?pk=67653&T=5

As an alternative you can also use a QR Code:  

The GUIDs for individual cells are displayed in the table below:

Goldfeld-Quandt test for Heteroskedasticity
p-valuesAlternative Hypothesis
breakpoint indexgreater2-sidedless
190.242072479565770.484144959131540.75792752043423
200.2341802446609170.4683604893218350.765819755339083
210.2894871403388020.5789742806776030.710512859661198
220.2002208464146500.4004416928293010.79977915358535
230.1159430656683010.2318861313366020.884056934331699
240.06314550803874630.1262910160774930.936854491961254
250.1306045931871460.2612091863742930.869395406812854
260.7481274112615180.5037451774769630.251872588738482
270.6613121892407790.6773756215184430.338687810759221
280.6749633683804590.6500732632390820.325036631619541
290.5741484129127150.851703174174570.425851587087285
300.5291584014611260.9416831970777470.470841598538874
310.4928517176316970.9857034352633940.507148282368303
320.3927238405686640.7854476811373280.607276159431336
330.4875650220049410.9751300440098820.512434977995059
340.6513740370281290.6972519259437420.348625962971871
350.9257843457149220.1484313085701560.0742156542850778
360.9404539207111180.1190921585777650.0595460792888824
370.9167569597078750.1664860805842510.0832430402921253
380.932071405855360.1358571882892810.0679285941446407
390.8568895385574790.2862209228850430.143110461442521
400.913970968311260.1720580633774810.0860290316887407


Meta Analysis of Goldfeld-Quandt test for Heteroskedasticity
Description# significant tests% significant testsOK/NOK
1% type I error level00OK
5% type I error level00OK
10% type I error level00OK

\begin{tabular}{lllllllll}
\hline
Meta Analysis of Goldfeld-Quandt test for Heteroskedasticity \tabularnewline
Description & # significant tests & % significant tests & OK/NOK \tabularnewline
1% type I error level & 0 & 0 & OK \tabularnewline
5% type I error level & 0 & 0 & OK \tabularnewline
10% type I error level & 0 & 0 & OK \tabularnewline
\hline
\end{tabular}
%Source: https://freestatistics.org/blog/index.php?pk=67653&T=6

[TABLE]
[ROW][C]Meta Analysis of Goldfeld-Quandt test for Heteroskedasticity[/C][/ROW]
[ROW][C]Description[/C][C]# significant tests[/C][C]% significant tests[/C][C]OK/NOK[/C][/ROW]
[ROW][C]1% type I error level[/C][C]0[/C][C]0[/C][C]OK[/C][/ROW]
[ROW][C]5% type I error level[/C][C]0[/C][C]0[/C][C]OK[/C][/ROW]
[ROW][C]10% type I error level[/C][C]0[/C][C]0[/C][C]OK[/C][/ROW]
[/TABLE]
Source: https://freestatistics.org/blog/index.php?pk=67653&T=6

Globally Unique Identifier (entire table): ba.freestatistics.org/blog/index.php?pk=67653&T=6

As an alternative you can also use a QR Code:  

The GUIDs for individual cells are displayed in the table below:

Meta Analysis of Goldfeld-Quandt test for Heteroskedasticity
Description# significant tests% significant testsOK/NOK
1% type I error level00OK
5% type I error level00OK
10% type I error level00OK


Parameters (Session):
par1 = 1 ; par2 = Include Monthly Dummies ; par3 = Linear Trend ;
Parameters (R input):
par1 = 1 ; par2 = Include Monthly Dummies ; par3 = Linear Trend ;
R code (references can be found in the software module):
library(lattice)
library(lmtest)
n25 <- 25 #minimum number of obs. for Goldfeld-Quandt test
par1 <- as.numeric(par1)
x <- t(y)
k <- length(x[1,])
n <- length(x[,1])
x1 <- cbind(x[,par1], x[,1:k!=par1])
mycolnames <- c(colnames(x)[par1], colnames(x)[1:k!=par1])
colnames(x1) <- mycolnames #colnames(x)[par1]
x <- x1
if (par3 == 'First Differences'){
x2 <- array(0, dim=c(n-1,k), dimnames=list(1:(n-1), paste('(1-B)',colnames(x),sep='')))
for (i in 1:n-1) {
for (j in 1:k) {
x2[i,j] <- x[i+1,j] - x[i,j]
}
}
x <- x2
}
if (par2 == 'Include Monthly Dummies'){
x2 <- array(0, dim=c(n,11), dimnames=list(1:n, paste('M', seq(1:11), sep ='')))
for (i in 1:11){
x2[seq(i,n,12),i] <- 1
}
x <- cbind(x, x2)
}
if (par2 == 'Include Quarterly Dummies'){
x2 <- array(0, dim=c(n,3), dimnames=list(1:n, paste('Q', seq(1:3), sep ='')))
for (i in 1:3){
x2[seq(i,n,4),i] <- 1
}
x <- cbind(x, x2)
}
k <- length(x[1,])
if (par3 == 'Linear Trend'){
x <- cbind(x, c(1:n))
colnames(x)[k+1] <- 't'
}
x
k <- length(x[1,])
df <- as.data.frame(x)
(mylm <- lm(df))
(mysum <- summary(mylm))
if (n > n25) {
kp3 <- k + 3
nmkm3 <- n - k - 3
gqarr <- array(NA, dim=c(nmkm3-kp3+1,3))
numgqtests <- 0
numsignificant1 <- 0
numsignificant5 <- 0
numsignificant10 <- 0
for (mypoint in kp3:nmkm3) {
j <- 0
numgqtests <- numgqtests + 1
for (myalt in c('greater', 'two.sided', 'less')) {
j <- j + 1
gqarr[mypoint-kp3+1,j] <- gqtest(mylm, point=mypoint, alternative=myalt)$p.value
}
if (gqarr[mypoint-kp3+1,2] < 0.01) numsignificant1 <- numsignificant1 + 1
if (gqarr[mypoint-kp3+1,2] < 0.05) numsignificant5 <- numsignificant5 + 1
if (gqarr[mypoint-kp3+1,2] < 0.10) numsignificant10 <- numsignificant10 + 1
}
gqarr
}
bitmap(file='test0.png')
plot(x[,1], type='l', main='Actuals and Interpolation', ylab='value of Actuals and Interpolation (dots)', xlab='time or index')
points(x[,1]-mysum$resid)
grid()
dev.off()
bitmap(file='test1.png')
plot(mysum$resid, type='b', pch=19, main='Residuals', ylab='value of Residuals', xlab='time or index')
grid()
dev.off()
bitmap(file='test2.png')
hist(mysum$resid, main='Residual Histogram', xlab='values of Residuals')
grid()
dev.off()
bitmap(file='test3.png')
densityplot(~mysum$resid,col='black',main='Residual Density Plot', xlab='values of Residuals')
dev.off()
bitmap(file='test4.png')
qqnorm(mysum$resid, main='Residual Normal Q-Q Plot')
qqline(mysum$resid)
grid()
dev.off()
(myerror <- as.ts(mysum$resid))
bitmap(file='test5.png')
dum <- cbind(lag(myerror,k=1),myerror)
dum
dum1 <- dum[2:length(myerror),]
dum1
z <- as.data.frame(dum1)
z
plot(z,main=paste('Residual Lag plot, lowess, and regression line'), ylab='values of Residuals', xlab='lagged values of Residuals')
lines(lowess(z))
abline(lm(z))
grid()
dev.off()
bitmap(file='test6.png')
acf(mysum$resid, lag.max=length(mysum$resid)/2, main='Residual Autocorrelation Function')
grid()
dev.off()
bitmap(file='test7.png')
pacf(mysum$resid, lag.max=length(mysum$resid)/2, main='Residual Partial Autocorrelation Function')
grid()
dev.off()
bitmap(file='test8.png')
opar <- par(mfrow = c(2,2), oma = c(0, 0, 1.1, 0))
plot(mylm, las = 1, sub='Residual Diagnostics')
par(opar)
dev.off()
if (n > n25) {
bitmap(file='test9.png')
plot(kp3:nmkm3,gqarr[,2], main='Goldfeld-Quandt test',ylab='2-sided p-value',xlab='breakpoint')
grid()
dev.off()
}
load(file='createtable')
a<-table.start()
a<-table.row.start(a)
a<-table.element(a, 'Multiple Linear Regression - Estimated Regression Equation', 1, TRUE)
a<-table.row.end(a)
myeq <- colnames(x)[1]
myeq <- paste(myeq, '[t] = ', sep='')
for (i in 1:k){
if (mysum$coefficients[i,1] > 0) myeq <- paste(myeq, '+', '')
myeq <- paste(myeq, mysum$coefficients[i,1], sep=' ')
if (rownames(mysum$coefficients)[i] != '(Intercept)') {
myeq <- paste(myeq, rownames(mysum$coefficients)[i], sep='')
if (rownames(mysum$coefficients)[i] != 't') myeq <- paste(myeq, '[t]', sep='')
}
}
myeq <- paste(myeq, ' + e[t]')
a<-table.row.start(a)
a<-table.element(a, myeq)
a<-table.row.end(a)
a<-table.end(a)
table.save(a,file='mytable1.tab')
a<-table.start()
a<-table.row.start(a)
a<-table.element(a,hyperlink('ols1.htm','Multiple Linear Regression - Ordinary Least Squares',''), 6, TRUE)
a<-table.row.end(a)
a<-table.row.start(a)
a<-table.element(a,'Variable',header=TRUE)
a<-table.element(a,'Parameter',header=TRUE)
a<-table.element(a,'S.D.',header=TRUE)
a<-table.element(a,'T-STAT
H0: parameter = 0',header=TRUE)
a<-table.element(a,'2-tail p-value',header=TRUE)
a<-table.element(a,'1-tail p-value',header=TRUE)
a<-table.row.end(a)
for (i in 1:k){
a<-table.row.start(a)
a<-table.element(a,rownames(mysum$coefficients)[i],header=TRUE)
a<-table.element(a,mysum$coefficients[i,1])
a<-table.element(a, round(mysum$coefficients[i,2],6))
a<-table.element(a, round(mysum$coefficients[i,3],4))
a<-table.element(a, round(mysum$coefficients[i,4],6))
a<-table.element(a, round(mysum$coefficients[i,4]/2,6))
a<-table.row.end(a)
}
a<-table.end(a)
table.save(a,file='mytable2.tab')
a<-table.start()
a<-table.row.start(a)
a<-table.element(a, 'Multiple Linear Regression - Regression Statistics', 2, TRUE)
a<-table.row.end(a)
a<-table.row.start(a)
a<-table.element(a, 'Multiple R',1,TRUE)
a<-table.element(a, sqrt(mysum$r.squared))
a<-table.row.end(a)
a<-table.row.start(a)
a<-table.element(a, 'R-squared',1,TRUE)
a<-table.element(a, mysum$r.squared)
a<-table.row.end(a)
a<-table.row.start(a)
a<-table.element(a, 'Adjusted R-squared',1,TRUE)
a<-table.element(a, mysum$adj.r.squared)
a<-table.row.end(a)
a<-table.row.start(a)
a<-table.element(a, 'F-TEST (value)',1,TRUE)
a<-table.element(a, mysum$fstatistic[1])
a<-table.row.end(a)
a<-table.row.start(a)
a<-table.element(a, 'F-TEST (DF numerator)',1,TRUE)
a<-table.element(a, mysum$fstatistic[2])
a<-table.row.end(a)
a<-table.row.start(a)
a<-table.element(a, 'F-TEST (DF denominator)',1,TRUE)
a<-table.element(a, mysum$fstatistic[3])
a<-table.row.end(a)
a<-table.row.start(a)
a<-table.element(a, 'p-value',1,TRUE)
a<-table.element(a, 1-pf(mysum$fstatistic[1],mysum$fstatistic[2],mysum$fstatistic[3]))
a<-table.row.end(a)
a<-table.row.start(a)
a<-table.element(a, 'Multiple Linear Regression - Residual Statistics', 2, TRUE)
a<-table.row.end(a)
a<-table.row.start(a)
a<-table.element(a, 'Residual Standard Deviation',1,TRUE)
a<-table.element(a, mysum$sigma)
a<-table.row.end(a)
a<-table.row.start(a)
a<-table.element(a, 'Sum Squared Residuals',1,TRUE)
a<-table.element(a, sum(myerror*myerror))
a<-table.row.end(a)
a<-table.end(a)
table.save(a,file='mytable3.tab')
a<-table.start()
a<-table.row.start(a)
a<-table.element(a, 'Multiple Linear Regression - Actuals, Interpolation, and Residuals', 4, TRUE)
a<-table.row.end(a)
a<-table.row.start(a)
a<-table.element(a, 'Time or Index', 1, TRUE)
a<-table.element(a, 'Actuals', 1, TRUE)
a<-table.element(a, 'Interpolation
Forecast', 1, TRUE)
a<-table.element(a, 'Residuals
Prediction Error', 1, TRUE)
a<-table.row.end(a)
for (i in 1:n) {
a<-table.row.start(a)
a<-table.element(a,i, 1, TRUE)
a<-table.element(a,x[i])
a<-table.element(a,x[i]-mysum$resid[i])
a<-table.element(a,mysum$resid[i])
a<-table.row.end(a)
}
a<-table.end(a)
table.save(a,file='mytable4.tab')
if (n > n25) {
a<-table.start()
a<-table.row.start(a)
a<-table.element(a,'Goldfeld-Quandt test for Heteroskedasticity',4,TRUE)
a<-table.row.end(a)
a<-table.row.start(a)
a<-table.element(a,'p-values',header=TRUE)
a<-table.element(a,'Alternative Hypothesis',3,header=TRUE)
a<-table.row.end(a)
a<-table.row.start(a)
a<-table.element(a,'breakpoint index',header=TRUE)
a<-table.element(a,'greater',header=TRUE)
a<-table.element(a,'2-sided',header=TRUE)
a<-table.element(a,'less',header=TRUE)
a<-table.row.end(a)
for (mypoint in kp3:nmkm3) {
a<-table.row.start(a)
a<-table.element(a,mypoint,header=TRUE)
a<-table.element(a,gqarr[mypoint-kp3+1,1])
a<-table.element(a,gqarr[mypoint-kp3+1,2])
a<-table.element(a,gqarr[mypoint-kp3+1,3])
a<-table.row.end(a)
}
a<-table.end(a)
table.save(a,file='mytable5.tab')
a<-table.start()
a<-table.row.start(a)
a<-table.element(a,'Meta Analysis of Goldfeld-Quandt test for Heteroskedasticity',4,TRUE)
a<-table.row.end(a)
a<-table.row.start(a)
a<-table.element(a,'Description',header=TRUE)
a<-table.element(a,'# significant tests',header=TRUE)
a<-table.element(a,'% significant tests',header=TRUE)
a<-table.element(a,'OK/NOK',header=TRUE)
a<-table.row.end(a)
a<-table.row.start(a)
a<-table.element(a,'1% type I error level',header=TRUE)
a<-table.element(a,numsignificant1)
a<-table.element(a,numsignificant1/numgqtests)
if (numsignificant1/numgqtests < 0.01) dum <- 'OK' else dum <- 'NOK'
a<-table.element(a,dum)
a<-table.row.end(a)
a<-table.row.start(a)
a<-table.element(a,'5% type I error level',header=TRUE)
a<-table.element(a,numsignificant5)
a<-table.element(a,numsignificant5/numgqtests)
if (numsignificant5/numgqtests < 0.05) dum <- 'OK' else dum <- 'NOK'
a<-table.element(a,dum)
a<-table.row.end(a)
a<-table.row.start(a)
a<-table.element(a,'10% type I error level',header=TRUE)
a<-table.element(a,numsignificant10)
a<-table.element(a,numsignificant10/numgqtests)
if (numsignificant10/numgqtests < 0.1) dum <- 'OK' else dum <- 'NOK'
a<-table.element(a,dum)
a<-table.row.end(a)
a<-table.end(a)
table.save(a,file='mytable6.tab')
}