Free Statistics
of Irreproducible Research!
Description of Statistical Computation | |||||||||||||||||||||||||||||||||||||||||
|---|---|---|---|---|---|---|---|---|---|---|---|---|---|---|---|---|---|---|---|---|---|---|---|---|---|---|---|---|---|---|---|---|---|---|---|---|---|---|---|---|---|
| Author's title | |||||||||||||||||||||||||||||||||||||||||
| Author | *The author of this computation has been verified* | ||||||||||||||||||||||||||||||||||||||||
| R Software Module | rwasp_univariatedataseries.wasp | ||||||||||||||||||||||||||||||||||||||||
| Title produced by software | Univariate Data Series | ||||||||||||||||||||||||||||||||||||||||
| Date of computation | Mon, 14 Dec 2009 11:10:40 -0700 | ||||||||||||||||||||||||||||||||||||||||
| Cite this page as follows | Statistical Computations at FreeStatistics.org, Office for Research Development and Education, URL https://freestatistics.org/blog/index.php?v=date/2009/Dec/14/t1260814265otj6rswqh1rx2c2.htm/, Retrieved Fri, 05 Jun 2026 19:51:37 +0000 | ||||||||||||||||||||||||||||||||||||||||
| Statistical Computations at FreeStatistics.org, Office for Research Development and Education, URL https://freestatistics.org/blog/index.php?pk=67607, Retrieved Fri, 05 Jun 2026 19:51:37 +0000 | |||||||||||||||||||||||||||||||||||||||||
| QR Codes: | |||||||||||||||||||||||||||||||||||||||||
|
| |||||||||||||||||||||||||||||||||||||||||
| Original text written by user: | |||||||||||||||||||||||||||||||||||||||||
| IsPrivate? | No (this computation is public) | ||||||||||||||||||||||||||||||||||||||||
| User-defined keywords | |||||||||||||||||||||||||||||||||||||||||
| Estimated Impact | 285 | ||||||||||||||||||||||||||||||||||||||||
Tree of Dependent Computations | |||||||||||||||||||||||||||||||||||||||||
| Family? (F = Feedback message, R = changed R code, M = changed R Module, P = changed Parameters, D = changed Data) | |||||||||||||||||||||||||||||||||||||||||
| - [Univariate Data Series] [Indexcijfers van ...] [2009-12-14 18:10:40] [0f1f1142419956a95ff6f880845f2408] [Current] - P [Univariate Data Series] [] [2009-12-17 11:14:52] [a4642ac6536e7ce898d9b031a7452eab] - R PD [Univariate Data Series] [de indexcijfers v...] [2012-12-14 17:11:43] [da21a4ad0d643c5ab6ae91160bdaaba7] | |||||||||||||||||||||||||||||||||||||||||
| Feedback Forum | |||||||||||||||||||||||||||||||||||||||||
Post a new message | |||||||||||||||||||||||||||||||||||||||||
Dataset | |||||||||||||||||||||||||||||||||||||||||
| Dataseries X: | |||||||||||||||||||||||||||||||||||||||||
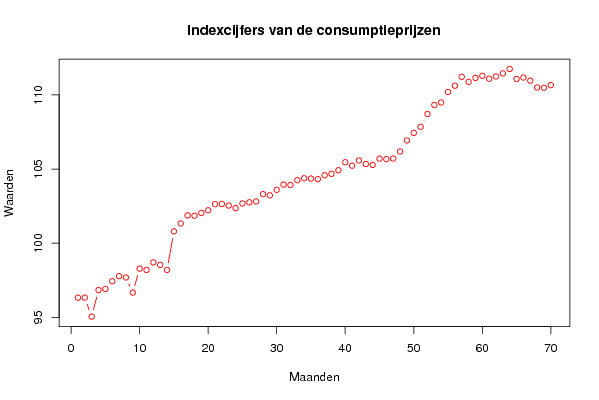
96,33 96,33 95,05 96,84 96,92 97,44 97,78 97,69 96,67 98,29 98,2 98,71 98,54 98,2 100,8 101,33 101,88 101,85 102,04 102,22 102,63 102,65 102,54 102,37 102,68 102,76 102,82 103,31 103,23 103,6 103,95 103,93 104,25 104,38 104,36 104,32 104,58 104,68 104,92 105,46 105,23 105,58 105,34 105,28 105,7 105,67 105,71 106,19 106,93 107,44 107,85 108,71 109,32 109,49 110,2 110,62 111,22 110,88 111,15 111,29 111,09 111,24 111,45 111,75 111,07 111,17 110,96 110,5 110,48 110,66 | |||||||||||||||||||||||||||||||||||||||||
Tables (Output of Computation) | |||||||||||||||||||||||||||||||||||||||||
| |||||||||||||||||||||||||||||||||||||||||
Figures (Output of Computation) | |||||||||||||||||||||||||||||||||||||||||
Input Parameters & R Code | |||||||||||||||||||||||||||||||||||||||||
| Parameters (Session): | |||||||||||||||||||||||||||||||||||||||||
| par1 = Indexcijfers van de consumptieprijzen - synthese tabel (2004=100) ; par2 = NNB ; par3 = 30/11/2003-31/08/2009 ; | |||||||||||||||||||||||||||||||||||||||||
| Parameters (R input): | |||||||||||||||||||||||||||||||||||||||||
| par1 = Indexcijfers van de consumptieprijzen - synthese tabel (2004=100) ; par2 = NNB ; par3 = 30/11/2003-31/08/2009 ; | |||||||||||||||||||||||||||||||||||||||||
| R code (references can be found in the software module): | |||||||||||||||||||||||||||||||||||||||||
bitmap(file='test1.png') | |||||||||||||||||||||||||||||||||||||||||