Free Statistics

of Irreproducible Research!

Author's title

Author*The author of this computation has been verified*
R Software Modulerwasp_multipleregression.wasp
Title produced by softwareMultiple Regression
Date of computationSat, 12 Dec 2009 11:05:52 -0700
Cite this page as followsStatistical Computations at FreeStatistics.org, Office for Research Development and Education, URL https://freestatistics.org/blog/index.php?v=date/2009/Dec/12/t1260641320oir3ikr7ts9o9wv.htm/, Retrieved Sun, 28 Apr 2024 11:11:56 +0000
Statistical Computations at FreeStatistics.org, Office for Research Development and Education, URL https://freestatistics.org/blog/index.php?pk=67109, Retrieved Sun, 28 Apr 2024 11:11:56 +0000
QR Codes:

Original text written by user:
IsPrivate?No (this computation is public)
User-defined keywords
Estimated Impact139
Family? (F = Feedback message, R = changed R code, M = changed R Module, P = changed Parameters, D = changed Data)
-     [Multiple Regression] [Q1 The Seatbeltlaw] [2007-11-14 19:27:43] [8cd6641b921d30ebe00b648d1481bba0]
- RMPD  [Multiple Regression] [Seatbelt] [2009-11-12 13:54:52] [b98453cac15ba1066b407e146608df68]
-    D    [Multiple Regression] [SHW WS7] [2009-11-20 10:54:07] [253127ae8da904b75450fbd69fe4eb21]
-    D      [Multiple Regression] [WS 7.1] [2009-11-20 20:55:39] [d31db4f83c6a129f6d3e47077769e868]
-   P         [Multiple Regression] [WS 7.2] [2009-11-20 21:37:01] [d31db4f83c6a129f6d3e47077769e868]
-   P           [Multiple Regression] [WS 7.3] [2009-11-20 22:04:53] [d31db4f83c6a129f6d3e47077769e868]
-   PD            [Multiple Regression] [Paper Multiple Re...] [2009-12-12 17:59:55] [d31db4f83c6a129f6d3e47077769e868]
-                     [Multiple Regression] [Paper. Multi Regr...] [2009-12-12 18:05:52] [852eae237d08746109043531619a60c9] [Current]
-                       [Multiple Regression] [Paper. Multi Regr...] [2009-12-12 18:09:49] [d31db4f83c6a129f6d3e47077769e868]
-                         [Multiple Regression] [Paper. Multi Regr...] [2009-12-12 18:12:04] [d31db4f83c6a129f6d3e47077769e868]
-                           [Multiple Regression] [Paper. Multi Regr...] [2009-12-12 18:14:53] [d31db4f83c6a129f6d3e47077769e868]
-                           [Multiple Regression] [Paper. Multi Regr...] [2009-12-12 18:19:05] [d31db4f83c6a129f6d3e47077769e868]
Feedback Forum

Post a new message
Dataseries X:
593530	3922	18004	707169
610763	3759	17537	703434
612613	4138	20366	701017
611324	4634	22782	696968
594167	3996	19169	688558
595454	4308	13807	679237
590865	4143	29743	677362
589379	4429	25591	676693
584428	5219	29096	670009
573100	4929	26482	667209
567456	5761	22405	662976
569028	5592	27044	660194
620735	4163	17970	652270
628884	4962	18730	648024
628232	5208	19684	629295
612117	4755	19785	624961
595404	4491	18479	617306
597141	5732	10698	607691
593408	5731	31956	596219
590072	5040	29506	591130
579799	6102	34506	584528
574205	4904	27165	576798
572775	5369	26736	575683
572942	5578	23691	574369
619567	4619	18157	566815
625809	4731	17328	573074
619916	5011	18205	567739
587625	5299	20995	571942
565742	4146	17382	570274
557274	4625	9367	568800
560576	4736	31124	558115
548854	4219	26551	550591
531673	5116	30651	548872
525919	4205	25859	547009
511038	4121	25100	545946
498662	5103	25778	539702
555362	4300	20418	542427
564591	4578	18688	542968
541657	3809	20424	536640
527070	5526	24776	533653
509846	4248	19814	540996
514258	3830	12738	538316
516922	4428	31566	532646
507561	4834	30111	533390
492622	4406	30019	528715
490243	4565	31934	530664
469357	4104	25826	528564
477580	4798	26835	519107
528379	3935	20205	518703
533590	3792	17789	519059
517945	4387	20520	518498
506174	4006	22518	524575
501866	4078	15572	536046
516141	4724	11509	552006
528222	3157	25447	560687
532638	3558	24090	578884
536322	3899	27786	591491
536535	4118	26195	599228
523597	3790	20516	633019
536214	4278	22759	649918
586570	4035	19028	655509


Summary of computational transaction
Raw Inputview raw input (R code)
Raw Outputview raw output of R engine
Computing time3 seconds
R Server'Gwilym Jenkins' @ 72.249.127.135

\begin{tabular}{lllllllll}
\hline
Summary of computational transaction \tabularnewline
Raw Input & view raw input (R code)  \tabularnewline
Raw Output & view raw output of R engine  \tabularnewline
Computing time & 3 seconds \tabularnewline
R Server & 'Gwilym Jenkins' @ 72.249.127.135 \tabularnewline
\hline
\end{tabular}
%Source: https://freestatistics.org/blog/index.php?pk=67109&T=0

[TABLE]
[ROW][C]Summary of computational transaction[/C][/ROW]
[ROW][C]Raw Input[/C][C]view raw input (R code) [/C][/ROW]
[ROW][C]Raw Output[/C][C]view raw output of R engine [/C][/ROW]
[ROW][C]Computing time[/C][C]3 seconds[/C][/ROW]
[ROW][C]R Server[/C][C]'Gwilym Jenkins' @ 72.249.127.135[/C][/ROW]
[/TABLE]
Source: https://freestatistics.org/blog/index.php?pk=67109&T=0

Globally Unique Identifier (entire table): ba.freestatistics.org/blog/index.php?pk=67109&T=0

As an alternative you can also use a QR Code:  

The GUIDs for individual cells are displayed in the table below:

Summary of computational transaction
Raw Inputview raw input (R code)
Raw Outputview raw output of R engine
Computing time3 seconds
R Server'Gwilym Jenkins' @ 72.249.127.135


Multiple Linear Regression - Estimated Regression Equation
Werkzoekend[t] = + 226473.427381757 + 21.4576880953638Bouw[t] -1.90264946961537Auto[t] + 0.469588601620351Krediet[t] + e[t]

\begin{tabular}{lllllllll}
\hline
Multiple Linear Regression - Estimated Regression Equation \tabularnewline
Werkzoekend[t] =  +  226473.427381757 +  21.4576880953638Bouw[t] -1.90264946961537Auto[t] +  0.469588601620351Krediet[t]  + e[t] \tabularnewline
\hline
\end{tabular}
%Source: https://freestatistics.org/blog/index.php?pk=67109&T=1

[TABLE]
[ROW][C]Multiple Linear Regression - Estimated Regression Equation[/C][/ROW]
[ROW][C]Werkzoekend[t] =  +  226473.427381757 +  21.4576880953638Bouw[t] -1.90264946961537Auto[t] +  0.469588601620351Krediet[t]  + e[t][/C][/ROW]
[/TABLE]
Source: https://freestatistics.org/blog/index.php?pk=67109&T=1

Globally Unique Identifier (entire table): ba.freestatistics.org/blog/index.php?pk=67109&T=1

As an alternative you can also use a QR Code:  

The GUIDs for individual cells are displayed in the table below:

Multiple Linear Regression - Estimated Regression Equation
Werkzoekend[t] = + 226473.427381757 + 21.4576880953638Bouw[t] -1.90264946961537Auto[t] + 0.469588601620351Krediet[t] + e[t]


Multiple Linear Regression - Ordinary Least Squares
VariableParameterS.D.T-STATH0: parameter = 02-tail p-value1-tail p-value
(Intercept)226473.42738175745628.4103394.96347e-063e-06
Bouw21.45768809536385.894343.64040.0005880.000294
Auto-1.902649469615370.64903-2.93150.0048470.002424
Krediet0.4695886016203510.0618797.588800

\begin{tabular}{lllllllll}
\hline
Multiple Linear Regression - Ordinary Least Squares \tabularnewline
Variable & Parameter & S.D. & T-STATH0: parameter = 0 & 2-tail p-value & 1-tail p-value \tabularnewline
(Intercept) & 226473.427381757 & 45628.410339 & 4.9634 & 7e-06 & 3e-06 \tabularnewline
Bouw & 21.4576880953638 & 5.89434 & 3.6404 & 0.000588 & 0.000294 \tabularnewline
Auto & -1.90264946961537 & 0.64903 & -2.9315 & 0.004847 & 0.002424 \tabularnewline
Krediet & 0.469588601620351 & 0.061879 & 7.5888 & 0 & 0 \tabularnewline
\hline
\end{tabular}
%Source: https://freestatistics.org/blog/index.php?pk=67109&T=2

[TABLE]
[ROW][C]Multiple Linear Regression - Ordinary Least Squares[/C][/ROW]
[ROW][C]Variable[/C][C]Parameter[/C][C]S.D.[/C][C]T-STATH0: parameter = 0[/C][C]2-tail p-value[/C][C]1-tail p-value[/C][/ROW]
[ROW][C](Intercept)[/C][C]226473.427381757[/C][C]45628.410339[/C][C]4.9634[/C][C]7e-06[/C][C]3e-06[/C][/ROW]
[ROW][C]Bouw[/C][C]21.4576880953638[/C][C]5.89434[/C][C]3.6404[/C][C]0.000588[/C][C]0.000294[/C][/ROW]
[ROW][C]Auto[/C][C]-1.90264946961537[/C][C]0.64903[/C][C]-2.9315[/C][C]0.004847[/C][C]0.002424[/C][/ROW]
[ROW][C]Krediet[/C][C]0.469588601620351[/C][C]0.061879[/C][C]7.5888[/C][C]0[/C][C]0[/C][/ROW]
[/TABLE]
Source: https://freestatistics.org/blog/index.php?pk=67109&T=2

Globally Unique Identifier (entire table): ba.freestatistics.org/blog/index.php?pk=67109&T=2

As an alternative you can also use a QR Code:  

The GUIDs for individual cells are displayed in the table below:

Multiple Linear Regression - Ordinary Least Squares
VariableParameterS.D.T-STATH0: parameter = 02-tail p-value1-tail p-value
(Intercept)226473.42738175745628.4103394.96347e-063e-06
Bouw21.45768809536385.894343.64040.0005880.000294
Auto-1.902649469615370.64903-2.93150.0048470.002424
Krediet0.4695886016203510.0618797.588800


Multiple Linear Regression - Regression Statistics
Multiple R0.77380861565493
R-squared0.598779773661799
Adjusted R-squared0.577662919643999
F-TEST (value)28.3555388107086
F-TEST (DF numerator)3
F-TEST (DF denominator)57
p-value2.37367903110908e-11
Multiple Linear Regression - Residual Statistics
Residual Standard Deviation27599.8633201017
Sum Squared Residuals43419889951.4327

\begin{tabular}{lllllllll}
\hline
Multiple Linear Regression - Regression Statistics \tabularnewline
Multiple R & 0.77380861565493 \tabularnewline
R-squared & 0.598779773661799 \tabularnewline
Adjusted R-squared & 0.577662919643999 \tabularnewline
F-TEST (value) & 28.3555388107086 \tabularnewline
F-TEST (DF numerator) & 3 \tabularnewline
F-TEST (DF denominator) & 57 \tabularnewline
p-value & 2.37367903110908e-11 \tabularnewline
Multiple Linear Regression - Residual Statistics \tabularnewline
Residual Standard Deviation & 27599.8633201017 \tabularnewline
Sum Squared Residuals & 43419889951.4327 \tabularnewline
\hline
\end{tabular}
%Source: https://freestatistics.org/blog/index.php?pk=67109&T=3

[TABLE]
[ROW][C]Multiple Linear Regression - Regression Statistics[/C][/ROW]
[ROW][C]Multiple R[/C][C]0.77380861565493[/C][/ROW]
[ROW][C]R-squared[/C][C]0.598779773661799[/C][/ROW]
[ROW][C]Adjusted R-squared[/C][C]0.577662919643999[/C][/ROW]
[ROW][C]F-TEST (value)[/C][C]28.3555388107086[/C][/ROW]
[ROW][C]F-TEST (DF numerator)[/C][C]3[/C][/ROW]
[ROW][C]F-TEST (DF denominator)[/C][C]57[/C][/ROW]
[ROW][C]p-value[/C][C]2.37367903110908e-11[/C][/ROW]
[ROW][C]Multiple Linear Regression - Residual Statistics[/C][/ROW]
[ROW][C]Residual Standard Deviation[/C][C]27599.8633201017[/C][/ROW]
[ROW][C]Sum Squared Residuals[/C][C]43419889951.4327[/C][/ROW]
[/TABLE]
Source: https://freestatistics.org/blog/index.php?pk=67109&T=3

Globally Unique Identifier (entire table): ba.freestatistics.org/blog/index.php?pk=67109&T=3

As an alternative you can also use a QR Code:  

The GUIDs for individual cells are displayed in the table below:

Multiple Linear Regression - Regression Statistics
Multiple R0.77380861565493
R-squared0.598779773661799
Adjusted R-squared0.577662919643999
F-TEST (value)28.3555388107086
F-TEST (DF numerator)3
F-TEST (DF denominator)57
p-value2.37367903110908e-11
Multiple Linear Regression - Residual Statistics
Residual Standard Deviation27599.8633201017
Sum Squared Residuals43419889951.4327


Multiple Linear Regression - Actuals, Interpolation, and Residuals
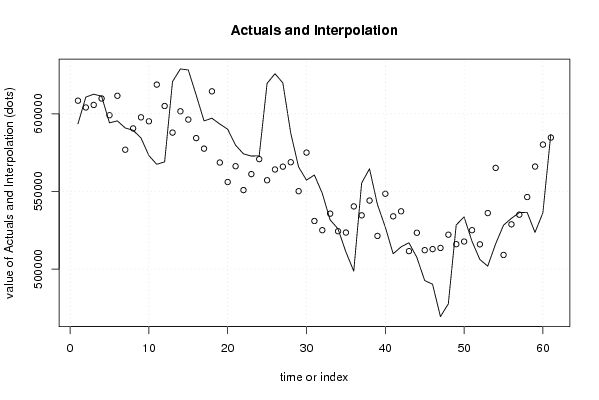
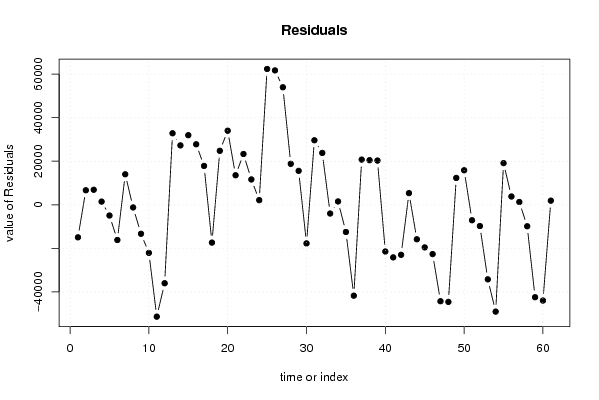
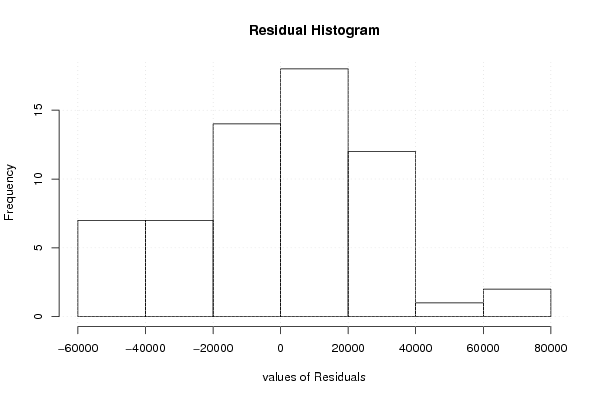
Time or IndexActualsInterpolationForecastResidualsPrediction Error
1593530608453.680860078-14923.6808600785
2610763604090.7015757956672.29842420542
3612613605705.5743642796907.42563572088
4611324609850.4222930281473.57770697200
5594167599085.449682279-4918.44968227912
6595454611605.219468407-16151.2194684070
7590865576863.60035684314001.3996431568
8589379590586.144975476-1207.14497547625
9584428597730.201966581-13302.2019665813
10573100595166.150047963-22066.1500479635
11567456618788.279880269-51332.2798802691
12569028605029.144212899-36001.1442128991
13620735587909.72913267432825.2708673256
14628884601614.53512148227269.4648785176
15628232596283.07387918131948.9261208187
16612117584335.37657612827781.6234238722
17595404577560.70638086617843.2936191344
18597141614479.11842571-17338.1184257097
19593408568624.01787474224783.982125258
20590072556068.51020775734003.4897922427
21579799566243.10366905913555.8963309408
22574205550874.22319673523330.7768032654
23572775561144.69349273711630.3065072630
24572942570805.8785171182136.12148288225
25619567557209.94550187562357.0544981248
26625809564129.65803640961679.3419635911
27619916565963.93192861353952.0680713865
28587625568809.03497246218815.9650275383
29565742550159.31934472515582.6806552752
30557274574995.113842583-17721.1138425829
31560576530963.41850243329612.5814975668
32548854525037.4251430923816.5748569103
33531673535676.885733023-4003.88573302257
34525919524371.5845717241547.41542827570
35511038523514.077035629-12476.0770356294
36498662540363.41917636-41701.4191763600
37555362534610.72573233720751.2742676633
38564591544121.59403875920469.4059612410
39541657521346.07574311820310.9242568816
40527070548505.934558052-21435.9345580520
41509846533972.144942107-24126.1449421067
42514258537207.4815129-22949.4815129005
43516922511553.5274088225368.47259117761
44507561523383.077673436-15822.077673436
45492622512178.90420725-19556.9042072498
46490243512862.331064657-22619.3310646572
47469357513605.583749702-44248.5837497025
48477580522136.546567519-44556.5465675194
49528379516043.41392971612335.5860702842
50533590517738.93919284615851.0608071537
51517945525046.688702559-7101.68870255919
52506174515923.505829981-9749.50582998092
53501866536070.913437983-34204.9134379826
54516141565157.678824496-49016.6788244956
55528222509090.85192222819131.1480777723
56532638528822.3839624223815.61603757782
57536322535027.366663871294.63333612943
58536535546386.92267365-9851.92267364996
59523597566021.81575367-42424.8157536696
60536214580161.102562642-43947.1025626422
61586570584671.1393982631898.86060173689

\begin{tabular}{lllllllll}
\hline
Multiple Linear Regression - Actuals, Interpolation, and Residuals \tabularnewline
Time or Index & Actuals & InterpolationForecast & ResidualsPrediction Error \tabularnewline
1 & 593530 & 608453.680860078 & -14923.6808600785 \tabularnewline
2 & 610763 & 604090.701575795 & 6672.29842420542 \tabularnewline
3 & 612613 & 605705.574364279 & 6907.42563572088 \tabularnewline
4 & 611324 & 609850.422293028 & 1473.57770697200 \tabularnewline
5 & 594167 & 599085.449682279 & -4918.44968227912 \tabularnewline
6 & 595454 & 611605.219468407 & -16151.2194684070 \tabularnewline
7 & 590865 & 576863.600356843 & 14001.3996431568 \tabularnewline
8 & 589379 & 590586.144975476 & -1207.14497547625 \tabularnewline
9 & 584428 & 597730.201966581 & -13302.2019665813 \tabularnewline
10 & 573100 & 595166.150047963 & -22066.1500479635 \tabularnewline
11 & 567456 & 618788.279880269 & -51332.2798802691 \tabularnewline
12 & 569028 & 605029.144212899 & -36001.1442128991 \tabularnewline
13 & 620735 & 587909.729132674 & 32825.2708673256 \tabularnewline
14 & 628884 & 601614.535121482 & 27269.4648785176 \tabularnewline
15 & 628232 & 596283.073879181 & 31948.9261208187 \tabularnewline
16 & 612117 & 584335.376576128 & 27781.6234238722 \tabularnewline
17 & 595404 & 577560.706380866 & 17843.2936191344 \tabularnewline
18 & 597141 & 614479.11842571 & -17338.1184257097 \tabularnewline
19 & 593408 & 568624.017874742 & 24783.982125258 \tabularnewline
20 & 590072 & 556068.510207757 & 34003.4897922427 \tabularnewline
21 & 579799 & 566243.103669059 & 13555.8963309408 \tabularnewline
22 & 574205 & 550874.223196735 & 23330.7768032654 \tabularnewline
23 & 572775 & 561144.693492737 & 11630.3065072630 \tabularnewline
24 & 572942 & 570805.878517118 & 2136.12148288225 \tabularnewline
25 & 619567 & 557209.945501875 & 62357.0544981248 \tabularnewline
26 & 625809 & 564129.658036409 & 61679.3419635911 \tabularnewline
27 & 619916 & 565963.931928613 & 53952.0680713865 \tabularnewline
28 & 587625 & 568809.034972462 & 18815.9650275383 \tabularnewline
29 & 565742 & 550159.319344725 & 15582.6806552752 \tabularnewline
30 & 557274 & 574995.113842583 & -17721.1138425829 \tabularnewline
31 & 560576 & 530963.418502433 & 29612.5814975668 \tabularnewline
32 & 548854 & 525037.42514309 & 23816.5748569103 \tabularnewline
33 & 531673 & 535676.885733023 & -4003.88573302257 \tabularnewline
34 & 525919 & 524371.584571724 & 1547.41542827570 \tabularnewline
35 & 511038 & 523514.077035629 & -12476.0770356294 \tabularnewline
36 & 498662 & 540363.41917636 & -41701.4191763600 \tabularnewline
37 & 555362 & 534610.725732337 & 20751.2742676633 \tabularnewline
38 & 564591 & 544121.594038759 & 20469.4059612410 \tabularnewline
39 & 541657 & 521346.075743118 & 20310.9242568816 \tabularnewline
40 & 527070 & 548505.934558052 & -21435.9345580520 \tabularnewline
41 & 509846 & 533972.144942107 & -24126.1449421067 \tabularnewline
42 & 514258 & 537207.4815129 & -22949.4815129005 \tabularnewline
43 & 516922 & 511553.527408822 & 5368.47259117761 \tabularnewline
44 & 507561 & 523383.077673436 & -15822.077673436 \tabularnewline
45 & 492622 & 512178.90420725 & -19556.9042072498 \tabularnewline
46 & 490243 & 512862.331064657 & -22619.3310646572 \tabularnewline
47 & 469357 & 513605.583749702 & -44248.5837497025 \tabularnewline
48 & 477580 & 522136.546567519 & -44556.5465675194 \tabularnewline
49 & 528379 & 516043.413929716 & 12335.5860702842 \tabularnewline
50 & 533590 & 517738.939192846 & 15851.0608071537 \tabularnewline
51 & 517945 & 525046.688702559 & -7101.68870255919 \tabularnewline
52 & 506174 & 515923.505829981 & -9749.50582998092 \tabularnewline
53 & 501866 & 536070.913437983 & -34204.9134379826 \tabularnewline
54 & 516141 & 565157.678824496 & -49016.6788244956 \tabularnewline
55 & 528222 & 509090.851922228 & 19131.1480777723 \tabularnewline
56 & 532638 & 528822.383962422 & 3815.61603757782 \tabularnewline
57 & 536322 & 535027.36666387 & 1294.63333612943 \tabularnewline
58 & 536535 & 546386.92267365 & -9851.92267364996 \tabularnewline
59 & 523597 & 566021.81575367 & -42424.8157536696 \tabularnewline
60 & 536214 & 580161.102562642 & -43947.1025626422 \tabularnewline
61 & 586570 & 584671.139398263 & 1898.86060173689 \tabularnewline
\hline
\end{tabular}
%Source: https://freestatistics.org/blog/index.php?pk=67109&T=4

[TABLE]
[ROW][C]Multiple Linear Regression - Actuals, Interpolation, and Residuals[/C][/ROW]
[ROW][C]Time or Index[/C][C]Actuals[/C][C]InterpolationForecast[/C][C]ResidualsPrediction Error[/C][/ROW]
[ROW][C]1[/C][C]593530[/C][C]608453.680860078[/C][C]-14923.6808600785[/C][/ROW]
[ROW][C]2[/C][C]610763[/C][C]604090.701575795[/C][C]6672.29842420542[/C][/ROW]
[ROW][C]3[/C][C]612613[/C][C]605705.574364279[/C][C]6907.42563572088[/C][/ROW]
[ROW][C]4[/C][C]611324[/C][C]609850.422293028[/C][C]1473.57770697200[/C][/ROW]
[ROW][C]5[/C][C]594167[/C][C]599085.449682279[/C][C]-4918.44968227912[/C][/ROW]
[ROW][C]6[/C][C]595454[/C][C]611605.219468407[/C][C]-16151.2194684070[/C][/ROW]
[ROW][C]7[/C][C]590865[/C][C]576863.600356843[/C][C]14001.3996431568[/C][/ROW]
[ROW][C]8[/C][C]589379[/C][C]590586.144975476[/C][C]-1207.14497547625[/C][/ROW]
[ROW][C]9[/C][C]584428[/C][C]597730.201966581[/C][C]-13302.2019665813[/C][/ROW]
[ROW][C]10[/C][C]573100[/C][C]595166.150047963[/C][C]-22066.1500479635[/C][/ROW]
[ROW][C]11[/C][C]567456[/C][C]618788.279880269[/C][C]-51332.2798802691[/C][/ROW]
[ROW][C]12[/C][C]569028[/C][C]605029.144212899[/C][C]-36001.1442128991[/C][/ROW]
[ROW][C]13[/C][C]620735[/C][C]587909.729132674[/C][C]32825.2708673256[/C][/ROW]
[ROW][C]14[/C][C]628884[/C][C]601614.535121482[/C][C]27269.4648785176[/C][/ROW]
[ROW][C]15[/C][C]628232[/C][C]596283.073879181[/C][C]31948.9261208187[/C][/ROW]
[ROW][C]16[/C][C]612117[/C][C]584335.376576128[/C][C]27781.6234238722[/C][/ROW]
[ROW][C]17[/C][C]595404[/C][C]577560.706380866[/C][C]17843.2936191344[/C][/ROW]
[ROW][C]18[/C][C]597141[/C][C]614479.11842571[/C][C]-17338.1184257097[/C][/ROW]
[ROW][C]19[/C][C]593408[/C][C]568624.017874742[/C][C]24783.982125258[/C][/ROW]
[ROW][C]20[/C][C]590072[/C][C]556068.510207757[/C][C]34003.4897922427[/C][/ROW]
[ROW][C]21[/C][C]579799[/C][C]566243.103669059[/C][C]13555.8963309408[/C][/ROW]
[ROW][C]22[/C][C]574205[/C][C]550874.223196735[/C][C]23330.7768032654[/C][/ROW]
[ROW][C]23[/C][C]572775[/C][C]561144.693492737[/C][C]11630.3065072630[/C][/ROW]
[ROW][C]24[/C][C]572942[/C][C]570805.878517118[/C][C]2136.12148288225[/C][/ROW]
[ROW][C]25[/C][C]619567[/C][C]557209.945501875[/C][C]62357.0544981248[/C][/ROW]
[ROW][C]26[/C][C]625809[/C][C]564129.658036409[/C][C]61679.3419635911[/C][/ROW]
[ROW][C]27[/C][C]619916[/C][C]565963.931928613[/C][C]53952.0680713865[/C][/ROW]
[ROW][C]28[/C][C]587625[/C][C]568809.034972462[/C][C]18815.9650275383[/C][/ROW]
[ROW][C]29[/C][C]565742[/C][C]550159.319344725[/C][C]15582.6806552752[/C][/ROW]
[ROW][C]30[/C][C]557274[/C][C]574995.113842583[/C][C]-17721.1138425829[/C][/ROW]
[ROW][C]31[/C][C]560576[/C][C]530963.418502433[/C][C]29612.5814975668[/C][/ROW]
[ROW][C]32[/C][C]548854[/C][C]525037.42514309[/C][C]23816.5748569103[/C][/ROW]
[ROW][C]33[/C][C]531673[/C][C]535676.885733023[/C][C]-4003.88573302257[/C][/ROW]
[ROW][C]34[/C][C]525919[/C][C]524371.584571724[/C][C]1547.41542827570[/C][/ROW]
[ROW][C]35[/C][C]511038[/C][C]523514.077035629[/C][C]-12476.0770356294[/C][/ROW]
[ROW][C]36[/C][C]498662[/C][C]540363.41917636[/C][C]-41701.4191763600[/C][/ROW]
[ROW][C]37[/C][C]555362[/C][C]534610.725732337[/C][C]20751.2742676633[/C][/ROW]
[ROW][C]38[/C][C]564591[/C][C]544121.594038759[/C][C]20469.4059612410[/C][/ROW]
[ROW][C]39[/C][C]541657[/C][C]521346.075743118[/C][C]20310.9242568816[/C][/ROW]
[ROW][C]40[/C][C]527070[/C][C]548505.934558052[/C][C]-21435.9345580520[/C][/ROW]
[ROW][C]41[/C][C]509846[/C][C]533972.144942107[/C][C]-24126.1449421067[/C][/ROW]
[ROW][C]42[/C][C]514258[/C][C]537207.4815129[/C][C]-22949.4815129005[/C][/ROW]
[ROW][C]43[/C][C]516922[/C][C]511553.527408822[/C][C]5368.47259117761[/C][/ROW]
[ROW][C]44[/C][C]507561[/C][C]523383.077673436[/C][C]-15822.077673436[/C][/ROW]
[ROW][C]45[/C][C]492622[/C][C]512178.90420725[/C][C]-19556.9042072498[/C][/ROW]
[ROW][C]46[/C][C]490243[/C][C]512862.331064657[/C][C]-22619.3310646572[/C][/ROW]
[ROW][C]47[/C][C]469357[/C][C]513605.583749702[/C][C]-44248.5837497025[/C][/ROW]
[ROW][C]48[/C][C]477580[/C][C]522136.546567519[/C][C]-44556.5465675194[/C][/ROW]
[ROW][C]49[/C][C]528379[/C][C]516043.413929716[/C][C]12335.5860702842[/C][/ROW]
[ROW][C]50[/C][C]533590[/C][C]517738.939192846[/C][C]15851.0608071537[/C][/ROW]
[ROW][C]51[/C][C]517945[/C][C]525046.688702559[/C][C]-7101.68870255919[/C][/ROW]
[ROW][C]52[/C][C]506174[/C][C]515923.505829981[/C][C]-9749.50582998092[/C][/ROW]
[ROW][C]53[/C][C]501866[/C][C]536070.913437983[/C][C]-34204.9134379826[/C][/ROW]
[ROW][C]54[/C][C]516141[/C][C]565157.678824496[/C][C]-49016.6788244956[/C][/ROW]
[ROW][C]55[/C][C]528222[/C][C]509090.851922228[/C][C]19131.1480777723[/C][/ROW]
[ROW][C]56[/C][C]532638[/C][C]528822.383962422[/C][C]3815.61603757782[/C][/ROW]
[ROW][C]57[/C][C]536322[/C][C]535027.36666387[/C][C]1294.63333612943[/C][/ROW]
[ROW][C]58[/C][C]536535[/C][C]546386.92267365[/C][C]-9851.92267364996[/C][/ROW]
[ROW][C]59[/C][C]523597[/C][C]566021.81575367[/C][C]-42424.8157536696[/C][/ROW]
[ROW][C]60[/C][C]536214[/C][C]580161.102562642[/C][C]-43947.1025626422[/C][/ROW]
[ROW][C]61[/C][C]586570[/C][C]584671.139398263[/C][C]1898.86060173689[/C][/ROW]
[/TABLE]
Source: https://freestatistics.org/blog/index.php?pk=67109&T=4

Globally Unique Identifier (entire table): ba.freestatistics.org/blog/index.php?pk=67109&T=4

As an alternative you can also use a QR Code:  

The GUIDs for individual cells are displayed in the table below:

Multiple Linear Regression - Actuals, Interpolation, and Residuals
Time or IndexActualsInterpolationForecastResidualsPrediction Error
1593530608453.680860078-14923.6808600785
2610763604090.7015757956672.29842420542
3612613605705.5743642796907.42563572088
4611324609850.4222930281473.57770697200
5594167599085.449682279-4918.44968227912
6595454611605.219468407-16151.2194684070
7590865576863.60035684314001.3996431568
8589379590586.144975476-1207.14497547625
9584428597730.201966581-13302.2019665813
10573100595166.150047963-22066.1500479635
11567456618788.279880269-51332.2798802691
12569028605029.144212899-36001.1442128991
13620735587909.72913267432825.2708673256
14628884601614.53512148227269.4648785176
15628232596283.07387918131948.9261208187
16612117584335.37657612827781.6234238722
17595404577560.70638086617843.2936191344
18597141614479.11842571-17338.1184257097
19593408568624.01787474224783.982125258
20590072556068.51020775734003.4897922427
21579799566243.10366905913555.8963309408
22574205550874.22319673523330.7768032654
23572775561144.69349273711630.3065072630
24572942570805.8785171182136.12148288225
25619567557209.94550187562357.0544981248
26625809564129.65803640961679.3419635911
27619916565963.93192861353952.0680713865
28587625568809.03497246218815.9650275383
29565742550159.31934472515582.6806552752
30557274574995.113842583-17721.1138425829
31560576530963.41850243329612.5814975668
32548854525037.4251430923816.5748569103
33531673535676.885733023-4003.88573302257
34525919524371.5845717241547.41542827570
35511038523514.077035629-12476.0770356294
36498662540363.41917636-41701.4191763600
37555362534610.72573233720751.2742676633
38564591544121.59403875920469.4059612410
39541657521346.07574311820310.9242568816
40527070548505.934558052-21435.9345580520
41509846533972.144942107-24126.1449421067
42514258537207.4815129-22949.4815129005
43516922511553.5274088225368.47259117761
44507561523383.077673436-15822.077673436
45492622512178.90420725-19556.9042072498
46490243512862.331064657-22619.3310646572
47469357513605.583749702-44248.5837497025
48477580522136.546567519-44556.5465675194
49528379516043.41392971612335.5860702842
50533590517738.93919284615851.0608071537
51517945525046.688702559-7101.68870255919
52506174515923.505829981-9749.50582998092
53501866536070.913437983-34204.9134379826
54516141565157.678824496-49016.6788244956
55528222509090.85192222819131.1480777723
56532638528822.3839624223815.61603757782
57536322535027.366663871294.63333612943
58536535546386.92267365-9851.92267364996
59523597566021.81575367-42424.8157536696
60536214580161.102562642-43947.1025626422
61586570584671.1393982631898.86060173689


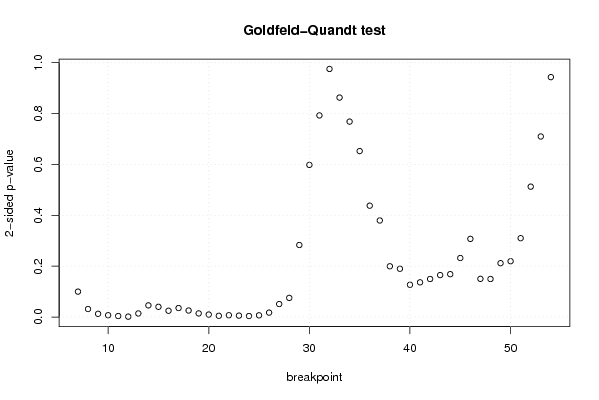
Goldfeld-Quandt test for Heteroskedasticity
p-valuesAlternative Hypothesis
breakpoint indexgreater2-sidedless
70.0499639626641050.099927925328210.950036037335895
80.01576543470244230.03153086940488460.984234565297558
90.006365411340669130.01273082268133830.99363458865933
100.003585680812200470.007171361624400950.9964143191878
110.001983435045315640.003966870090631280.998016564954684
120.0007789304598258180.001557860919651640.999221069540174
130.007054144416577540.01410828883315510.992945855583423
140.02295334308161590.04590668616323190.977046656918384
150.02012575543919020.04025151087838050.97987424456081
160.01237881611263730.02475763222527450.987621183887363
170.01768335115038840.03536670230077690.982316648849612
180.01282428903730030.02564857807460060.9871757109627
190.007146094188366770.01429218837673350.992853905811633
200.004909423832629730.009818847665259460.99509057616737
210.002451964431349360.004903928862698720.99754803556865
220.003563870157806110.007127740315612210.996436129842194
230.002809145315955920.005618290631911840.997190854684044
240.002021904345301570.004043808690603140.997978095654698
250.003389680375178730.006779360750357450.996610319624821
260.008696735319137850.01739347063827570.991303264680862
270.02556406508099960.05112813016199930.974435934919
280.03765530904157260.07531061808314530.962344690958427
290.1415942287339790.2831884574679570.858405771266021
300.2990754062921770.5981508125843540.700924593707823
310.3963401297825310.7926802595650630.603659870217469
320.4877317942780490.9754635885560990.512268205721951
330.5685241372063470.8629517255873050.431475862793653
340.6157873415887370.7684253168225260.384212658411263
350.6737230713700620.6525538572598760.326276928629938
360.7810802332512510.4378395334974970.218919766748749
370.81014358763760.3797128247248010.189856412362400
380.9001812241106830.1996375517786340.0998187758893171
390.9050888582945060.1898222834109880.094911141705494
400.9365847055541510.1268305888916980.063415294445849
410.9317517197035660.1364965605928670.0682482802964337
420.9251967674136780.1496064651726450.0748032325863225
430.9175288341888870.1649423316222260.0824711658111132
440.9156998316919030.1686003366161940.0843001683080968
450.8839539159187020.2320921681625960.116046084081298
460.8463391837813760.3073216324372490.153660816218624
470.924877981407860.1502440371842800.0751220185921399
480.9251837042623440.1496325914753120.074816295737656
490.8941103586516630.2117792826966730.105889641348337
500.8902493495074630.2195013009850740.109750650492537
510.8449707628301940.3100584743396130.155029237169806
520.7436805413544530.5126389172910940.256319458645547
530.645049539452640.7099009210947210.354950460547361
540.528350482185530.943299035628940.47164951781447

\begin{tabular}{lllllllll}
\hline
Goldfeld-Quandt test for Heteroskedasticity \tabularnewline
p-values & Alternative Hypothesis \tabularnewline
breakpoint index & greater & 2-sided & less \tabularnewline
7 & 0.049963962664105 & 0.09992792532821 & 0.950036037335895 \tabularnewline
8 & 0.0157654347024423 & 0.0315308694048846 & 0.984234565297558 \tabularnewline
9 & 0.00636541134066913 & 0.0127308226813383 & 0.99363458865933 \tabularnewline
10 & 0.00358568081220047 & 0.00717136162440095 & 0.9964143191878 \tabularnewline
11 & 0.00198343504531564 & 0.00396687009063128 & 0.998016564954684 \tabularnewline
12 & 0.000778930459825818 & 0.00155786091965164 & 0.999221069540174 \tabularnewline
13 & 0.00705414441657754 & 0.0141082888331551 & 0.992945855583423 \tabularnewline
14 & 0.0229533430816159 & 0.0459066861632319 & 0.977046656918384 \tabularnewline
15 & 0.0201257554391902 & 0.0402515108783805 & 0.97987424456081 \tabularnewline
16 & 0.0123788161126373 & 0.0247576322252745 & 0.987621183887363 \tabularnewline
17 & 0.0176833511503884 & 0.0353667023007769 & 0.982316648849612 \tabularnewline
18 & 0.0128242890373003 & 0.0256485780746006 & 0.9871757109627 \tabularnewline
19 & 0.00714609418836677 & 0.0142921883767335 & 0.992853905811633 \tabularnewline
20 & 0.00490942383262973 & 0.00981884766525946 & 0.99509057616737 \tabularnewline
21 & 0.00245196443134936 & 0.00490392886269872 & 0.99754803556865 \tabularnewline
22 & 0.00356387015780611 & 0.00712774031561221 & 0.996436129842194 \tabularnewline
23 & 0.00280914531595592 & 0.00561829063191184 & 0.997190854684044 \tabularnewline
24 & 0.00202190434530157 & 0.00404380869060314 & 0.997978095654698 \tabularnewline
25 & 0.00338968037517873 & 0.00677936075035745 & 0.996610319624821 \tabularnewline
26 & 0.00869673531913785 & 0.0173934706382757 & 0.991303264680862 \tabularnewline
27 & 0.0255640650809996 & 0.0511281301619993 & 0.974435934919 \tabularnewline
28 & 0.0376553090415726 & 0.0753106180831453 & 0.962344690958427 \tabularnewline
29 & 0.141594228733979 & 0.283188457467957 & 0.858405771266021 \tabularnewline
30 & 0.299075406292177 & 0.598150812584354 & 0.700924593707823 \tabularnewline
31 & 0.396340129782531 & 0.792680259565063 & 0.603659870217469 \tabularnewline
32 & 0.487731794278049 & 0.975463588556099 & 0.512268205721951 \tabularnewline
33 & 0.568524137206347 & 0.862951725587305 & 0.431475862793653 \tabularnewline
34 & 0.615787341588737 & 0.768425316822526 & 0.384212658411263 \tabularnewline
35 & 0.673723071370062 & 0.652553857259876 & 0.326276928629938 \tabularnewline
36 & 0.781080233251251 & 0.437839533497497 & 0.218919766748749 \tabularnewline
37 & 0.8101435876376 & 0.379712824724801 & 0.189856412362400 \tabularnewline
38 & 0.900181224110683 & 0.199637551778634 & 0.0998187758893171 \tabularnewline
39 & 0.905088858294506 & 0.189822283410988 & 0.094911141705494 \tabularnewline
40 & 0.936584705554151 & 0.126830588891698 & 0.063415294445849 \tabularnewline
41 & 0.931751719703566 & 0.136496560592867 & 0.0682482802964337 \tabularnewline
42 & 0.925196767413678 & 0.149606465172645 & 0.0748032325863225 \tabularnewline
43 & 0.917528834188887 & 0.164942331622226 & 0.0824711658111132 \tabularnewline
44 & 0.915699831691903 & 0.168600336616194 & 0.0843001683080968 \tabularnewline
45 & 0.883953915918702 & 0.232092168162596 & 0.116046084081298 \tabularnewline
46 & 0.846339183781376 & 0.307321632437249 & 0.153660816218624 \tabularnewline
47 & 0.92487798140786 & 0.150244037184280 & 0.0751220185921399 \tabularnewline
48 & 0.925183704262344 & 0.149632591475312 & 0.074816295737656 \tabularnewline
49 & 0.894110358651663 & 0.211779282696673 & 0.105889641348337 \tabularnewline
50 & 0.890249349507463 & 0.219501300985074 & 0.109750650492537 \tabularnewline
51 & 0.844970762830194 & 0.310058474339613 & 0.155029237169806 \tabularnewline
52 & 0.743680541354453 & 0.512638917291094 & 0.256319458645547 \tabularnewline
53 & 0.64504953945264 & 0.709900921094721 & 0.354950460547361 \tabularnewline
54 & 0.52835048218553 & 0.94329903562894 & 0.47164951781447 \tabularnewline
\hline
\end{tabular}
%Source: https://freestatistics.org/blog/index.php?pk=67109&T=5

[TABLE]
[ROW][C]Goldfeld-Quandt test for Heteroskedasticity[/C][/ROW]
[ROW][C]p-values[/C][C]Alternative Hypothesis[/C][/ROW]
[ROW][C]breakpoint index[/C][C]greater[/C][C]2-sided[/C][C]less[/C][/ROW]
[ROW][C]7[/C][C]0.049963962664105[/C][C]0.09992792532821[/C][C]0.950036037335895[/C][/ROW]
[ROW][C]8[/C][C]0.0157654347024423[/C][C]0.0315308694048846[/C][C]0.984234565297558[/C][/ROW]
[ROW][C]9[/C][C]0.00636541134066913[/C][C]0.0127308226813383[/C][C]0.99363458865933[/C][/ROW]
[ROW][C]10[/C][C]0.00358568081220047[/C][C]0.00717136162440095[/C][C]0.9964143191878[/C][/ROW]
[ROW][C]11[/C][C]0.00198343504531564[/C][C]0.00396687009063128[/C][C]0.998016564954684[/C][/ROW]
[ROW][C]12[/C][C]0.000778930459825818[/C][C]0.00155786091965164[/C][C]0.999221069540174[/C][/ROW]
[ROW][C]13[/C][C]0.00705414441657754[/C][C]0.0141082888331551[/C][C]0.992945855583423[/C][/ROW]
[ROW][C]14[/C][C]0.0229533430816159[/C][C]0.0459066861632319[/C][C]0.977046656918384[/C][/ROW]
[ROW][C]15[/C][C]0.0201257554391902[/C][C]0.0402515108783805[/C][C]0.97987424456081[/C][/ROW]
[ROW][C]16[/C][C]0.0123788161126373[/C][C]0.0247576322252745[/C][C]0.987621183887363[/C][/ROW]
[ROW][C]17[/C][C]0.0176833511503884[/C][C]0.0353667023007769[/C][C]0.982316648849612[/C][/ROW]
[ROW][C]18[/C][C]0.0128242890373003[/C][C]0.0256485780746006[/C][C]0.9871757109627[/C][/ROW]
[ROW][C]19[/C][C]0.00714609418836677[/C][C]0.0142921883767335[/C][C]0.992853905811633[/C][/ROW]
[ROW][C]20[/C][C]0.00490942383262973[/C][C]0.00981884766525946[/C][C]0.99509057616737[/C][/ROW]
[ROW][C]21[/C][C]0.00245196443134936[/C][C]0.00490392886269872[/C][C]0.99754803556865[/C][/ROW]
[ROW][C]22[/C][C]0.00356387015780611[/C][C]0.00712774031561221[/C][C]0.996436129842194[/C][/ROW]
[ROW][C]23[/C][C]0.00280914531595592[/C][C]0.00561829063191184[/C][C]0.997190854684044[/C][/ROW]
[ROW][C]24[/C][C]0.00202190434530157[/C][C]0.00404380869060314[/C][C]0.997978095654698[/C][/ROW]
[ROW][C]25[/C][C]0.00338968037517873[/C][C]0.00677936075035745[/C][C]0.996610319624821[/C][/ROW]
[ROW][C]26[/C][C]0.00869673531913785[/C][C]0.0173934706382757[/C][C]0.991303264680862[/C][/ROW]
[ROW][C]27[/C][C]0.0255640650809996[/C][C]0.0511281301619993[/C][C]0.974435934919[/C][/ROW]
[ROW][C]28[/C][C]0.0376553090415726[/C][C]0.0753106180831453[/C][C]0.962344690958427[/C][/ROW]
[ROW][C]29[/C][C]0.141594228733979[/C][C]0.283188457467957[/C][C]0.858405771266021[/C][/ROW]
[ROW][C]30[/C][C]0.299075406292177[/C][C]0.598150812584354[/C][C]0.700924593707823[/C][/ROW]
[ROW][C]31[/C][C]0.396340129782531[/C][C]0.792680259565063[/C][C]0.603659870217469[/C][/ROW]
[ROW][C]32[/C][C]0.487731794278049[/C][C]0.975463588556099[/C][C]0.512268205721951[/C][/ROW]
[ROW][C]33[/C][C]0.568524137206347[/C][C]0.862951725587305[/C][C]0.431475862793653[/C][/ROW]
[ROW][C]34[/C][C]0.615787341588737[/C][C]0.768425316822526[/C][C]0.384212658411263[/C][/ROW]
[ROW][C]35[/C][C]0.673723071370062[/C][C]0.652553857259876[/C][C]0.326276928629938[/C][/ROW]
[ROW][C]36[/C][C]0.781080233251251[/C][C]0.437839533497497[/C][C]0.218919766748749[/C][/ROW]
[ROW][C]37[/C][C]0.8101435876376[/C][C]0.379712824724801[/C][C]0.189856412362400[/C][/ROW]
[ROW][C]38[/C][C]0.900181224110683[/C][C]0.199637551778634[/C][C]0.0998187758893171[/C][/ROW]
[ROW][C]39[/C][C]0.905088858294506[/C][C]0.189822283410988[/C][C]0.094911141705494[/C][/ROW]
[ROW][C]40[/C][C]0.936584705554151[/C][C]0.126830588891698[/C][C]0.063415294445849[/C][/ROW]
[ROW][C]41[/C][C]0.931751719703566[/C][C]0.136496560592867[/C][C]0.0682482802964337[/C][/ROW]
[ROW][C]42[/C][C]0.925196767413678[/C][C]0.149606465172645[/C][C]0.0748032325863225[/C][/ROW]
[ROW][C]43[/C][C]0.917528834188887[/C][C]0.164942331622226[/C][C]0.0824711658111132[/C][/ROW]
[ROW][C]44[/C][C]0.915699831691903[/C][C]0.168600336616194[/C][C]0.0843001683080968[/C][/ROW]
[ROW][C]45[/C][C]0.883953915918702[/C][C]0.232092168162596[/C][C]0.116046084081298[/C][/ROW]
[ROW][C]46[/C][C]0.846339183781376[/C][C]0.307321632437249[/C][C]0.153660816218624[/C][/ROW]
[ROW][C]47[/C][C]0.92487798140786[/C][C]0.150244037184280[/C][C]0.0751220185921399[/C][/ROW]
[ROW][C]48[/C][C]0.925183704262344[/C][C]0.149632591475312[/C][C]0.074816295737656[/C][/ROW]
[ROW][C]49[/C][C]0.894110358651663[/C][C]0.211779282696673[/C][C]0.105889641348337[/C][/ROW]
[ROW][C]50[/C][C]0.890249349507463[/C][C]0.219501300985074[/C][C]0.109750650492537[/C][/ROW]
[ROW][C]51[/C][C]0.844970762830194[/C][C]0.310058474339613[/C][C]0.155029237169806[/C][/ROW]
[ROW][C]52[/C][C]0.743680541354453[/C][C]0.512638917291094[/C][C]0.256319458645547[/C][/ROW]
[ROW][C]53[/C][C]0.64504953945264[/C][C]0.709900921094721[/C][C]0.354950460547361[/C][/ROW]
[ROW][C]54[/C][C]0.52835048218553[/C][C]0.94329903562894[/C][C]0.47164951781447[/C][/ROW]
[/TABLE]
Source: https://freestatistics.org/blog/index.php?pk=67109&T=5

Globally Unique Identifier (entire table): ba.freestatistics.org/blog/index.php?pk=67109&T=5

As an alternative you can also use a QR Code:  

The GUIDs for individual cells are displayed in the table below:

Goldfeld-Quandt test for Heteroskedasticity
p-valuesAlternative Hypothesis
breakpoint indexgreater2-sidedless
70.0499639626641050.099927925328210.950036037335895
80.01576543470244230.03153086940488460.984234565297558
90.006365411340669130.01273082268133830.99363458865933
100.003585680812200470.007171361624400950.9964143191878
110.001983435045315640.003966870090631280.998016564954684
120.0007789304598258180.001557860919651640.999221069540174
130.007054144416577540.01410828883315510.992945855583423
140.02295334308161590.04590668616323190.977046656918384
150.02012575543919020.04025151087838050.97987424456081
160.01237881611263730.02475763222527450.987621183887363
170.01768335115038840.03536670230077690.982316648849612
180.01282428903730030.02564857807460060.9871757109627
190.007146094188366770.01429218837673350.992853905811633
200.004909423832629730.009818847665259460.99509057616737
210.002451964431349360.004903928862698720.99754803556865
220.003563870157806110.007127740315612210.996436129842194
230.002809145315955920.005618290631911840.997190854684044
240.002021904345301570.004043808690603140.997978095654698
250.003389680375178730.006779360750357450.996610319624821
260.008696735319137850.01739347063827570.991303264680862
270.02556406508099960.05112813016199930.974435934919
280.03765530904157260.07531061808314530.962344690958427
290.1415942287339790.2831884574679570.858405771266021
300.2990754062921770.5981508125843540.700924593707823
310.3963401297825310.7926802595650630.603659870217469
320.4877317942780490.9754635885560990.512268205721951
330.5685241372063470.8629517255873050.431475862793653
340.6157873415887370.7684253168225260.384212658411263
350.6737230713700620.6525538572598760.326276928629938
360.7810802332512510.4378395334974970.218919766748749
370.81014358763760.3797128247248010.189856412362400
380.9001812241106830.1996375517786340.0998187758893171
390.9050888582945060.1898222834109880.094911141705494
400.9365847055541510.1268305888916980.063415294445849
410.9317517197035660.1364965605928670.0682482802964337
420.9251967674136780.1496064651726450.0748032325863225
430.9175288341888870.1649423316222260.0824711658111132
440.9156998316919030.1686003366161940.0843001683080968
450.8839539159187020.2320921681625960.116046084081298
460.8463391837813760.3073216324372490.153660816218624
470.924877981407860.1502440371842800.0751220185921399
480.9251837042623440.1496325914753120.074816295737656
490.8941103586516630.2117792826966730.105889641348337
500.8902493495074630.2195013009850740.109750650492537
510.8449707628301940.3100584743396130.155029237169806
520.7436805413544530.5126389172910940.256319458645547
530.645049539452640.7099009210947210.354950460547361
540.528350482185530.943299035628940.47164951781447


Meta Analysis of Goldfeld-Quandt test for Heteroskedasticity
Description# significant tests% significant testsOK/NOK
1% type I error level90.1875NOK
5% type I error level190.395833333333333NOK
10% type I error level220.458333333333333NOK

\begin{tabular}{lllllllll}
\hline
Meta Analysis of Goldfeld-Quandt test for Heteroskedasticity \tabularnewline
Description & # significant tests & % significant tests & OK/NOK \tabularnewline
1% type I error level & 9 & 0.1875 & NOK \tabularnewline
5% type I error level & 19 & 0.395833333333333 & NOK \tabularnewline
10% type I error level & 22 & 0.458333333333333 & NOK \tabularnewline
\hline
\end{tabular}
%Source: https://freestatistics.org/blog/index.php?pk=67109&T=6

[TABLE]
[ROW][C]Meta Analysis of Goldfeld-Quandt test for Heteroskedasticity[/C][/ROW]
[ROW][C]Description[/C][C]# significant tests[/C][C]% significant tests[/C][C]OK/NOK[/C][/ROW]
[ROW][C]1% type I error level[/C][C]9[/C][C]0.1875[/C][C]NOK[/C][/ROW]
[ROW][C]5% type I error level[/C][C]19[/C][C]0.395833333333333[/C][C]NOK[/C][/ROW]
[ROW][C]10% type I error level[/C][C]22[/C][C]0.458333333333333[/C][C]NOK[/C][/ROW]
[/TABLE]
Source: https://freestatistics.org/blog/index.php?pk=67109&T=6

Globally Unique Identifier (entire table): ba.freestatistics.org/blog/index.php?pk=67109&T=6

As an alternative you can also use a QR Code:  

The GUIDs for individual cells are displayed in the table below:

Meta Analysis of Goldfeld-Quandt test for Heteroskedasticity
Description# significant tests% significant testsOK/NOK
1% type I error level90.1875NOK
5% type I error level190.395833333333333NOK
10% type I error level220.458333333333333NOK


Parameters (Session):
par1 = 1 ; par2 = Do not include Seasonal Dummies ; par3 = No Linear Trend ;
Parameters (R input):
par1 = 1 ; par2 = Do not include Seasonal Dummies ; par3 = No Linear Trend ;
R code (references can be found in the software module):
library(lattice)
library(lmtest)
n25 <- 25 #minimum number of obs. for Goldfeld-Quandt test
par1 <- as.numeric(par1)
x <- t(y)
k <- length(x[1,])
n <- length(x[,1])
x1 <- cbind(x[,par1], x[,1:k!=par1])
mycolnames <- c(colnames(x)[par1], colnames(x)[1:k!=par1])
colnames(x1) <- mycolnames #colnames(x)[par1]
x <- x1
if (par3 == 'First Differences'){
x2 <- array(0, dim=c(n-1,k), dimnames=list(1:(n-1), paste('(1-B)',colnames(x),sep='')))
for (i in 1:n-1) {
for (j in 1:k) {
x2[i,j] <- x[i+1,j] - x[i,j]
}
}
x <- x2
}
if (par2 == 'Include Monthly Dummies'){
x2 <- array(0, dim=c(n,11), dimnames=list(1:n, paste('M', seq(1:11), sep ='')))
for (i in 1:11){
x2[seq(i,n,12),i] <- 1
}
x <- cbind(x, x2)
}
if (par2 == 'Include Quarterly Dummies'){
x2 <- array(0, dim=c(n,3), dimnames=list(1:n, paste('Q', seq(1:3), sep ='')))
for (i in 1:3){
x2[seq(i,n,4),i] <- 1
}
x <- cbind(x, x2)
}
k <- length(x[1,])
if (par3 == 'Linear Trend'){
x <- cbind(x, c(1:n))
colnames(x)[k+1] <- 't'
}
x
k <- length(x[1,])
df <- as.data.frame(x)
(mylm <- lm(df))
(mysum <- summary(mylm))
if (n > n25) {
kp3 <- k + 3
nmkm3 <- n - k - 3
gqarr <- array(NA, dim=c(nmkm3-kp3+1,3))
numgqtests <- 0
numsignificant1 <- 0
numsignificant5 <- 0
numsignificant10 <- 0
for (mypoint in kp3:nmkm3) {
j <- 0
numgqtests <- numgqtests + 1
for (myalt in c('greater', 'two.sided', 'less')) {
j <- j + 1
gqarr[mypoint-kp3+1,j] <- gqtest(mylm, point=mypoint, alternative=myalt)$p.value
}
if (gqarr[mypoint-kp3+1,2] < 0.01) numsignificant1 <- numsignificant1 + 1
if (gqarr[mypoint-kp3+1,2] < 0.05) numsignificant5 <- numsignificant5 + 1
if (gqarr[mypoint-kp3+1,2] < 0.10) numsignificant10 <- numsignificant10 + 1
}
gqarr
}
bitmap(file='test0.png')
plot(x[,1], type='l', main='Actuals and Interpolation', ylab='value of Actuals and Interpolation (dots)', xlab='time or index')
points(x[,1]-mysum$resid)
grid()
dev.off()
bitmap(file='test1.png')
plot(mysum$resid, type='b', pch=19, main='Residuals', ylab='value of Residuals', xlab='time or index')
grid()
dev.off()
bitmap(file='test2.png')
hist(mysum$resid, main='Residual Histogram', xlab='values of Residuals')
grid()
dev.off()
bitmap(file='test3.png')
densityplot(~mysum$resid,col='black',main='Residual Density Plot', xlab='values of Residuals')
dev.off()
bitmap(file='test4.png')
qqnorm(mysum$resid, main='Residual Normal Q-Q Plot')
qqline(mysum$resid)
grid()
dev.off()
(myerror <- as.ts(mysum$resid))
bitmap(file='test5.png')
dum <- cbind(lag(myerror,k=1),myerror)
dum
dum1 <- dum[2:length(myerror),]
dum1
z <- as.data.frame(dum1)
z
plot(z,main=paste('Residual Lag plot, lowess, and regression line'), ylab='values of Residuals', xlab='lagged values of Residuals')
lines(lowess(z))
abline(lm(z))
grid()
dev.off()
bitmap(file='test6.png')
acf(mysum$resid, lag.max=length(mysum$resid)/2, main='Residual Autocorrelation Function')
grid()
dev.off()
bitmap(file='test7.png')
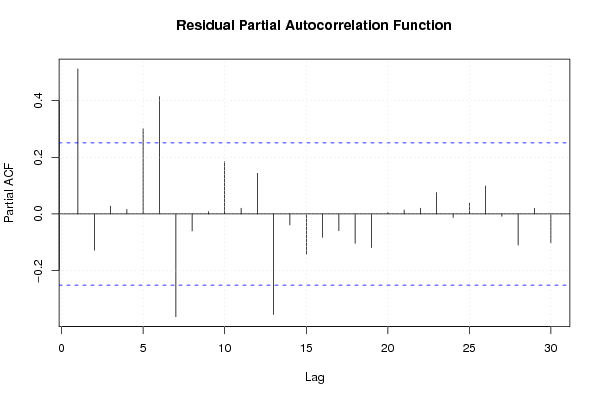
pacf(mysum$resid, lag.max=length(mysum$resid)/2, main='Residual Partial Autocorrelation Function')
grid()
dev.off()
bitmap(file='test8.png')
opar <- par(mfrow = c(2,2), oma = c(0, 0, 1.1, 0))
plot(mylm, las = 1, sub='Residual Diagnostics')
par(opar)
dev.off()
if (n > n25) {
bitmap(file='test9.png')
plot(kp3:nmkm3,gqarr[,2], main='Goldfeld-Quandt test',ylab='2-sided p-value',xlab='breakpoint')
grid()
dev.off()
}
load(file='createtable')
a<-table.start()
a<-table.row.start(a)
a<-table.element(a, 'Multiple Linear Regression - Estimated Regression Equation', 1, TRUE)
a<-table.row.end(a)
myeq <- colnames(x)[1]
myeq <- paste(myeq, '[t] = ', sep='')
for (i in 1:k){
if (mysum$coefficients[i,1] > 0) myeq <- paste(myeq, '+', '')
myeq <- paste(myeq, mysum$coefficients[i,1], sep=' ')
if (rownames(mysum$coefficients)[i] != '(Intercept)') {
myeq <- paste(myeq, rownames(mysum$coefficients)[i], sep='')
if (rownames(mysum$coefficients)[i] != 't') myeq <- paste(myeq, '[t]', sep='')
}
}
myeq <- paste(myeq, ' + e[t]')
a<-table.row.start(a)
a<-table.element(a, myeq)
a<-table.row.end(a)
a<-table.end(a)
table.save(a,file='mytable1.tab')
a<-table.start()
a<-table.row.start(a)
a<-table.element(a,hyperlink('ols1.htm','Multiple Linear Regression - Ordinary Least Squares',''), 6, TRUE)
a<-table.row.end(a)
a<-table.row.start(a)
a<-table.element(a,'Variable',header=TRUE)
a<-table.element(a,'Parameter',header=TRUE)
a<-table.element(a,'S.D.',header=TRUE)
a<-table.element(a,'T-STAT
H0: parameter = 0',header=TRUE)
a<-table.element(a,'2-tail p-value',header=TRUE)
a<-table.element(a,'1-tail p-value',header=TRUE)
a<-table.row.end(a)
for (i in 1:k){
a<-table.row.start(a)
a<-table.element(a,rownames(mysum$coefficients)[i],header=TRUE)
a<-table.element(a,mysum$coefficients[i,1])
a<-table.element(a, round(mysum$coefficients[i,2],6))
a<-table.element(a, round(mysum$coefficients[i,3],4))
a<-table.element(a, round(mysum$coefficients[i,4],6))
a<-table.element(a, round(mysum$coefficients[i,4]/2,6))
a<-table.row.end(a)
}
a<-table.end(a)
table.save(a,file='mytable2.tab')
a<-table.start()
a<-table.row.start(a)
a<-table.element(a, 'Multiple Linear Regression - Regression Statistics', 2, TRUE)
a<-table.row.end(a)
a<-table.row.start(a)
a<-table.element(a, 'Multiple R',1,TRUE)
a<-table.element(a, sqrt(mysum$r.squared))
a<-table.row.end(a)
a<-table.row.start(a)
a<-table.element(a, 'R-squared',1,TRUE)
a<-table.element(a, mysum$r.squared)
a<-table.row.end(a)
a<-table.row.start(a)
a<-table.element(a, 'Adjusted R-squared',1,TRUE)
a<-table.element(a, mysum$adj.r.squared)
a<-table.row.end(a)
a<-table.row.start(a)
a<-table.element(a, 'F-TEST (value)',1,TRUE)
a<-table.element(a, mysum$fstatistic[1])
a<-table.row.end(a)
a<-table.row.start(a)
a<-table.element(a, 'F-TEST (DF numerator)',1,TRUE)
a<-table.element(a, mysum$fstatistic[2])
a<-table.row.end(a)
a<-table.row.start(a)
a<-table.element(a, 'F-TEST (DF denominator)',1,TRUE)
a<-table.element(a, mysum$fstatistic[3])
a<-table.row.end(a)
a<-table.row.start(a)
a<-table.element(a, 'p-value',1,TRUE)
a<-table.element(a, 1-pf(mysum$fstatistic[1],mysum$fstatistic[2],mysum$fstatistic[3]))
a<-table.row.end(a)
a<-table.row.start(a)
a<-table.element(a, 'Multiple Linear Regression - Residual Statistics', 2, TRUE)
a<-table.row.end(a)
a<-table.row.start(a)
a<-table.element(a, 'Residual Standard Deviation',1,TRUE)
a<-table.element(a, mysum$sigma)
a<-table.row.end(a)
a<-table.row.start(a)
a<-table.element(a, 'Sum Squared Residuals',1,TRUE)
a<-table.element(a, sum(myerror*myerror))
a<-table.row.end(a)
a<-table.end(a)
table.save(a,file='mytable3.tab')
a<-table.start()
a<-table.row.start(a)
a<-table.element(a, 'Multiple Linear Regression - Actuals, Interpolation, and Residuals', 4, TRUE)
a<-table.row.end(a)
a<-table.row.start(a)
a<-table.element(a, 'Time or Index', 1, TRUE)
a<-table.element(a, 'Actuals', 1, TRUE)
a<-table.element(a, 'Interpolation
Forecast', 1, TRUE)
a<-table.element(a, 'Residuals
Prediction Error', 1, TRUE)
a<-table.row.end(a)
for (i in 1:n) {
a<-table.row.start(a)
a<-table.element(a,i, 1, TRUE)
a<-table.element(a,x[i])
a<-table.element(a,x[i]-mysum$resid[i])
a<-table.element(a,mysum$resid[i])
a<-table.row.end(a)
}
a<-table.end(a)
table.save(a,file='mytable4.tab')
if (n > n25) {
a<-table.start()
a<-table.row.start(a)
a<-table.element(a,'Goldfeld-Quandt test for Heteroskedasticity',4,TRUE)
a<-table.row.end(a)
a<-table.row.start(a)
a<-table.element(a,'p-values',header=TRUE)
a<-table.element(a,'Alternative Hypothesis',3,header=TRUE)
a<-table.row.end(a)
a<-table.row.start(a)
a<-table.element(a,'breakpoint index',header=TRUE)
a<-table.element(a,'greater',header=TRUE)
a<-table.element(a,'2-sided',header=TRUE)
a<-table.element(a,'less',header=TRUE)
a<-table.row.end(a)
for (mypoint in kp3:nmkm3) {
a<-table.row.start(a)
a<-table.element(a,mypoint,header=TRUE)
a<-table.element(a,gqarr[mypoint-kp3+1,1])
a<-table.element(a,gqarr[mypoint-kp3+1,2])
a<-table.element(a,gqarr[mypoint-kp3+1,3])
a<-table.row.end(a)
}
a<-table.end(a)
table.save(a,file='mytable5.tab')
a<-table.start()
a<-table.row.start(a)
a<-table.element(a,'Meta Analysis of Goldfeld-Quandt test for Heteroskedasticity',4,TRUE)
a<-table.row.end(a)
a<-table.row.start(a)
a<-table.element(a,'Description',header=TRUE)
a<-table.element(a,'# significant tests',header=TRUE)
a<-table.element(a,'% significant tests',header=TRUE)
a<-table.element(a,'OK/NOK',header=TRUE)
a<-table.row.end(a)
a<-table.row.start(a)
a<-table.element(a,'1% type I error level',header=TRUE)
a<-table.element(a,numsignificant1)
a<-table.element(a,numsignificant1/numgqtests)
if (numsignificant1/numgqtests < 0.01) dum <- 'OK' else dum <- 'NOK'
a<-table.element(a,dum)
a<-table.row.end(a)
a<-table.row.start(a)
a<-table.element(a,'5% type I error level',header=TRUE)
a<-table.element(a,numsignificant5)
a<-table.element(a,numsignificant5/numgqtests)
if (numsignificant5/numgqtests < 0.05) dum <- 'OK' else dum <- 'NOK'
a<-table.element(a,dum)
a<-table.row.end(a)
a<-table.row.start(a)
a<-table.element(a,'10% type I error level',header=TRUE)
a<-table.element(a,numsignificant10)
a<-table.element(a,numsignificant10/numgqtests)
if (numsignificant10/numgqtests < 0.1) dum <- 'OK' else dum <- 'NOK'
a<-table.element(a,dum)
a<-table.row.end(a)
a<-table.end(a)
table.save(a,file='mytable6.tab')
}