ws9 techniek 4 forcasting | ||||||||||||||||||||||||||||||||||||||||||||||||||||||||||||||||||||||||||||||||||||||||||||||||||||||||||||||||||||||||||||||||||||||||||||||||||||||||||||||||||||||||||||||||||||||||||||||||||||||||||||||||||||||||||||||||||||||||||||||||||||||||||||||||||||||||||||||||||||||||||||||||||||||||||
| *The author of this computation has been verified* | ||||||||||||||||||||||||||||||||||||||||||||||||||||||||||||||||||||||||||||||||||||||||||||||||||||||||||||||||||||||||||||||||||||||||||||||||||||||||||||||||||||||||||||||||||||||||||||||||||||||||||||||||||||||||||||||||||||||||||||||||||||||||||||||||||||||||||||||||||||||||||||||||||||||||||
| R Software Module: /rwasp_exponentialsmoothing.wasp (opens new window with default values) | ||||||||||||||||||||||||||||||||||||||||||||||||||||||||||||||||||||||||||||||||||||||||||||||||||||||||||||||||||||||||||||||||||||||||||||||||||||||||||||||||||||||||||||||||||||||||||||||||||||||||||||||||||||||||||||||||||||||||||||||||||||||||||||||||||||||||||||||||||||||||||||||||||||||||||
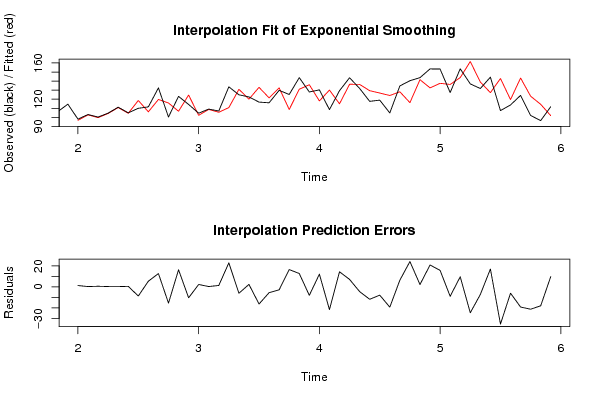
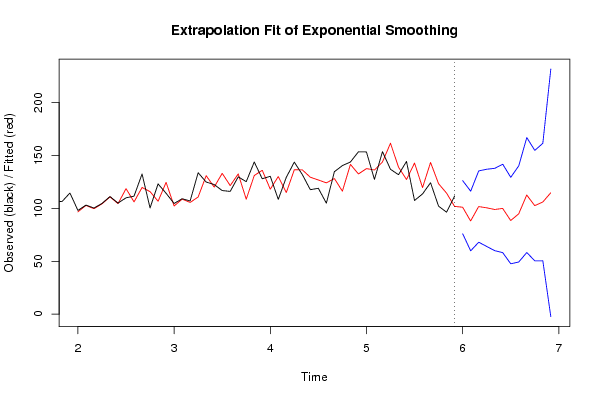
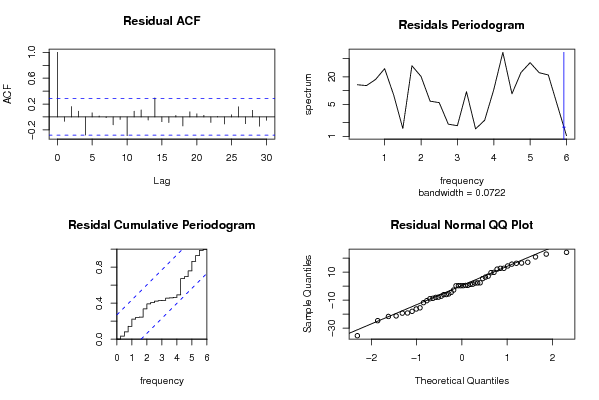
| Title produced by software: Exponential Smoothing | ||||||||||||||||||||||||||||||||||||||||||||||||||||||||||||||||||||||||||||||||||||||||||||||||||||||||||||||||||||||||||||||||||||||||||||||||||||||||||||||||||||||||||||||||||||||||||||||||||||||||||||||||||||||||||||||||||||||||||||||||||||||||||||||||||||||||||||||||||||||||||||||||||||||||||
| Date of computation: Fri, 11 Dec 2009 03:43:22 -0700 | ||||||||||||||||||||||||||||||||||||||||||||||||||||||||||||||||||||||||||||||||||||||||||||||||||||||||||||||||||||||||||||||||||||||||||||||||||||||||||||||||||||||||||||||||||||||||||||||||||||||||||||||||||||||||||||||||||||||||||||||||||||||||||||||||||||||||||||||||||||||||||||||||||||||||||
| Cite this page as follows: | ||||||||||||||||||||||||||||||||||||||||||||||||||||||||||||||||||||||||||||||||||||||||||||||||||||||||||||||||||||||||||||||||||||||||||||||||||||||||||||||||||||||||||||||||||||||||||||||||||||||||||||||||||||||||||||||||||||||||||||||||||||||||||||||||||||||||||||||||||||||||||||||||||||||||||
| Statistical Computations at FreeStatistics.org, Office for Research Development and Education, URL http://www.freestatistics.org/blog/date/2009/Dec/11/t1260528739v1ocfbomc3f8yqu.htm/, Retrieved Fri, 11 Dec 2009 11:52:24 +0100 | ||||||||||||||||||||||||||||||||||||||||||||||||||||||||||||||||||||||||||||||||||||||||||||||||||||||||||||||||||||||||||||||||||||||||||||||||||||||||||||||||||||||||||||||||||||||||||||||||||||||||||||||||||||||||||||||||||||||||||||||||||||||||||||||||||||||||||||||||||||||||||||||||||||||||||
| BibTeX entries for LaTeX users: | ||||||||||||||||||||||||||||||||||||||||||||||||||||||||||||||||||||||||||||||||||||||||||||||||||||||||||||||||||||||||||||||||||||||||||||||||||||||||||||||||||||||||||||||||||||||||||||||||||||||||||||||||||||||||||||||||||||||||||||||||||||||||||||||||||||||||||||||||||||||||||||||||||||||||||
@Manual{KEY,
    author = {{YOUR NAME}},
    publisher = {Office for Research Development and Education},
    title = {Statistical Computations at FreeStatistics.org, URL http://www.freestatistics.org/blog/date/2009/Dec/11/t1260528739v1ocfbomc3f8yqu.htm/},
    year = {2009},
}
@Manual{R,
    title = {R: A Language and Environment for Statistical Computing},
    author = {{R Development Core Team}},
    organization = {R Foundation for Statistical Computing},
    address = {Vienna, Austria},
    year = {2009},
    note = {{ISBN} 3-900051-07-0},
    url = {http://www.R-project.org},
}
| ||||||||||||||||||||||||||||||||||||||||||||||||||||||||||||||||||||||||||||||||||||||||||||||||||||||||||||||||||||||||||||||||||||||||||||||||||||||||||||||||||||||||||||||||||||||||||||||||||||||||||||||||||||||||||||||||||||||||||||||||||||||||||||||||||||||||||||||||||||||||||||||||||||||||||
| Original text written by user: | ||||||||||||||||||||||||||||||||||||||||||||||||||||||||||||||||||||||||||||||||||||||||||||||||||||||||||||||||||||||||||||||||||||||||||||||||||||||||||||||||||||||||||||||||||||||||||||||||||||||||||||||||||||||||||||||||||||||||||||||||||||||||||||||||||||||||||||||||||||||||||||||||||||||||||
| IsPrivate? | ||||||||||||||||||||||||||||||||||||||||||||||||||||||||||||||||||||||||||||||||||||||||||||||||||||||||||||||||||||||||||||||||||||||||||||||||||||||||||||||||||||||||||||||||||||||||||||||||||||||||||||||||||||||||||||||||||||||||||||||||||||||||||||||||||||||||||||||||||||||||||||||||||||||||||
| No (this computation is public) | ||||||||||||||||||||||||||||||||||||||||||||||||||||||||||||||||||||||||||||||||||||||||||||||||||||||||||||||||||||||||||||||||||||||||||||||||||||||||||||||||||||||||||||||||||||||||||||||||||||||||||||||||||||||||||||||||||||||||||||||||||||||||||||||||||||||||||||||||||||||||||||||||||||||||||
| User-defined keywords: | ||||||||||||||||||||||||||||||||||||||||||||||||||||||||||||||||||||||||||||||||||||||||||||||||||||||||||||||||||||||||||||||||||||||||||||||||||||||||||||||||||||||||||||||||||||||||||||||||||||||||||||||||||||||||||||||||||||||||||||||||||||||||||||||||||||||||||||||||||||||||||||||||||||||||||
| Dataseries X: | ||||||||||||||||||||||||||||||||||||||||||||||||||||||||||||||||||||||||||||||||||||||||||||||||||||||||||||||||||||||||||||||||||||||||||||||||||||||||||||||||||||||||||||||||||||||||||||||||||||||||||||||||||||||||||||||||||||||||||||||||||||||||||||||||||||||||||||||||||||||||||||||||||||||||||
| » Textbox « » Textfile « » CSV « | ||||||||||||||||||||||||||||||||||||||||||||||||||||||||||||||||||||||||||||||||||||||||||||||||||||||||||||||||||||||||||||||||||||||||||||||||||||||||||||||||||||||||||||||||||||||||||||||||||||||||||||||||||||||||||||||||||||||||||||||||||||||||||||||||||||||||||||||||||||||||||||||||||||||||||
| 100 96.21064363 96.31280765 107.1793443 114.9066592 92.56060184 114.9995356 107.1236185 117.7765394 107.3650971 106.2970187 114.5072908 98.0031578 103.0649206 100.2879168 104.6066685 111.1544534 104.9874617 109.9284852 111.5352466 132.4974459 100.3436426 123.0983561 114.2379493 104.569518 109.0833101 106.9843039 133.6769759 124.8537197 122.5132349 116.8013374 116.0118882 129.7575926 125.1973623 143.7912139 127.9465032 130.2962757 108.4424631 129.3675118 143.6797622 131.8844618 117.6186496 118.9560695 104.8202842 134.624315 140.401226 143.8005015 153.4317823 153.2924677 127.3149438 153.5525216 136.9276493 131.7730101 144.3391845 107.4208229 113.6249652 124.2221603 102.0618557 96.36853348 111.6838488 | ||||||||||||||||||||||||||||||||||||||||||||||||||||||||||||||||||||||||||||||||||||||||||||||||||||||||||||||||||||||||||||||||||||||||||||||||||||||||||||||||||||||||||||||||||||||||||||||||||||||||||||||||||||||||||||||||||||||||||||||||||||||||||||||||||||||||||||||||||||||||||||||||||||||||||
| Output produced by software: | ||||||||||||||||||||||||||||||||||||||||||||||||||||||||||||||||||||||||||||||||||||||||||||||||||||||||||||||||||||||||||||||||||||||||||||||||||||||||||||||||||||||||||||||||||||||||||||||||||||||||||||||||||||||||||||||||||||||||||||||||||||||||||||||||||||||||||||||||||||||||||||||||||||||||||
| Charts produced by software: |
| Parameters (Session): | par1 = 12 ; par2 = Triple ; par3 = multiplicative ; | | Parameters (R input): | par1 = 12 ; par2 = Triple ; par3 = multiplicative ; | | R code (references can be found in the software module): | par1 <- as.numeric(par1)
| if (par2 == 'Single') K <- 1 if (par2 == 'Double') K <- 2 if (par2 == 'Triple') K <- par1 nx <- length(x) nxmK <- nx - K x <- ts(x, frequency = par1) if (par2 == 'Single') fit <- HoltWinters(x, gamma=0, beta=0) if (par2 == 'Double') fit <- HoltWinters(x, gamma=0) if (par2 == 'Triple') fit <- HoltWinters(x, seasonal=par3) fit myresid <- x - fit$fitted[,'xhat'] bitmap(file='test1.png') op <- par(mfrow=c(2,1)) plot(fit,ylab='Observed (black) / Fitted (red)',main='Interpolation Fit of Exponential Smoothing') plot(myresid,ylab='Residuals',main='Interpolation Prediction Errors') par(op) dev.off() bitmap(file='test2.png') p <- predict(fit, par1, prediction.interval=TRUE) np <- length(p[,1]) plot(fit,p,ylab='Observed (black) / Fitted (red)',main='Extrapolation Fit of Exponential Smoothing') dev.off() bitmap(file='test3.png') op <- par(mfrow = c(2,2)) acf(as.numeric(myresid),lag.max = nx/2,main='Residual ACF') spectrum(myresid,main='Residals Periodogram') cpgram(myresid,main='Residal Cumulative Periodogram') qqnorm(myresid,main='Residual Normal QQ Plot') qqline(myresid) par(op) dev.off() load(file='createtable') a<-table.start() a<-table.row.start(a) a<-table.element(a,'Estimated Parameters of Exponential Smoothing',2,TRUE) a<-table.row.end(a) a<-table.row.start(a) a<-table.element(a,'Parameter',header=TRUE) a<-table.element(a,'Value',header=TRUE) a<-table.row.end(a) a<-table.row.start(a) a<-table.element(a,'alpha',header=TRUE) a<-table.element(a,fit$alpha) a<-table.row.end(a) a<-table.row.start(a) a<-table.element(a,'beta',header=TRUE) a<-table.element(a,fit$beta) a<-table.row.end(a) a<-table.row.start(a) a<-table.element(a,'gamma',header=TRUE) a<-table.element(a,fit$gamma) a<-table.row.end(a) a<-table.end(a) table.save(a,file='mytable.tab') a<-table.start() a<-table.row.start(a) a<-table.element(a,'Interpolation Forecasts of Exponential Smoothing',4,TRUE) a<-table.row.end(a) a<-table.row.start(a) a<-table.element(a,'t',header=TRUE) a<-table.element(a,'Observed',header=TRUE) a<-table.element(a,'Fitted',header=TRUE) a<-table.element(a,'Residuals',header=TRUE) a<-table.row.end(a) for (i in 1:nxmK) { a<-table.row.start(a) a<-table.element(a,i+K,header=TRUE) a<-table.element(a,x[i+K]) a<-table.element(a,fit$fitted[i,'xhat']) a<-table.element(a,myresid[i]) a<-table.row.end(a) } a<-table.end(a) table.save(a,file='mytable1.tab') a<-table.start() a<-table.row.start(a) a<-table.element(a,'Extrapolation Forecasts of Exponential Smoothing',4,TRUE) a<-table.row.end(a) a<-table.row.start(a) a<-table.element(a,'t',header=TRUE) a<-table.element(a,'Forecast',header=TRUE) a<-table.element(a,'95% Lower Bound',header=TRUE) a<-table.element(a,'95% Upper Bound',header=TRUE) a<-table.row.end(a) for (i in 1:np) { a<-table.row.start(a) a<-table.element(a,nx+i,header=TRUE) a<-table.element(a,p[i,'fit']) a<-table.element(a,p[i,'lwr']) a<-table.element(a,p[i,'upr']) a<-table.row.end(a) } a<-table.end(a) table.save(a,file='mytable2.tab') | Copyright
Software written by Ed van Stee & Patrick Wessa Disclaimer Information provided on this web site is provided "AS IS" without warranty of any kind, either express or implied, including, without limitation, warranties of merchantability, fitness for a particular purpose, and noninfringement. We use reasonable efforts to include accurate and timely information and periodically update the information, and software without notice. However, we make no warranties or representations as to the accuracy or completeness of such information (or software), and we assume no liability or responsibility for errors or omissions in the content of this web site, or any software bugs in online applications. Your use of this web site is AT YOUR OWN RISK. Under no circumstances and under no legal theory shall we be liable to you or any other person for any direct, indirect, special, incidental, exemplary, or consequential damages arising from your access to, or use of, this web site. Privacy Policy We may request personal information to be submitted to our servers in order to be able to:
We NEVER allow other companies to directly offer registered users information about their products and services. Banner references and hyperlinks of third parties NEVER contain any personal data of the visitor. We do NOT sell, nor transmit by any means, personal information, nor statistical data series uploaded by you to third parties.
We store a unique ANONYMOUS USER ID in the form of a small 'Cookie' on your computer. This allows us to track your progress when using this website which is necessary to create state-dependent features. The cookie is used for NO OTHER PURPOSE. At any time you may opt to disallow cookies from this website - this will not affect other features of this website. We examine cookies that are used by third-parties (banner and online ads) very closely: abuse from third-parties automatically results in termination of the advertising contract without refund. We have very good reason to believe that the cookies that are produced by third parties (banner ads) do NOT cause any privacy or security risk. FreeStatistics.org is safe. There is no need to download any software to use the applications and services contained in this website. Hence, your system's security is not compromised by their use, and your personal data - other than data you submit in the account application form, and the user-agent information that is transmitted by your browser - is never transmitted to our servers. As a general rule, we do not log on-line behavior of individuals (other than normal logging of webserver 'hits'). However, in cases of abuse, hacking, unauthorized access, Denial of Service attacks, illegal copying, hotlinking, non-compliance with international webstandards (such as robots.txt), or any other harmful behavior, our system engineers are empowered to log, track, identify, publish, and ban misbehaving individuals - even if this leads to ban entire blocks of IP addresses, or disclosing user's identity. | ||||||||||||||||||||||||||||||||||||||||||||||||||||||||||||||||||||||||||||||||||||||||||||||||||||||||||||||||||||||||||||||||||||||||||||||||||||||||||||||||||||||||||||||||||||||||||||||||||||||||||||||||||||||||||||||||||||||||||||||||||||||||||||||||||||||||||||||||||||||||||||||