Free Statistics
of Irreproducible Research!
Description of Statistical Computation | |||||||||||||||||||||
|---|---|---|---|---|---|---|---|---|---|---|---|---|---|---|---|---|---|---|---|---|---|
| Author's title | |||||||||||||||||||||
| Author | *The author of this computation has been verified* | ||||||||||||||||||||
| R Software Module | rwasp_meanplot.wasp | ||||||||||||||||||||
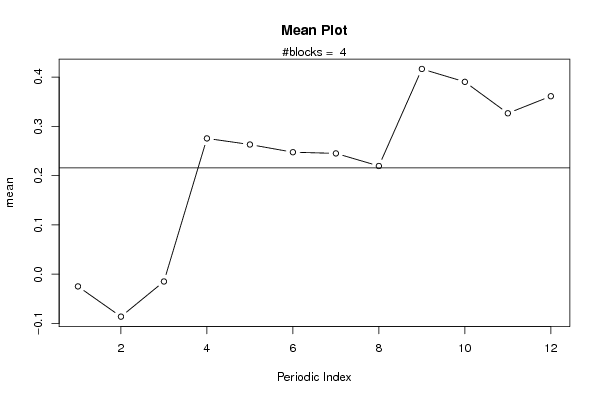
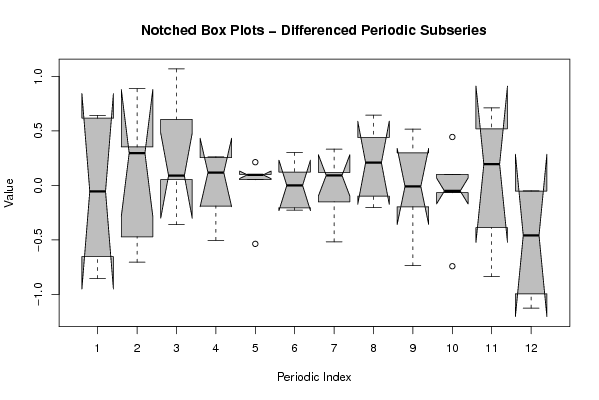
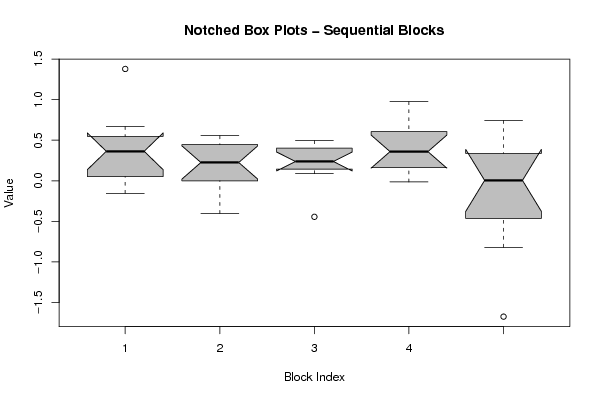
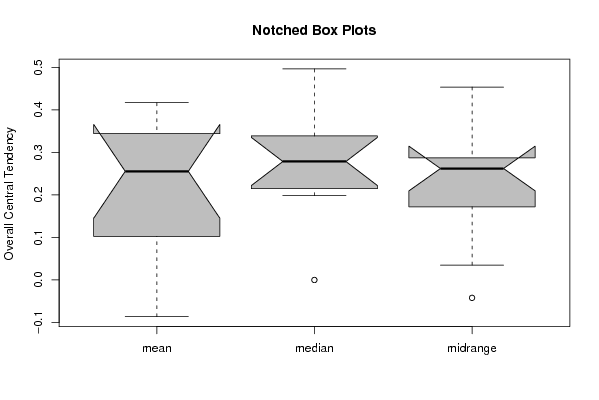
| Title produced by software | Mean Plot | ||||||||||||||||||||
| Date of computation | Fri, 11 Dec 2009 03:11:16 -0700 | ||||||||||||||||||||
| Cite this page as follows | Statistical Computations at FreeStatistics.org, Office for Research Development and Education, URL https://freestatistics.org/blog/index.php?v=date/2009/Dec/11/t1260526310kdrdvrqvripyxyu.htm/, Retrieved Mon, 07 Jul 2025 05:24:26 +0000 | ||||||||||||||||||||
| Statistical Computations at FreeStatistics.org, Office for Research Development and Education, URL https://freestatistics.org/blog/index.php?pk=65944, Retrieved Mon, 07 Jul 2025 05:24:26 +0000 | |||||||||||||||||||||
| QR Codes: | |||||||||||||||||||||
|
| |||||||||||||||||||||
| Original text written by user: | |||||||||||||||||||||
| IsPrivate? | No (this computation is public) | ||||||||||||||||||||
| User-defined keywords | |||||||||||||||||||||
| Estimated Impact | 216 | ||||||||||||||||||||
Tree of Dependent Computations | |||||||||||||||||||||
| Family? (F = Feedback message, R = changed R code, M = changed R Module, P = changed Parameters, D = changed Data) | |||||||||||||||||||||
| - [Kendall tau Rank Correlation] [3/11/2009] [2009-11-02 21:55:52] [b98453cac15ba1066b407e146608df68] - D [Kendall tau Rank Correlation] [scatter plot] [2009-11-05 15:40:34] [eaf42bcf5162b5692bb3c7f9d4636222] - RM D [Mean Plot] [Workshop 6: Mean ...] [2009-11-06 11:40:14] [1433a524809eda02c3198b3ae6eebb69] - PD [Mean Plot] [Mean Plot Amerika...] [2009-12-11 10:11:16] [a5c6be3c0aa55fdb2a703a08e16947ef] [Current] | |||||||||||||||||||||
| Feedback Forum | |||||||||||||||||||||
Post a new message | |||||||||||||||||||||
Dataset | |||||||||||||||||||||
| Dataseries X: | |||||||||||||||||||||
0,5270 0,4720 0,0000 0,0520 0,3130 0,3640 0,3630 -0,1550 0,0520 0,5680 0,6680 1,3780 0,2520 -0,4020 -0,0500 0,5550 0,0500 0,1500 0,4500 0,2990 0,1990 0,4960 0,4440 -0,3930 -0,4440 0,1980 0,4940 0,1330 0,3880 0,4840 0,2780 0,3690 0,1650 0,1550 0,0870 0,4140 0,3600 0,9750 0,2700 0,3590 0,1690 0,3810 0,1540 0,4860 0,9250 0,7280 -0,0140 0,0460 -0,8190 -1,6740 -0,7880 0,2790 0,3960 -0,1410 -0,0190 0,0990 0,7420 0,0050 0,4480 | |||||||||||||||||||||
Tables (Output of Computation) | |||||||||||||||||||||
| |||||||||||||||||||||
Figures (Output of Computation) | |||||||||||||||||||||
Input Parameters & R Code | |||||||||||||||||||||
| Parameters (Session): | |||||||||||||||||||||
| par1 = grey ; par2 = grey ; par3 = TRUE ; par4 = Inflatie Amerika ; par5 = US DOLLAR ; | |||||||||||||||||||||
| Parameters (R input): | |||||||||||||||||||||
| par1 = 12 ; | |||||||||||||||||||||
| R code (references can be found in the software module): | |||||||||||||||||||||
par1 <- as.numeric(par1) | |||||||||||||||||||||