| *The author of this computation has been verified* | ||||||||||||||||||||||||||||||||||||||||||||||||||||||||||||||||||||||||||||||||||||||||||||||||||||||||||||||||||||||||||||||||||||||||||||||||||||||||||||||||||||||||||||||||||||||||||||||||||||||||||||||||||||||||||||||||||||||||||||||||||||||||||||||||||||||||||||||||||||||||||||||||||||||||||||||||||||||||||||||||||||||||||||||||||||||||||||||||||||||||||||||||||||||||||||||||||||||||||||||||||||||||||||||||||||||||||||||||||||||||||||||||||||||||||||||||||||||||||||||||||||||||||||||||||||||||||||||||||||||||||||||||||||||||||||||||||||||||||||||||||||||||||||||||||||||||||||||||||||||||||||||||||||||||||||||||||
| R Software Module: /rwasp_arimaforecasting.wasp (opens new window with default values) | ||||||||||||||||||||||||||||||||||||||||||||||||||||||||||||||||||||||||||||||||||||||||||||||||||||||||||||||||||||||||||||||||||||||||||||||||||||||||||||||||||||||||||||||||||||||||||||||||||||||||||||||||||||||||||||||||||||||||||||||||||||||||||||||||||||||||||||||||||||||||||||||||||||||||||||||||||||||||||||||||||||||||||||||||||||||||||||||||||||||||||||||||||||||||||||||||||||||||||||||||||||||||||||||||||||||||||||||||||||||||||||||||||||||||||||||||||||||||||||||||||||||||||||||||||||||||||||||||||||||||||||||||||||||||||||||||||||||||||||||||||||||||||||||||||||||||||||||||||||||||||||||||||||||||||||||||||
| Title produced by software: ARIMA Forecasting | ||||||||||||||||||||||||||||||||||||||||||||||||||||||||||||||||||||||||||||||||||||||||||||||||||||||||||||||||||||||||||||||||||||||||||||||||||||||||||||||||||||||||||||||||||||||||||||||||||||||||||||||||||||||||||||||||||||||||||||||||||||||||||||||||||||||||||||||||||||||||||||||||||||||||||||||||||||||||||||||||||||||||||||||||||||||||||||||||||||||||||||||||||||||||||||||||||||||||||||||||||||||||||||||||||||||||||||||||||||||||||||||||||||||||||||||||||||||||||||||||||||||||||||||||||||||||||||||||||||||||||||||||||||||||||||||||||||||||||||||||||||||||||||||||||||||||||||||||||||||||||||||||||||||||||||||||||
| Date of computation: Thu, 10 Dec 2009 08:30:09 -0700 | ||||||||||||||||||||||||||||||||||||||||||||||||||||||||||||||||||||||||||||||||||||||||||||||||||||||||||||||||||||||||||||||||||||||||||||||||||||||||||||||||||||||||||||||||||||||||||||||||||||||||||||||||||||||||||||||||||||||||||||||||||||||||||||||||||||||||||||||||||||||||||||||||||||||||||||||||||||||||||||||||||||||||||||||||||||||||||||||||||||||||||||||||||||||||||||||||||||||||||||||||||||||||||||||||||||||||||||||||||||||||||||||||||||||||||||||||||||||||||||||||||||||||||||||||||||||||||||||||||||||||||||||||||||||||||||||||||||||||||||||||||||||||||||||||||||||||||||||||||||||||||||||||||||||||||||||||||
| Cite this page as follows: | ||||||||||||||||||||||||||||||||||||||||||||||||||||||||||||||||||||||||||||||||||||||||||||||||||||||||||||||||||||||||||||||||||||||||||||||||||||||||||||||||||||||||||||||||||||||||||||||||||||||||||||||||||||||||||||||||||||||||||||||||||||||||||||||||||||||||||||||||||||||||||||||||||||||||||||||||||||||||||||||||||||||||||||||||||||||||||||||||||||||||||||||||||||||||||||||||||||||||||||||||||||||||||||||||||||||||||||||||||||||||||||||||||||||||||||||||||||||||||||||||||||||||||||||||||||||||||||||||||||||||||||||||||||||||||||||||||||||||||||||||||||||||||||||||||||||||||||||||||||||||||||||||||||||||||||||||||
| Statistical Computations at FreeStatistics.org, Office for Research Development and Education, URL http://www.freestatistics.org/blog/date/2009/Dec/10/t1260459052zn8aq2jgyz4tvte.htm/, Retrieved Thu, 10 Dec 2009 16:30:55 +0100 | ||||||||||||||||||||||||||||||||||||||||||||||||||||||||||||||||||||||||||||||||||||||||||||||||||||||||||||||||||||||||||||||||||||||||||||||||||||||||||||||||||||||||||||||||||||||||||||||||||||||||||||||||||||||||||||||||||||||||||||||||||||||||||||||||||||||||||||||||||||||||||||||||||||||||||||||||||||||||||||||||||||||||||||||||||||||||||||||||||||||||||||||||||||||||||||||||||||||||||||||||||||||||||||||||||||||||||||||||||||||||||||||||||||||||||||||||||||||||||||||||||||||||||||||||||||||||||||||||||||||||||||||||||||||||||||||||||||||||||||||||||||||||||||||||||||||||||||||||||||||||||||||||||||||||||||||||||
| BibTeX entries for LaTeX users: | ||||||||||||||||||||||||||||||||||||||||||||||||||||||||||||||||||||||||||||||||||||||||||||||||||||||||||||||||||||||||||||||||||||||||||||||||||||||||||||||||||||||||||||||||||||||||||||||||||||||||||||||||||||||||||||||||||||||||||||||||||||||||||||||||||||||||||||||||||||||||||||||||||||||||||||||||||||||||||||||||||||||||||||||||||||||||||||||||||||||||||||||||||||||||||||||||||||||||||||||||||||||||||||||||||||||||||||||||||||||||||||||||||||||||||||||||||||||||||||||||||||||||||||||||||||||||||||||||||||||||||||||||||||||||||||||||||||||||||||||||||||||||||||||||||||||||||||||||||||||||||||||||||||||||||||||||||
@Manual{KEY,
    author = {{YOUR NAME}},
    publisher = {Office for Research Development and Education},
    title = {Statistical Computations at FreeStatistics.org, URL http://www.freestatistics.org/blog/date/2009/Dec/10/t1260459052zn8aq2jgyz4tvte.htm/},
    year = {2009},
}
@Manual{R,
    title = {R: A Language and Environment for Statistical Computing},
    author = {{R Development Core Team}},
    organization = {R Foundation for Statistical Computing},
    address = {Vienna, Austria},
    year = {2009},
    note = {{ISBN} 3-900051-07-0},
    url = {http://www.R-project.org},
}
| ||||||||||||||||||||||||||||||||||||||||||||||||||||||||||||||||||||||||||||||||||||||||||||||||||||||||||||||||||||||||||||||||||||||||||||||||||||||||||||||||||||||||||||||||||||||||||||||||||||||||||||||||||||||||||||||||||||||||||||||||||||||||||||||||||||||||||||||||||||||||||||||||||||||||||||||||||||||||||||||||||||||||||||||||||||||||||||||||||||||||||||||||||||||||||||||||||||||||||||||||||||||||||||||||||||||||||||||||||||||||||||||||||||||||||||||||||||||||||||||||||||||||||||||||||||||||||||||||||||||||||||||||||||||||||||||||||||||||||||||||||||||||||||||||||||||||||||||||||||||||||||||||||||||||||||||||||
| Original text written by user: | ||||||||||||||||||||||||||||||||||||||||||||||||||||||||||||||||||||||||||||||||||||||||||||||||||||||||||||||||||||||||||||||||||||||||||||||||||||||||||||||||||||||||||||||||||||||||||||||||||||||||||||||||||||||||||||||||||||||||||||||||||||||||||||||||||||||||||||||||||||||||||||||||||||||||||||||||||||||||||||||||||||||||||||||||||||||||||||||||||||||||||||||||||||||||||||||||||||||||||||||||||||||||||||||||||||||||||||||||||||||||||||||||||||||||||||||||||||||||||||||||||||||||||||||||||||||||||||||||||||||||||||||||||||||||||||||||||||||||||||||||||||||||||||||||||||||||||||||||||||||||||||||||||||||||||||||||||
| IsPrivate? | ||||||||||||||||||||||||||||||||||||||||||||||||||||||||||||||||||||||||||||||||||||||||||||||||||||||||||||||||||||||||||||||||||||||||||||||||||||||||||||||||||||||||||||||||||||||||||||||||||||||||||||||||||||||||||||||||||||||||||||||||||||||||||||||||||||||||||||||||||||||||||||||||||||||||||||||||||||||||||||||||||||||||||||||||||||||||||||||||||||||||||||||||||||||||||||||||||||||||||||||||||||||||||||||||||||||||||||||||||||||||||||||||||||||||||||||||||||||||||||||||||||||||||||||||||||||||||||||||||||||||||||||||||||||||||||||||||||||||||||||||||||||||||||||||||||||||||||||||||||||||||||||||||||||||||||||||||
| No (this computation is public) | ||||||||||||||||||||||||||||||||||||||||||||||||||||||||||||||||||||||||||||||||||||||||||||||||||||||||||||||||||||||||||||||||||||||||||||||||||||||||||||||||||||||||||||||||||||||||||||||||||||||||||||||||||||||||||||||||||||||||||||||||||||||||||||||||||||||||||||||||||||||||||||||||||||||||||||||||||||||||||||||||||||||||||||||||||||||||||||||||||||||||||||||||||||||||||||||||||||||||||||||||||||||||||||||||||||||||||||||||||||||||||||||||||||||||||||||||||||||||||||||||||||||||||||||||||||||||||||||||||||||||||||||||||||||||||||||||||||||||||||||||||||||||||||||||||||||||||||||||||||||||||||||||||||||||||||||||||
| User-defined keywords: | ||||||||||||||||||||||||||||||||||||||||||||||||||||||||||||||||||||||||||||||||||||||||||||||||||||||||||||||||||||||||||||||||||||||||||||||||||||||||||||||||||||||||||||||||||||||||||||||||||||||||||||||||||||||||||||||||||||||||||||||||||||||||||||||||||||||||||||||||||||||||||||||||||||||||||||||||||||||||||||||||||||||||||||||||||||||||||||||||||||||||||||||||||||||||||||||||||||||||||||||||||||||||||||||||||||||||||||||||||||||||||||||||||||||||||||||||||||||||||||||||||||||||||||||||||||||||||||||||||||||||||||||||||||||||||||||||||||||||||||||||||||||||||||||||||||||||||||||||||||||||||||||||||||||||||||||||||
| Dataseries X: | ||||||||||||||||||||||||||||||||||||||||||||||||||||||||||||||||||||||||||||||||||||||||||||||||||||||||||||||||||||||||||||||||||||||||||||||||||||||||||||||||||||||||||||||||||||||||||||||||||||||||||||||||||||||||||||||||||||||||||||||||||||||||||||||||||||||||||||||||||||||||||||||||||||||||||||||||||||||||||||||||||||||||||||||||||||||||||||||||||||||||||||||||||||||||||||||||||||||||||||||||||||||||||||||||||||||||||||||||||||||||||||||||||||||||||||||||||||||||||||||||||||||||||||||||||||||||||||||||||||||||||||||||||||||||||||||||||||||||||||||||||||||||||||||||||||||||||||||||||||||||||||||||||||||||||||||||||
| » Textbox « » Textfile « » CSV « | ||||||||||||||||||||||||||||||||||||||||||||||||||||||||||||||||||||||||||||||||||||||||||||||||||||||||||||||||||||||||||||||||||||||||||||||||||||||||||||||||||||||||||||||||||||||||||||||||||||||||||||||||||||||||||||||||||||||||||||||||||||||||||||||||||||||||||||||||||||||||||||||||||||||||||||||||||||||||||||||||||||||||||||||||||||||||||||||||||||||||||||||||||||||||||||||||||||||||||||||||||||||||||||||||||||||||||||||||||||||||||||||||||||||||||||||||||||||||||||||||||||||||||||||||||||||||||||||||||||||||||||||||||||||||||||||||||||||||||||||||||||||||||||||||||||||||||||||||||||||||||||||||||||||||||||||||||
| 116222 110924 103753 99983 93302 91496 119321 139261 133739 123913 113438 109416 109406 105645 101328 97686 93093 91382 122257 139183 139887 131822 116805 113706 113012 110452 107005 102841 98173 98181 137277 147579 146571 138920 130340 128140 127059 122860 117702 113537 108366 111078 150739 159129 157928 147768 137507 136919 136151 133001 125554 119647 114158 116193 152803 161761 160942 149470 139208 134588 130322 126611 122401 117352 112135 112879 148729 157230 157221 146681 136524 132111 | ||||||||||||||||||||||||||||||||||||||||||||||||||||||||||||||||||||||||||||||||||||||||||||||||||||||||||||||||||||||||||||||||||||||||||||||||||||||||||||||||||||||||||||||||||||||||||||||||||||||||||||||||||||||||||||||||||||||||||||||||||||||||||||||||||||||||||||||||||||||||||||||||||||||||||||||||||||||||||||||||||||||||||||||||||||||||||||||||||||||||||||||||||||||||||||||||||||||||||||||||||||||||||||||||||||||||||||||||||||||||||||||||||||||||||||||||||||||||||||||||||||||||||||||||||||||||||||||||||||||||||||||||||||||||||||||||||||||||||||||||||||||||||||||||||||||||||||||||||||||||||||||||||||||||||||||||||
| Output produced by software: | ||||||||||||||||||||||||||||||||||||||||||||||||||||||||||||||||||||||||||||||||||||||||||||||||||||||||||||||||||||||||||||||||||||||||||||||||||||||||||||||||||||||||||||||||||||||||||||||||||||||||||||||||||||||||||||||||||||||||||||||||||||||||||||||||||||||||||||||||||||||||||||||||||||||||||||||||||||||||||||||||||||||||||||||||||||||||||||||||||||||||||||||||||||||||||||||||||||||||||||||||||||||||||||||||||||||||||||||||||||||||||||||||||||||||||||||||||||||||||||||||||||||||||||||||||||||||||||||||||||||||||||||||||||||||||||||||||||||||||||||||||||||||||||||||||||||||||||||||||||||||||||||||||||||||||||||||||
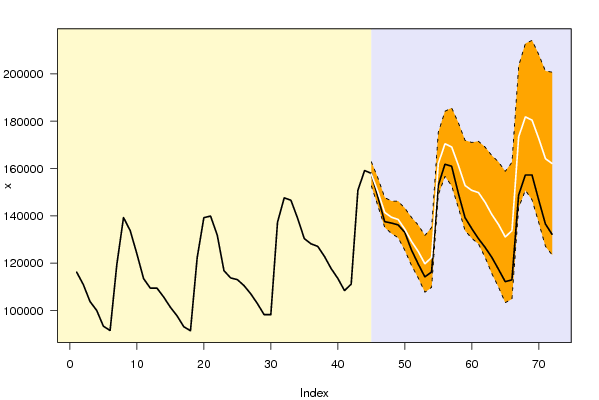
| Charts produced by software: |
| Parameters (Session): | par1 = FALSE ; par2 = 1 ; par3 = 1 ; par4 = 0 ; par5 = 12 ; par6 = 3 ; par7 = 0 ; par8 = 0 ; par9 = 0 ; | | Parameters (R input): | par1 = 24 ; par2 = 1 ; par3 = 1 ; par4 = 1 ; par5 = 12 ; par6 = 0 ; par7 = 0 ; par8 = 0 ; par9 = 0 ; par10 = FALSE ; | | R code (references can be found in the software module): | par1 <- as.numeric(par1) #cut off periods
| par1 <- 28 par2 <- as.numeric(par2) #lambda par3 <- as.numeric(par3) #degree of non-seasonal differencing par4 <- as.numeric(par4) #degree of seasonal differencing par5 <- as.numeric(par5) #seasonal period par6 <- as.numeric(par6) #p par6 <- 3 par7 <- as.numeric(par7) #q par7 <- 3 par8 <- as.numeric(par8) #P par9 <- as.numeric(par9) #Q if (par10 == 'TRUE') par10 <- TRUE if (par10 == 'FALSE') par10 <- FALSE if (par2 == 0) x <- log(x) if (par2 != 0) x <- x^par2 lx <- length(x) first <- lx - 2*par1 nx <- lx - par1 nx1 <- nx + 1 fx <- lx - nx if (fx < 1) { fx <- par5 nx1 <- lx + fx - 1 first <- lx - 2*fx } first <- 1 if (fx < 3) fx <- round(lx/10,0) (arima.out <- arima(x[1:nx], order=c(par6,par3,par7), seasonal=list(order=c(par8,par4,par9), period=par5), include.mean=par10, method='ML')) (forecast <- predict(arima.out,par1)) (lb <- forecast$pred - 1.96 * forecast$se) (ub <- forecast$pred + 1.96 * forecast$se) if (par2 == 0) { x <- exp(x) forecast$pred <- exp(forecast$pred) lb <- exp(lb) ub <- exp(ub) } if (par2 != 0) { x <- x^(1/par2) forecast$pred <- forecast$pred^(1/par2) lb <- lb^(1/par2) ub <- ub^(1/par2) } if (par2 < 0) { olb <- lb lb <- ub ub <- olb } (actandfor <- c(x[1:nx], forecast$pred)) (perc.se <- (ub-forecast$pred)/1.96/forecast$pred) bitmap(file='test1.png') opar <- par(mar=c(4,4,2,2),las=1) ylim <- c( min(x[first:nx],lb), max(x[first:nx],ub)) plot(x,ylim=ylim,type='n',xlim=c(first,lx)) usr <- par('usr') rect(usr[1],usr[3],nx+1,usr[4],border=NA,col='lemonchiffon') rect(nx1,usr[3],usr[2],usr[4],border=NA,col='lavender') abline(h= (-3:3)*2 , col ='gray', lty =3) polygon( c(nx1:lx,lx:nx1), c(lb,rev(ub)), col = 'orange', lty=2,border=NA) lines(nx1:lx, lb , lty=2) lines(nx1:lx, ub , lty=2) lines(x, lwd=2) lines(nx1:lx, forecast$pred , lwd=2 , col ='white') box() par(opar) dev.off() prob.dec <- array(NA, dim=fx) prob.sdec <- array(NA, dim=fx) prob.ldec <- array(NA, dim=fx) prob.pval <- array(NA, dim=fx) perf.pe <- array(0, dim=fx) perf.mape <- array(0, dim=fx) perf.mape1 <- array(0, dim=fx) perf.se <- array(0, dim=fx) perf.mse <- array(0, dim=fx) perf.mse1 <- array(0, dim=fx) perf.rmse <- array(0, dim=fx) for (i in 1:fx) { locSD <- (ub[i] - forecast$pred[i]) / 1.96 perf.pe[i] = (x[nx+i] - forecast$pred[i]) / forecast$pred[i] perf.se[i] = (x[nx+i] - forecast$pred[i])^2 prob.dec[i] = pnorm((x[nx+i-1] - forecast$pred[i]) / locSD) prob.sdec[i] = pnorm((x[nx+i-par5] - forecast$pred[i]) / locSD) prob.ldec[i] = pnorm((x[nx] - forecast$pred[i]) / locSD) prob.pval[i] = pnorm(abs(x[nx+i] - forecast$pred[i]) / locSD) } perf.mape[1] = abs(perf.pe[1]) perf.mse[1] = abs(perf.se[1]) for (i in 2:fx) { perf.mape[i] = perf.mape[i-1] + abs(perf.pe[i]) perf.mape1[i] = perf.mape[i] / i perf.mse[i] = perf.mse[i-1] + perf.se[i] perf.mse1[i] = perf.mse[i] / i } perf.rmse = sqrt(perf.mse1) bitmap(file='test2.png') plot(forecast$pred, pch=19, type='b',main='ARIMA Extrapolation Forecast', ylab='Forecast and 95% CI', xlab='time',ylim=c(min(lb),max(ub))) dum <- forecast$pred dum[1:par1] <- x[(nx+1):lx] lines(dum, lty=1) lines(ub,lty=3) lines(lb,lty=3) dev.off() load(file='createtable') a<-table.start() a<-table.row.start(a) a<-table.element(a,'Univariate ARIMA Extrapolation Forecast',9,TRUE) a<-table.row.end(a) a<-table.row.start(a) a<-table.element(a,'time',1,header=TRUE) a<-table.element(a,'Y[t]',1,header=TRUE) a<-table.element(a,'F[t]',1,header=TRUE) a<-table.element(a,'95% LB',1,header=TRUE) a<-table.element(a,'95% UB',1,header=TRUE) a<-table.element(a,'p-value<br />(H0: Y[t] = F[t])',1,header=TRUE) a<-table.element(a,'P(F[t]>Y[t-1])',1,header=TRUE) a<-table.element(a,'P(F[t]>Y[t-s])',1,header=TRUE) mylab <- paste('P(F[t]>Y[',nx,sep='') mylab <- paste(mylab,'])',sep='') a<-table.element(a,mylab,1,header=TRUE) a<-table.row.end(a) for (i in (nx-par5):nx) { a<-table.row.start(a) a<-table.element(a,i,header=TRUE) a<-table.element(a,x[i]) a<-table.element(a,'-') a<-table.element(a,'-') a<-table.element(a,'-') a<-table.element(a,'-') a<-table.element(a,'-') a<-table.element(a,'-') a<-table.element(a,'-') a<-table.row.end(a) } for (i in 1:fx) { a<-table.row.start(a) a<-table.element(a,nx+i,header=TRUE) a<-table.element(a,round(x[nx+i],4)) a<-table.element(a,round(forecast$pred[i],4)) a<-table.element(a,round(lb[i],4)) a<-table.element(a,round(ub[i],4)) a<-table.element(a,round((1-prob.pval[i]),4)) a<-table.element(a,round((1-prob.dec[i]),4)) a<-table.element(a,round((1-prob.sdec[i]),4)) a<-table.element(a,round((1-prob.ldec[i]),4)) a<-table.row.end(a) } a<-table.end(a) table.save(a,file='mytable.tab') a<-table.start() a<-table.row.start(a) a<-table.element(a,'Univariate ARIMA Extrapolation Forecast Performance',7,TRUE) a<-table.row.end(a) a<-table.row.start(a) a<-table.element(a,'time',1,header=TRUE) a<-table.element(a,'% S.E.',1,header=TRUE) a<-table.element(a,'PE',1,header=TRUE) a<-table.element(a,'MAPE',1,header=TRUE) a<-table.element(a,'Sq.E',1,header=TRUE) a<-table.element(a,'MSE',1,header=TRUE) a<-table.element(a,'RMSE',1,header=TRUE) a<-table.row.end(a) for (i in 1:fx) { a<-table.row.start(a) a<-table.element(a,nx+i,header=TRUE) a<-table.element(a,round(perc.se[i],4)) a<-table.element(a,round(perf.pe[i],4)) a<-table.element(a,round(perf.mape1[i],4)) a<-table.element(a,round(perf.se[i],4)) a<-table.element(a,round(perf.mse1[i],4)) a<-table.element(a,round(perf.rmse[i],4)) a<-table.row.end(a) } a<-table.end(a) table.save(a,file='mytable1.tab') | Copyright
Software written by Ed van Stee & Patrick Wessa Disclaimer Information provided on this web site is provided "AS IS" without warranty of any kind, either express or implied, including, without limitation, warranties of merchantability, fitness for a particular purpose, and noninfringement. We use reasonable efforts to include accurate and timely information and periodically update the information, and software without notice. However, we make no warranties or representations as to the accuracy or completeness of such information (or software), and we assume no liability or responsibility for errors or omissions in the content of this web site, or any software bugs in online applications. Your use of this web site is AT YOUR OWN RISK. Under no circumstances and under no legal theory shall we be liable to you or any other person for any direct, indirect, special, incidental, exemplary, or consequential damages arising from your access to, or use of, this web site. Privacy Policy We may request personal information to be submitted to our servers in order to be able to:
We NEVER allow other companies to directly offer registered users information about their products and services. Banner references and hyperlinks of third parties NEVER contain any personal data of the visitor. We do NOT sell, nor transmit by any means, personal information, nor statistical data series uploaded by you to third parties.
We store a unique ANONYMOUS USER ID in the form of a small 'Cookie' on your computer. This allows us to track your progress when using this website which is necessary to create state-dependent features. The cookie is used for NO OTHER PURPOSE. At any time you may opt to disallow cookies from this website - this will not affect other features of this website. We examine cookies that are used by third-parties (banner and online ads) very closely: abuse from third-parties automatically results in termination of the advertising contract without refund. We have very good reason to believe that the cookies that are produced by third parties (banner ads) do NOT cause any privacy or security risk. FreeStatistics.org is safe. There is no need to download any software to use the applications and services contained in this website. Hence, your system's security is not compromised by their use, and your personal data - other than data you submit in the account application form, and the user-agent information that is transmitted by your browser - is never transmitted to our servers. As a general rule, we do not log on-line behavior of individuals (other than normal logging of webserver 'hits'). However, in cases of abuse, hacking, unauthorized access, Denial of Service attacks, illegal copying, hotlinking, non-compliance with international webstandards (such as robots.txt), or any other harmful behavior, our system engineers are empowered to log, track, identify, publish, and ban misbehaving individuals - even if this leads to ban entire blocks of IP addresses, or disclosing user's identity. | ||||||||||||||||||||||||||||||||||||||||||||||||||||||||||||||||||||||||||||||||||||||||||||||||||||||||||||||||||||||||||||||||||||||||||||||||||||||||||||||||||||||||||||||||||||||||||||||||||||||||||||||||||||||||||||||||||||||||||||||||||||||||||||||||||||||||||||||||||||||||||||||||||||||||||||||||||||||||||||||||||||||||||||||||||||||||||||||||||||||||||||||||||||||||||||||||||||||||||||||||||||||||||||||||||||||||||||||||||||||||||||||||||||||||||||||||||||||||||||||||||||||||||||||||||||||||||||||||||||||||||||||||||||||||||||||||||||||||||||||||||||||||||||||||||||||||||||||||||||||||||||||||||||||