mean plot residus | ||||||||||||||||||||||||||||||||||||||||||||
| *The author of this computation has been verified* | ||||||||||||||||||||||||||||||||||||||||||||
| R Software Module: /rwasp_meanplot.wasp (opens new window with default values) | ||||||||||||||||||||||||||||||||||||||||||||
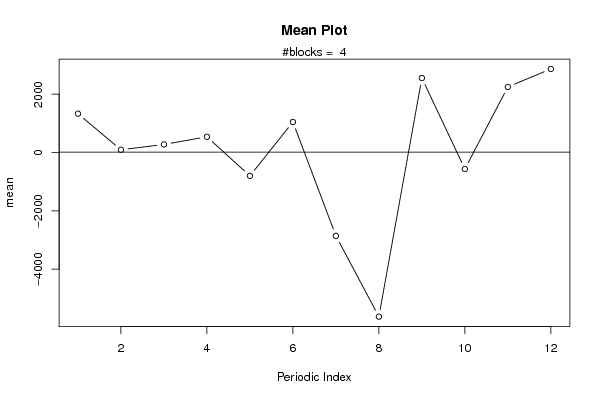
| Title produced by software: Mean Plot | ||||||||||||||||||||||||||||||||||||||||||||
| Date of computation: Wed, 02 Dec 2009 14:29:27 -0700 | ||||||||||||||||||||||||||||||||||||||||||||
| Cite this page as follows: | ||||||||||||||||||||||||||||||||||||||||||||
| Statistical Computations at FreeStatistics.org, Office for Research Development and Education, URL http://www.freestatistics.org/blog/date/2009/Dec/02/t1259789508yf3kbipw37t11kx.htm/, Retrieved Wed, 02 Dec 2009 22:31:58 +0100 | ||||||||||||||||||||||||||||||||||||||||||||
| BibTeX entries for LaTeX users: | ||||||||||||||||||||||||||||||||||||||||||||
@Manual{KEY,
    author = {{YOUR NAME}},
    publisher = {Office for Research Development and Education},
    title = {Statistical Computations at FreeStatistics.org, URL http://www.freestatistics.org/blog/date/2009/Dec/02/t1259789508yf3kbipw37t11kx.htm/},
    year = {2009},
}
@Manual{R,
    title = {R: A Language and Environment for Statistical Computing},
    author = {{R Development Core Team}},
    organization = {R Foundation for Statistical Computing},
    address = {Vienna, Austria},
    year = {2009},
    note = {{ISBN} 3-900051-07-0},
    url = {http://www.R-project.org},
}
| ||||||||||||||||||||||||||||||||||||||||||||
| Original text written by user: | ||||||||||||||||||||||||||||||||||||||||||||
| IsPrivate? | ||||||||||||||||||||||||||||||||||||||||||||
| No (this computation is public) | ||||||||||||||||||||||||||||||||||||||||||||
| User-defined keywords: | ||||||||||||||||||||||||||||||||||||||||||||
| Dataseries X: | ||||||||||||||||||||||||||||||||||||||||||||
| » Textbox « » Textfile « » CSV « | ||||||||||||||||||||||||||||||||||||||||||||
| -719.405774320179 -1892.13972512203 948.584751735815 694.702053597555 -1016.98885981099 -985.243198088241 -439.006139106049 -8289.64839707302 478.341587615535 -4619.19009697141 -438.889269676146 1922.27169831854 -9316.27276546704 4934.24926529499 294.506079291393 6062.59748359645 1545.14497838096 -5388.19323530356 -8728.74410350888 -10701.1030591330 10938.7367915057 -12697.2927303432 -1368.16155419152 545.462343565687 8646.56018969786 -5152.59361283694 -5230.8539005193 -1548.47014455579 -337.152015819184 1309.74791688059 2666.25355012676 -5370.63361781142 -7476.69691278903 8086.32165260496 6571.98868771161 3149.48850681552 104.637480526355 -1952.46924181325 3591.38504257275 962.019554951216 -5699.66826957231 5791.29992251809 -3685.82799741182 -4065.74959426738 6283.84760394879 6963.92536654231 4239.8594212716 5856.07066535003 7938.63020854731 4533.55760400507 1779.15891762194 -3469.0240935556 1497.02166817019 4510.32580191698 -4112.36752504752 254.6559603 etc... | ||||||||||||||||||||||||||||||||||||||||||||
| Output produced by software: | ||||||||||||||||||||||||||||||||||||||||||||
| Charts produced by software: |
| Parameters (Session): | par1 = 12 ; | | Parameters (R input): | par1 = 12 ; | | R code (references can be found in the software module): | par1 <- as.numeric(par1)
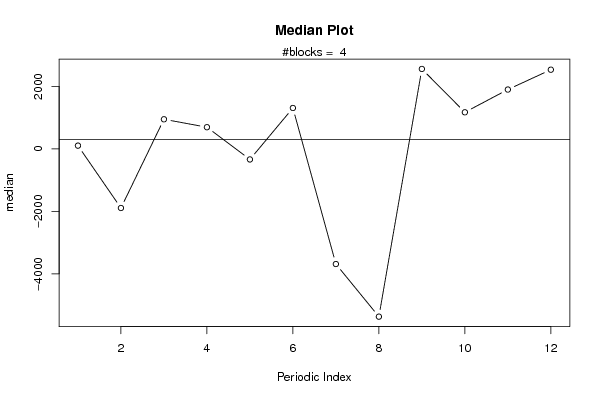
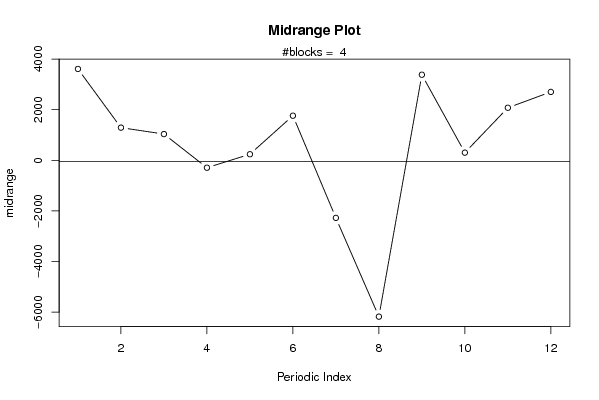
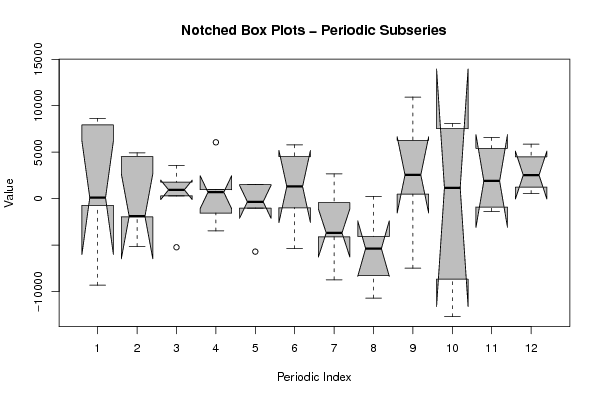
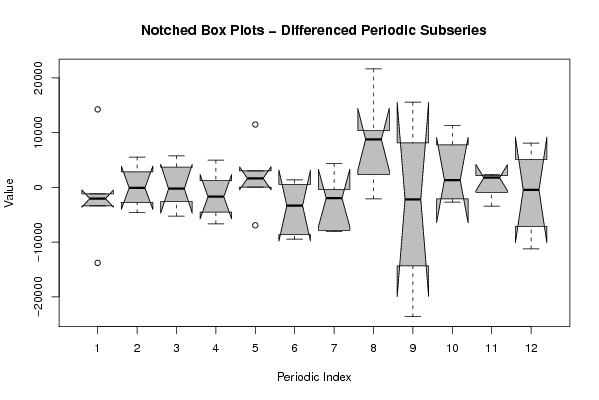
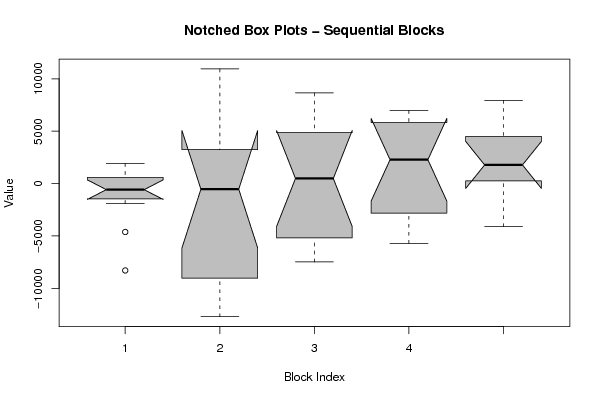
| (n <- length(x)) (np <- floor(n / par1)) arr <- array(NA,dim=c(par1,np+1)) darr <- array(NA,dim=c(par1,np+1)) ari <- array(0,dim=par1) dx <- diff(x) j <- 0 for (i in 1:n) { j = j + 1 ari[j] = ari[j] + 1 arr[j,ari[j]] <- x[i] darr[j,ari[j]] <- dx[i] if (j == par1) j = 0 } ari arr darr arr.mean <- array(NA,dim=par1) arr.median <- array(NA,dim=par1) arr.midrange <- array(NA,dim=par1) for (j in 1:par1) { arr.mean[j] <- mean(arr[j,],na.rm=TRUE) arr.median[j] <- median(arr[j,],na.rm=TRUE) arr.midrange[j] <- (quantile(arr[j,],0.75,na.rm=TRUE) + quantile(arr[j,],0.25,na.rm=TRUE)) / 2 } overall.mean <- mean(x) overall.median <- median(x) overall.midrange <- (quantile(x,0.75) + quantile(x,0.25)) / 2 bitmap(file='plot1.png') plot(arr.mean,type='b',ylab='mean',main='Mean Plot',xlab='Periodic Index') mtext(paste('#blocks = ',np)) abline(overall.mean,0) dev.off() bitmap(file='plot2.png') plot(arr.median,type='b',ylab='median',main='Median Plot',xlab='Periodic Index') mtext(paste('#blocks = ',np)) abline(overall.median,0) dev.off() bitmap(file='plot3.png') plot(arr.midrange,type='b',ylab='midrange',main='Midrange Plot',xlab='Periodic Index') mtext(paste('#blocks = ',np)) abline(overall.midrange,0) dev.off() bitmap(file='plot4.png') z <- data.frame(t(arr)) names(z) <- c(1:par1) (boxplot(z,notch=TRUE,col='grey',xlab='Periodic Index',ylab='Value',main='Notched Box Plots - Periodic Subseries')) dev.off() bitmap(file='plot4b.png') z <- data.frame(t(darr)) names(z) <- c(1:par1) (boxplot(z,notch=TRUE,col='grey',xlab='Periodic Index',ylab='Value',main='Notched Box Plots - Differenced Periodic Subseries')) dev.off() bitmap(file='plot5.png') z <- data.frame(arr) names(z) <- c(1:np) (boxplot(z,notch=TRUE,col='grey',xlab='Block Index',ylab='Value',main='Notched Box Plots - Sequential Blocks')) dev.off() bitmap(file='plot6.png') z <- data.frame(cbind(arr.mean,arr.median,arr.midrange)) names(z) <- list('mean','median','midrange') (boxplot(z,notch=TRUE,col='grey',ylab='Overall Central Tendency',main='Notched Box Plots')) dev.off() | Copyright
Software written by Ed van Stee & Patrick Wessa Disclaimer Information provided on this web site is provided "AS IS" without warranty of any kind, either express or implied, including, without limitation, warranties of merchantability, fitness for a particular purpose, and noninfringement. We use reasonable efforts to include accurate and timely information and periodically update the information, and software without notice. However, we make no warranties or representations as to the accuracy or completeness of such information (or software), and we assume no liability or responsibility for errors or omissions in the content of this web site, or any software bugs in online applications. Your use of this web site is AT YOUR OWN RISK. Under no circumstances and under no legal theory shall we be liable to you or any other person for any direct, indirect, special, incidental, exemplary, or consequential damages arising from your access to, or use of, this web site. Privacy Policy We may request personal information to be submitted to our servers in order to be able to:
We NEVER allow other companies to directly offer registered users information about their products and services. Banner references and hyperlinks of third parties NEVER contain any personal data of the visitor. We do NOT sell, nor transmit by any means, personal information, nor statistical data series uploaded by you to third parties.
We store a unique ANONYMOUS USER ID in the form of a small 'Cookie' on your computer. This allows us to track your progress when using this website which is necessary to create state-dependent features. The cookie is used for NO OTHER PURPOSE. At any time you may opt to disallow cookies from this website - this will not affect other features of this website. We examine cookies that are used by third-parties (banner and online ads) very closely: abuse from third-parties automatically results in termination of the advertising contract without refund. We have very good reason to believe that the cookies that are produced by third parties (banner ads) do NOT cause any privacy or security risk. FreeStatistics.org is safe. There is no need to download any software to use the applications and services contained in this website. Hence, your system's security is not compromised by their use, and your personal data - other than data you submit in the account application form, and the user-agent information that is transmitted by your browser - is never transmitted to our servers. As a general rule, we do not log on-line behavior of individuals (other than normal logging of webserver 'hits'). However, in cases of abuse, hacking, unauthorized access, Denial of Service attacks, illegal copying, hotlinking, non-compliance with international webstandards (such as robots.txt), or any other harmful behavior, our system engineers are empowered to log, track, identify, publish, and ban misbehaving individuals - even if this leads to ban entire blocks of IP addresses, or disclosing user's identity. | ||||||||||||||||||||||||||||||||