Free Statistics
of Irreproducible Research!
Description of Statistical Computation | |
|---|---|
| Author's title | |
| Author | *The author of this computation has been verified* |
| R Software Module | Rscript (source code is shown below) |
| Title produced by software | R console |
| Date of computation | Mon, 31 Aug 2009 03:22:50 -0600 |
| Cite this page as follows | Statistical Computations at FreeStatistics.org, Office for Research Development and Education, URL https://freestatistics.org/blog/index.php?v=date/2009/Aug/31/t12517105713udjm2leteqhc5e.htm/, Retrieved Fri, 05 Jun 2026 08:56:47 +0000 |
| Statistical Computations at FreeStatistics.org, Office for Research Development and Education, URL https://freestatistics.org/blog/index.php?pk=42975, Retrieved Fri, 05 Jun 2026 08:56:47 +0000 | |
| QR Codes: | |
|
| |
| Original text written by user: | This example is used in the manual files of the RC package. |
| IsPrivate? | No (this computation is public) |
| User-defined keywords | blogtest |
| Estimated Impact | 545 |
Tree of Dependent Computations | |
| Family? (F = Feedback message, R = changed R code, M = changed R Module, P = changed Parameters, D = changed Data) | |
| - [Bagplot] [test] [2009-08-13 21:20:56] [b98453cac15ba1066b407e146608df68] - RMPD [R console] [correlation test] [2009-08-31 09:22:50] [256f657a32c6b2b7628dddcfa9a822d0] [Current] | |
| Feedback Forum | |
Post a new message | |
Dataset | |
| Dataseries X: | |
0.062620628072033 1.17492693540226 -0.218910553371328 1.63063873634215 -0.799255430569963 1.02986851983746 -0.375641509883614 0.477101577333725 0.568260463256902 0.567069033814834 0.00446062678443318 0.208434606527921 -1.79496686614966 0.76676756924779 0.92742178365916 -0.610566549605752 -1.74909488306546 0.181246035846346 0.82264394199555 2.02238185567701 0.353618147548311 -0.47126987847105 0.636481701382438 0.223429320117248 1.08136511121894 -1.05736958997985 1.84562823109126 -0.429094095667191 0.618608274657146 0.247975274547418 -0.217869401539552 1.48727224064450 -0.617543115991768 -0.0909054319510635 0.338830181816216 -0.990615527768609 0.870530546239463 -1.03687971398727 0.841055853937262 0.179483428262213 0.881461944243476 -1.38097765844285 1.92267406983347 0.547710045260839 0.341989336151173 0.896142007909141 -0.635507038774373 0.142328479963134 -0.0310989662914858 0.812304064080694 -1.15028117702781 -0.716532056926539 -0.735751043431918 0.579701881257419 -2.61834894525991 1.66945930427529 -0.654114034894736 -0.321521831278575 -0.592894099347906 -1.69584746769977 -1.07873525851417 -0.63238157398793 -0.738749479401664 -0.290595808195841 -0.559070175537799 -0.789725074338443 0.584170919160221 1.23933319706663 -1.48167869736054 -1.33088977982083 0.00455670283082064 -0.645683372580236 0.581779286086208 0.0142522905437348 0.00385889127769466 -0.851294385118892 0.796265425182402 -1.09384224989052 -2.11113235688167 1.73039074785106 1.51002696988282 -0.718750727060264 -0.143083336203176 -0.967167932906792 -0.900146730915453 1.24122209323561 1.03890190634824 -0.235261694540777 0.0773585350157889 -0.180886079950629 -0.647133871891485 1.68802426753767 0.777337899483706 -0.586687984839497 -0.601006074311206 1.75528551655149 -0.30785537758525 0.0969377987649744 0.785388982352186 -1.80189996207841 | |
Tables (Output of Computation) | |
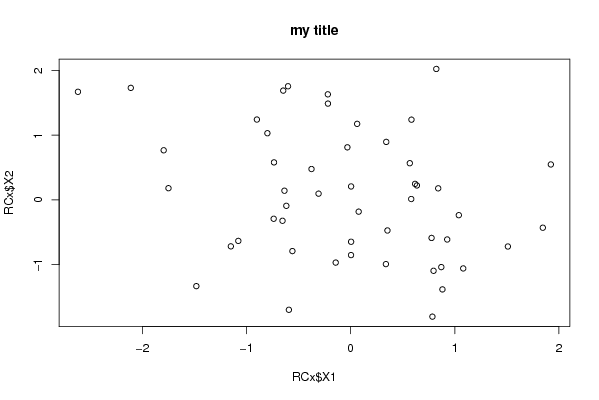
> title = 'my title'


> {
+     plot(RCx$X1, RCx$X2, main = title)
+     res <- cor.test(RCx$X1, RCx$X2)
+     print(res)
+ }

	Pearson's product-moment correlation

data:  RCx$X1 and RCx$X2
t = -2.1283, df = 48, p-value = 0.03847
alternative hypothesis: true correlation is not equal to 0
95 percent confidence interval:
 -0.52878022 -0.01666863
sample estimates:
       cor
-0.2936539
| |
Figures (Output of Computation) | |
Input Parameters & R Code | |
| Parameters (Session): | |
| par1 = 'mytitle' ; | |
| Parameters (R input): | |
| R code (body of R function): | |
{ | |