Free Statistics
of Irreproducible Research!
Description of Statistical Computation | |||||||||||||||||||||||||||||||||
|---|---|---|---|---|---|---|---|---|---|---|---|---|---|---|---|---|---|---|---|---|---|---|---|---|---|---|---|---|---|---|---|---|---|
| Author's title | mean versus median - werkloosheid australie - Magali van de Wildebergh 2MAR... | ||||||||||||||||||||||||||||||||
| Author | *Unverified author* | ||||||||||||||||||||||||||||||||
| R Software Module | rwasp_meanversusmedian.wasp | ||||||||||||||||||||||||||||||||
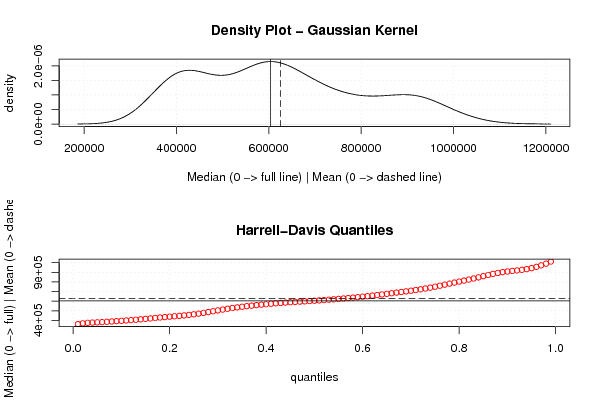
| Title produced by software | Mean versus Median | ||||||||||||||||||||||||||||||||
| Date of computation | Wed, 22 Apr 2009 07:53:05 -0600 | ||||||||||||||||||||||||||||||||
| Cite this page as follows | Statistical Computations at FreeStatistics.org, Office for Research Development and Education, URL https://freestatistics.org/blog/index.php?v=date/2009/Apr/22/t12404084338qhtveykhdf9cl8.htm/, Retrieved Fri, 16 Jan 2026 10:35:01 +0000 | ||||||||||||||||||||||||||||||||
| Statistical Computations at FreeStatistics.org, Office for Research Development and Education, URL https://freestatistics.org/blog/index.php?pk=39268, Retrieved Fri, 16 Jan 2026 10:35:01 +0000 | |||||||||||||||||||||||||||||||||
| QR Codes: | |||||||||||||||||||||||||||||||||
|
| |||||||||||||||||||||||||||||||||
| Original text written by user: | |||||||||||||||||||||||||||||||||
| IsPrivate? | No (this computation is public) | ||||||||||||||||||||||||||||||||
| User-defined keywords | |||||||||||||||||||||||||||||||||
| Estimated Impact | 384 | ||||||||||||||||||||||||||||||||
Tree of Dependent Computations | |||||||||||||||||||||||||||||||||
| Family? (F = Feedback message, R = changed R code, M = changed R Module, P = changed Parameters, D = changed Data) | |||||||||||||||||||||||||||||||||
| - [Mean versus Median] [mean versus media...] [2009-04-22 13:53:05] [946afef1f31655e4e01d6b8ef4c25a2b] [Current] | |||||||||||||||||||||||||||||||||
| Feedback Forum | |||||||||||||||||||||||||||||||||
Post a new message | |||||||||||||||||||||||||||||||||
Dataset | |||||||||||||||||||||||||||||||||
| Dataseries X: | |||||||||||||||||||||||||||||||||
428800 424800 403400 398400 393500 380500 398300 387300 370400 372800 444600 449900 458100 424800 420600 400100 393000 387100 377500 400400 391400 363600 431000 441700 448500 415600 408000 416600 409300 387600 394500 407600 378500 359600 435700 433800 427700 413300 379500 379300 353700 378200 380600 394000 374000 375000 437600 443900 488800 463900 440000 453800 451600 453400 461400 509100 540600 555100 677400 694600 750100 733900 709300 720500 693200 687200 686800 720900 653100 624700 690000 717800 736500 699900 675600 635600 632500 594900 604000 620800 578400 571200 627400 657700 674100 672800 615300 609100 607600 566900 572700 589200 534800 543100 591100 624800 665300 642600 608700 594500 563800 596100 597600 633100 591000 584200 655800 670700 699700 712900 652000 635100 603100 610100 602000 597600 585400 567100 620600 646200 644800 645200 644800 593000 569100 518800 538700 554600 507900 488400 563300 592400 598100 546300 516100 518500 477400 483400 469400 501300 457400 446700 501900 550400 593700 548900 534200 550500 541800 569300 587400 627700 607000 629500 704600 767700 812200 824600 856300 812200 764100 801700 806000 867200 801600 817500 920900 959700 997700 949100 910900 920400 914200 926300 906400 926100 902500 895300 979900 1009700 1043800 979800 921600 923500 914500 891700 916000 931700 902400 893700 941500 980100 1006900 949200 883200 849900 839200 803900 797900 830800 753300 764100 807600 853700 886200 815700 743000 753600 724800 709600 721900 | |||||||||||||||||||||||||||||||||
Tables (Output of Computation) | |||||||||||||||||||||||||||||||||
| |||||||||||||||||||||||||||||||||
Figures (Output of Computation) | |||||||||||||||||||||||||||||||||
Input Parameters & R Code | |||||||||||||||||||||||||||||||||
| Parameters (Session): | |||||||||||||||||||||||||||||||||
| Parameters (R input): | |||||||||||||||||||||||||||||||||
| R code (references can be found in the software module): | |||||||||||||||||||||||||||||||||
library(Hmisc) | |||||||||||||||||||||||||||||||||


