Free Statistics
of Irreproducible Research!
Description of Statistical Computation | |||||||||||||||||||||||||||||||||||||||||
|---|---|---|---|---|---|---|---|---|---|---|---|---|---|---|---|---|---|---|---|---|---|---|---|---|---|---|---|---|---|---|---|---|---|---|---|---|---|---|---|---|---|
| Author's title | |||||||||||||||||||||||||||||||||||||||||
| Author | *Unverified author* | ||||||||||||||||||||||||||||||||||||||||
| R Software Module | rwasp_univariatedataseries.wasp | ||||||||||||||||||||||||||||||||||||||||
| Title produced by software | Univariate Data Series | ||||||||||||||||||||||||||||||||||||||||
| Date of computation | Tue, 23 Sep 2008 03:31:20 -0600 | ||||||||||||||||||||||||||||||||||||||||
| Cite this page as follows | Statistical Computations at FreeStatistics.org, Office for Research Development and Education, URL https://freestatistics.org/blog/index.php?v=date/2008/Sep/23/t1222162521u79wmz3hcm5zlqc.htm/, Retrieved Mon, 15 Sep 2025 20:46:24 +0000 | ||||||||||||||||||||||||||||||||||||||||
| Statistical Computations at FreeStatistics.org, Office for Research Development and Education, URL https://freestatistics.org/blog/index.php?pk=14742, Retrieved Mon, 15 Sep 2025 20:46:24 +0000 | |||||||||||||||||||||||||||||||||||||||||
| QR Codes: | |||||||||||||||||||||||||||||||||||||||||
|
| |||||||||||||||||||||||||||||||||||||||||
| Original text written by user: | |||||||||||||||||||||||||||||||||||||||||
| IsPrivate? | No (this computation is public) | ||||||||||||||||||||||||||||||||||||||||
| User-defined keywords | |||||||||||||||||||||||||||||||||||||||||
| Estimated Impact | 425 | ||||||||||||||||||||||||||||||||||||||||
Tree of Dependent Computations | |||||||||||||||||||||||||||||||||||||||||
| Family? (F = Feedback message, R = changed R code, M = changed R Module, P = changed Parameters, D = changed Data) | |||||||||||||||||||||||||||||||||||||||||
| - [Univariate Data Series] [Gemiddelde prijs ...] [2008-09-23 09:31:20] [d41d8cd98f00b204e9800998ecf8427e] [Current] - RMP [Histogram] [Frequentietabel -...] [2008-09-30 09:32:32] [74be16979710d4c4e7c6647856088456] - RMPD [Quartiles] [Kwartielen - gemi...] [2008-10-06 15:39:26] [74be16979710d4c4e7c6647856088456] - RMPD [Notched Boxplots] [Boxplot - gemidde...] [2008-10-06 16:51:51] [74be16979710d4c4e7c6647856088456] - D [Histogram] [Histogram Prijs r...] [2009-08-03 19:00:31] [b61406873bd841e2047c054f7ebec102] - PD [Histogram] [Gemiddelde prijs ...] [2009-08-03 19:05:38] [b61406873bd841e2047c054f7ebec102] - D [Histogram] [Histogram gemidde...] [2009-08-03 19:09:27] [b61406873bd841e2047c054f7ebec102] - RMP [Kernel Density Estimation] [Dichtheidsgrafiek...] [2009-08-03 19:23:58] [b61406873bd841e2047c054f7ebec102] - RMPD [Quartiles] [Quartielen maximu...] [2009-08-03 19:31:33] [b61406873bd841e2047c054f7ebec102] - RMP [Kernel Density Estimation] [Dichtheidsgrafiek...] [2008-09-30 09:49:23] [74be16979710d4c4e7c6647856088456] - RMPD [Exponential Smoothing] [Exponential Smoot...] [2009-01-16 08:50:06] [74be16979710d4c4e7c6647856088456] - RMPD [Exponential Smoothing] [Exponential Smoot...] [2009-01-16 08:57:26] [74be16979710d4c4e7c6647856088456] - PD [Univariate Data Series] [Gemiddelde prijs ...] [2009-07-08 13:22:44] [f85cc8f00ef4b762f0a6fdfddc793773] - RMPD [Histogram] [Gemiddelde prijs ...] [2009-07-08 13:28:13] [f85cc8f00ef4b762f0a6fdfddc793773] - P [Univariate Data Series] [Gemiddelde prijs ...] [2009-07-08 13:31:33] [f85cc8f00ef4b762f0a6fdfddc793773] | |||||||||||||||||||||||||||||||||||||||||
| Feedback Forum | |||||||||||||||||||||||||||||||||||||||||
Post a new message | |||||||||||||||||||||||||||||||||||||||||
Dataset | |||||||||||||||||||||||||||||||||||||||||
| Dataseries X: | |||||||||||||||||||||||||||||||||||||||||
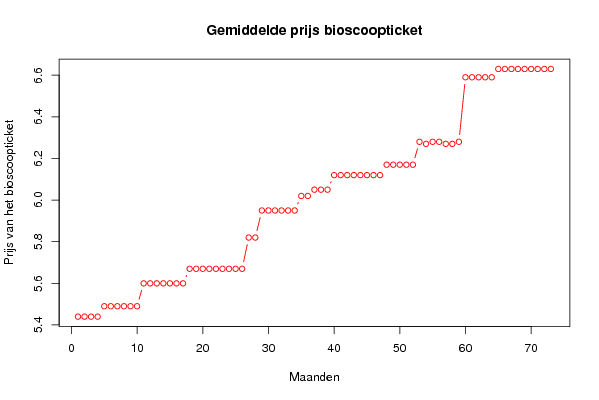
5,44 5,44 5,44 5,44 5,49 5,49 5,49 5,49 5,49 5,49 5,6 5,6 5,6 5,6 5,6 5,6 5,6 5,67 5,67 5,67 5,67 5,67 5,67 5,67 5,67 5,67 5,82 5,82 5,95 5,95 5,95 5,95 5,95 5,95 6,02 6,02 6,05 6,05 6,05 6,12 6,12 6,12 6,12 6,12 6,12 6,12 6,12 6,17 6,17 6,17 6,17 6,17 6,28 6,27 6,28 6,28 6,27 6,27 6,28 6,59 6,59 6,59 6,59 6,59 6,63 6,63 6,63 6,63 6,63 6,63 6,63 6,63 6,63 | |||||||||||||||||||||||||||||||||||||||||
Tables (Output of Computation) | |||||||||||||||||||||||||||||||||||||||||
| |||||||||||||||||||||||||||||||||||||||||
Figures (Output of Computation) | |||||||||||||||||||||||||||||||||||||||||
Input Parameters & R Code | |||||||||||||||||||||||||||||||||||||||||
| Parameters (Session): | |||||||||||||||||||||||||||||||||||||||||
| par1 = Gemiddelde prijs bioscoopticket 1999 - 2005 ; par2 = http://www.nbb.be/belgostat/PresentationLinker?TableId=151000015&Lang=N ; | |||||||||||||||||||||||||||||||||||||||||
| Parameters (R input): | |||||||||||||||||||||||||||||||||||||||||
| par1 = Gemiddelde prijs bioscoopticket 1999 - 2005 ; par2 = http://www.nbb.be/belgostat/PresentationLinker?TableId=151000015&Lang=N ; par3 = ; | |||||||||||||||||||||||||||||||||||||||||
| R code (references can be found in the software module): | |||||||||||||||||||||||||||||||||||||||||
bitmap(file='test1.png') | |||||||||||||||||||||||||||||||||||||||||