Free Statistics

of Irreproducible Research!

Author's title

Author*Unverified author*
R Software Modulerwasp_multipleregression.wasp
Title produced by softwareMultiple Regression
Date of computationThu, 27 Nov 2008 06:33:58 -0700
Cite this page as followsStatistical Computations at FreeStatistics.org, Office for Research Development and Education, URL https://freestatistics.org/blog/index.php?v=date/2008/Nov/27/t1227793280rwh1ubhoop4sq2b.htm/, Retrieved Mon, 20 May 2024 10:31:03 +0000
Statistical Computations at FreeStatistics.org, Office for Research Development and Education, URL https://freestatistics.org/blog/index.php?pk=25806, Retrieved Mon, 20 May 2024 10:31:03 +0000
QR Codes:

Original text written by user:
IsPrivate?No (this computation is public)
User-defined keywords
Estimated Impact148
Family? (F = Feedback message, R = changed R code, M = changed R Module, P = changed Parameters, D = changed Data)
F     [Multiple Regression] [] [2007-11-19 19:55:31] [b731da8b544846036771bbf9bf2f34ce]
F    D    [Multiple Regression] [workshop 3 eigen ...] [2008-11-27 13:33:58] [d41d8cd98f00b204e9800998ecf8427e] [Current]
Feedback Forum
2008-12-01 16:52:08 [Kevin Vermeiren] [reply
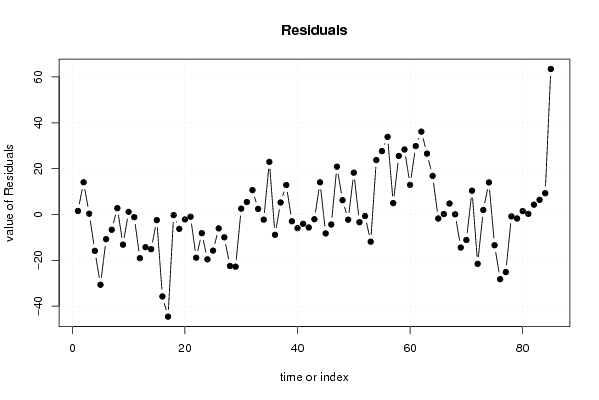
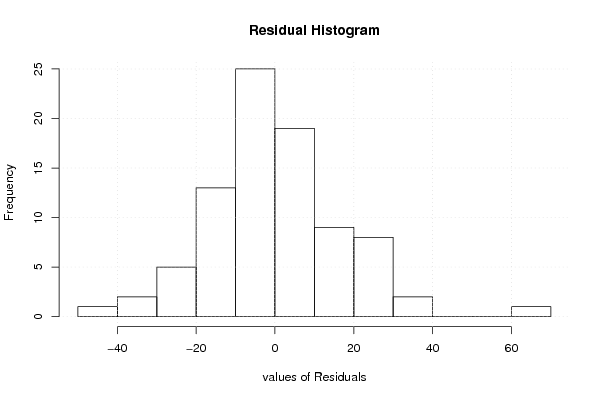
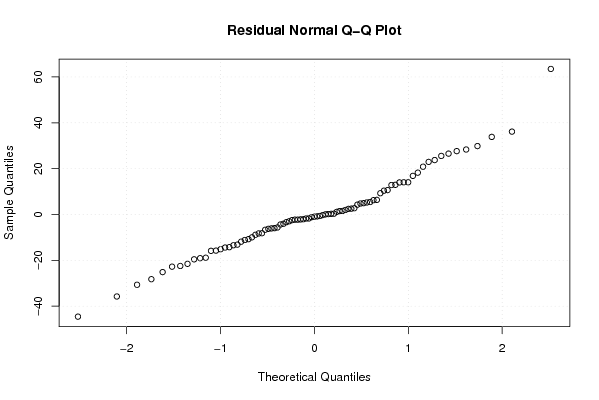
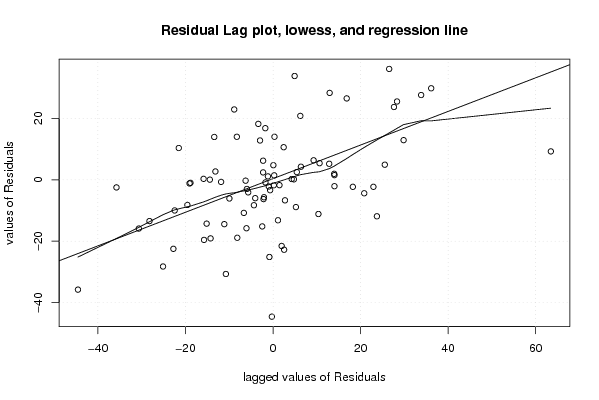
De student doet er hier goed aan de reeks te gaan bekijken aangezien er geen noemenswaardige gebeurtenis werd gevonden. Bijgevolg is het mogelijk dat er iets op valt uit de grafiek. Dit was het geval bij index 39, vanaf toen lagen de waarden duidelijk hoger. Uiteraard is dit nuttig om te onderzoeken. Na deze vaststelling werd zeer terecht de waarde 0 toegekend aan de indexen tot en met nr 38, de overige kregen een 1 toegekend. Een positief punt hier is dat de student heeft nagedacht over een modelijke verklaring.

Post a new message
Dataseries X:
92,7	0
105,2	0
91,5	0
75,3	0
60,5	0
80,4	0
84,5	0
93,9	0
78	0
92,3	0
90	0
72,1	0
76,9	0
76	0
88,7	0
55,4	0
46,6	0
90,9	0
84,9	0
89	0
90,2	0
72,3	0
83	0
71,6	0
75,4	0
85,1	0
81,2	0
68,7	0
68,4	0
93,7	0
96,6	0
101,8	0
93,6	0
88,9	0
114,1	0
82,3	0
96,4	0
104	0
88,2	0
85,2	0
87,1	0
85,5	0
89,1	0
105,2	0
82,9	0
86,8	0
112	0
97,4	0
88,9	0
109,4	0
87,8	0
90,5	0
79,3	0
114,9	0
118,8	0
125	0
96,1	0
116,7	0
119,5	0
104,1	0
121	0
127,3	0
117,7	0
108	0
89,4	0
137,4	1
142	1
137,3	1
122,8	1
126,1	1
147,6	1
115,7	1
139,2	1
151,2	1
123,8	1
109	1
112,1	1
136,4	1
135,5	1
138,7	1
137,5	1
141,5	1
143,6	1
146,5	1
200,7	1


Summary of computational transaction
Raw Inputview raw input (R code)
Raw Outputview raw output of R engine
Computing time3 seconds
R Server'Gwilym Jenkins' @ 72.249.127.135

\begin{tabular}{lllllllll}
\hline
Summary of computational transaction \tabularnewline
Raw Input & view raw input (R code)  \tabularnewline
Raw Output & view raw output of R engine  \tabularnewline
Computing time & 3 seconds \tabularnewline
R Server & 'Gwilym Jenkins' @ 72.249.127.135 \tabularnewline
\hline
\end{tabular}
%Source: https://freestatistics.org/blog/index.php?pk=25806&T=0

[TABLE]
[ROW][C]Summary of computational transaction[/C][/ROW]
[ROW][C]Raw Input[/C][C]view raw input (R code) [/C][/ROW]
[ROW][C]Raw Output[/C][C]view raw output of R engine [/C][/ROW]
[ROW][C]Computing time[/C][C]3 seconds[/C][/ROW]
[ROW][C]R Server[/C][C]'Gwilym Jenkins' @ 72.249.127.135[/C][/ROW]
[/TABLE]
Source: https://freestatistics.org/blog/index.php?pk=25806&T=0

Globally Unique Identifier (entire table): ba.freestatistics.org/blog/index.php?pk=25806&T=0

As an alternative you can also use a QR Code:  

The GUIDs for individual cells are displayed in the table below:

Summary of computational transaction
Raw Inputview raw input (R code)
Raw Outputview raw output of R engine
Computing time3 seconds
R Server'Gwilym Jenkins' @ 72.249.127.135


Multiple Linear Regression - Estimated Regression Equation
L&S[t] = + 91.1676923076923 + 46.0623076923077D[t] + e[t]

\begin{tabular}{lllllllll}
\hline
Multiple Linear Regression - Estimated Regression Equation \tabularnewline
L&S[t] =  +  91.1676923076923 +  46.0623076923077D[t]  + e[t] \tabularnewline
\hline
\end{tabular}
%Source: https://freestatistics.org/blog/index.php?pk=25806&T=1

[TABLE]
[ROW][C]Multiple Linear Regression - Estimated Regression Equation[/C][/ROW]
[ROW][C]L&S[t] =  +  91.1676923076923 +  46.0623076923077D[t]  + e[t][/C][/ROW]
[/TABLE]
Source: https://freestatistics.org/blog/index.php?pk=25806&T=1

Globally Unique Identifier (entire table): ba.freestatistics.org/blog/index.php?pk=25806&T=1

As an alternative you can also use a QR Code:  

The GUIDs for individual cells are displayed in the table below:

Multiple Linear Regression - Estimated Regression Equation
L&S[t] = + 91.1676923076923 + 46.0623076923077D[t] + e[t]


Multiple Linear Regression - Ordinary Least Squares
VariableParameterS.D.T-STATH0: parameter = 02-tail p-value1-tail p-value
(Intercept)91.16769230769232.13452842.710900
D46.06230769230774.40044210.467700

\begin{tabular}{lllllllll}
\hline
Multiple Linear Regression - Ordinary Least Squares \tabularnewline
Variable & Parameter & S.D. & T-STATH0: parameter = 0 & 2-tail p-value & 1-tail p-value \tabularnewline
(Intercept) & 91.1676923076923 & 2.134528 & 42.7109 & 0 & 0 \tabularnewline
D & 46.0623076923077 & 4.400442 & 10.4677 & 0 & 0 \tabularnewline
\hline
\end{tabular}
%Source: https://freestatistics.org/blog/index.php?pk=25806&T=2

[TABLE]
[ROW][C]Multiple Linear Regression - Ordinary Least Squares[/C][/ROW]
[ROW][C]Variable[/C][C]Parameter[/C][C]S.D.[/C][C]T-STATH0: parameter = 0[/C][C]2-tail p-value[/C][C]1-tail p-value[/C][/ROW]
[ROW][C](Intercept)[/C][C]91.1676923076923[/C][C]2.134528[/C][C]42.7109[/C][C]0[/C][C]0[/C][/ROW]
[ROW][C]D[/C][C]46.0623076923077[/C][C]4.400442[/C][C]10.4677[/C][C]0[/C][C]0[/C][/ROW]
[/TABLE]
Source: https://freestatistics.org/blog/index.php?pk=25806&T=2

Globally Unique Identifier (entire table): ba.freestatistics.org/blog/index.php?pk=25806&T=2

As an alternative you can also use a QR Code:  

The GUIDs for individual cells are displayed in the table below:

Multiple Linear Regression - Ordinary Least Squares
VariableParameterS.D.T-STATH0: parameter = 02-tail p-value1-tail p-value
(Intercept)91.16769230769232.13452842.710900
D46.06230769230774.40044210.467700


Multiple Linear Regression - Regression Statistics
Multiple R0.754315567030793
R-squared0.568991974664987
Adjusted R-squared0.563799106889866
F-TEST (value)109.571820293801
F-TEST (DF numerator)1
F-TEST (DF denominator)83
p-value0
Multiple Linear Regression - Residual Statistics
Residual Standard Deviation17.2091122380628
Sum Squared Residuals24580.7441538462

\begin{tabular}{lllllllll}
\hline
Multiple Linear Regression - Regression Statistics \tabularnewline
Multiple R & 0.754315567030793 \tabularnewline
R-squared & 0.568991974664987 \tabularnewline
Adjusted R-squared & 0.563799106889866 \tabularnewline
F-TEST (value) & 109.571820293801 \tabularnewline
F-TEST (DF numerator) & 1 \tabularnewline
F-TEST (DF denominator) & 83 \tabularnewline
p-value & 0 \tabularnewline
Multiple Linear Regression - Residual Statistics \tabularnewline
Residual Standard Deviation & 17.2091122380628 \tabularnewline
Sum Squared Residuals & 24580.7441538462 \tabularnewline
\hline
\end{tabular}
%Source: https://freestatistics.org/blog/index.php?pk=25806&T=3

[TABLE]
[ROW][C]Multiple Linear Regression - Regression Statistics[/C][/ROW]
[ROW][C]Multiple R[/C][C]0.754315567030793[/C][/ROW]
[ROW][C]R-squared[/C][C]0.568991974664987[/C][/ROW]
[ROW][C]Adjusted R-squared[/C][C]0.563799106889866[/C][/ROW]
[ROW][C]F-TEST (value)[/C][C]109.571820293801[/C][/ROW]
[ROW][C]F-TEST (DF numerator)[/C][C]1[/C][/ROW]
[ROW][C]F-TEST (DF denominator)[/C][C]83[/C][/ROW]
[ROW][C]p-value[/C][C]0[/C][/ROW]
[ROW][C]Multiple Linear Regression - Residual Statistics[/C][/ROW]
[ROW][C]Residual Standard Deviation[/C][C]17.2091122380628[/C][/ROW]
[ROW][C]Sum Squared Residuals[/C][C]24580.7441538462[/C][/ROW]
[/TABLE]
Source: https://freestatistics.org/blog/index.php?pk=25806&T=3

Globally Unique Identifier (entire table): ba.freestatistics.org/blog/index.php?pk=25806&T=3

As an alternative you can also use a QR Code:  

The GUIDs for individual cells are displayed in the table below:

Multiple Linear Regression - Regression Statistics
Multiple R0.754315567030793
R-squared0.568991974664987
Adjusted R-squared0.563799106889866
F-TEST (value)109.571820293801
F-TEST (DF numerator)1
F-TEST (DF denominator)83
p-value0
Multiple Linear Regression - Residual Statistics
Residual Standard Deviation17.2091122380628
Sum Squared Residuals24580.7441538462


Multiple Linear Regression - Actuals, Interpolation, and Residuals
Time or IndexActualsInterpolationForecastResidualsPrediction Error
192.791.16769230769251.53230769230753
2105.291.167692307692314.0323076923077
391.591.16769230769230.332307692307695
475.391.1676923076923-15.8676923076923
560.591.1676923076923-30.6676923076923
680.491.1676923076923-10.7676923076923
784.591.1676923076923-6.6676923076923
893.991.16769230769232.7323076923077
97891.1676923076923-13.1676923076923
1092.391.16769230769231.13230769230769
119091.1676923076923-1.16769230769230
1272.191.1676923076923-19.0676923076923
1376.991.1676923076923-14.2676923076923
147691.1676923076923-15.1676923076923
1588.791.1676923076923-2.4676923076923
1655.491.1676923076923-35.7676923076923
1746.691.1676923076923-44.5676923076923
1890.991.1676923076923-0.267692307692299
1984.991.1676923076923-6.2676923076923
208991.1676923076923-2.16769230769230
2190.291.1676923076923-0.967692307692302
2272.391.1676923076923-18.8676923076923
238391.1676923076923-8.1676923076923
2471.691.1676923076923-19.5676923076923
2575.491.1676923076923-15.7676923076923
2685.191.1676923076923-6.06769230769231
2781.291.1676923076923-9.9676923076923
2868.791.1676923076923-22.4676923076923
2968.491.1676923076923-22.7676923076923
3093.791.16769230769232.5323076923077
3196.691.16769230769235.43230769230769
32101.891.167692307692310.6323076923077
3393.691.16769230769232.43230769230769
3488.991.1676923076923-2.2676923076923
35114.191.167692307692322.9323076923077
3682.391.1676923076923-8.8676923076923
3796.491.16769230769235.2323076923077
3810491.167692307692312.8323076923077
3988.291.1676923076923-2.9676923076923
4085.291.1676923076923-5.9676923076923
4187.191.1676923076923-4.06769230769231
4285.591.1676923076923-5.6676923076923
4389.191.1676923076923-2.06769230769231
44105.291.167692307692314.0323076923077
4582.991.1676923076923-8.2676923076923
4686.891.1676923076923-4.36769230769231
4711291.167692307692320.8323076923077
4897.491.16769230769236.2323076923077
4988.991.1676923076923-2.2676923076923
50109.491.167692307692318.2323076923077
5187.891.1676923076923-3.36769230769231
5290.591.1676923076923-0.667692307692304
5379.391.1676923076923-11.8676923076923
54114.991.167692307692323.7323076923077
55118.891.167692307692327.6323076923077
5612591.167692307692333.8323076923077
5796.191.16769230769234.93230769230769
58116.791.167692307692325.5323076923077
59119.591.167692307692328.3323076923077
60104.191.167692307692312.9323076923077
6112191.167692307692329.8323076923077
62127.391.167692307692336.1323076923077
63117.791.167692307692326.5323076923077
6410891.167692307692316.8323076923077
6589.491.1676923076923-1.7676923076923
66137.4137.230.170000000000009
67142137.234.77
68137.3137.230.0700000000000147
69122.8137.23-14.43
70126.1137.23-11.13
71147.6137.2310.37
72115.7137.23-21.53
73139.2137.231.96999999999999
74151.2137.2313.97
75123.8137.23-13.43
76109137.23-28.23
77112.1137.23-25.13
78136.4137.23-0.829999999999991
79135.5137.23-1.73000000000000
80138.7137.231.46999999999999
81137.5137.230.270000000000003
82141.5137.234.27
83143.6137.236.37
84146.5137.239.27
85200.7137.2363.47

\begin{tabular}{lllllllll}
\hline
Multiple Linear Regression - Actuals, Interpolation, and Residuals \tabularnewline
Time or Index & Actuals & InterpolationForecast & ResidualsPrediction Error \tabularnewline
1 & 92.7 & 91.1676923076925 & 1.53230769230753 \tabularnewline
2 & 105.2 & 91.1676923076923 & 14.0323076923077 \tabularnewline
3 & 91.5 & 91.1676923076923 & 0.332307692307695 \tabularnewline
4 & 75.3 & 91.1676923076923 & -15.8676923076923 \tabularnewline
5 & 60.5 & 91.1676923076923 & -30.6676923076923 \tabularnewline
6 & 80.4 & 91.1676923076923 & -10.7676923076923 \tabularnewline
7 & 84.5 & 91.1676923076923 & -6.6676923076923 \tabularnewline
8 & 93.9 & 91.1676923076923 & 2.7323076923077 \tabularnewline
9 & 78 & 91.1676923076923 & -13.1676923076923 \tabularnewline
10 & 92.3 & 91.1676923076923 & 1.13230769230769 \tabularnewline
11 & 90 & 91.1676923076923 & -1.16769230769230 \tabularnewline
12 & 72.1 & 91.1676923076923 & -19.0676923076923 \tabularnewline
13 & 76.9 & 91.1676923076923 & -14.2676923076923 \tabularnewline
14 & 76 & 91.1676923076923 & -15.1676923076923 \tabularnewline
15 & 88.7 & 91.1676923076923 & -2.4676923076923 \tabularnewline
16 & 55.4 & 91.1676923076923 & -35.7676923076923 \tabularnewline
17 & 46.6 & 91.1676923076923 & -44.5676923076923 \tabularnewline
18 & 90.9 & 91.1676923076923 & -0.267692307692299 \tabularnewline
19 & 84.9 & 91.1676923076923 & -6.2676923076923 \tabularnewline
20 & 89 & 91.1676923076923 & -2.16769230769230 \tabularnewline
21 & 90.2 & 91.1676923076923 & -0.967692307692302 \tabularnewline
22 & 72.3 & 91.1676923076923 & -18.8676923076923 \tabularnewline
23 & 83 & 91.1676923076923 & -8.1676923076923 \tabularnewline
24 & 71.6 & 91.1676923076923 & -19.5676923076923 \tabularnewline
25 & 75.4 & 91.1676923076923 & -15.7676923076923 \tabularnewline
26 & 85.1 & 91.1676923076923 & -6.06769230769231 \tabularnewline
27 & 81.2 & 91.1676923076923 & -9.9676923076923 \tabularnewline
28 & 68.7 & 91.1676923076923 & -22.4676923076923 \tabularnewline
29 & 68.4 & 91.1676923076923 & -22.7676923076923 \tabularnewline
30 & 93.7 & 91.1676923076923 & 2.5323076923077 \tabularnewline
31 & 96.6 & 91.1676923076923 & 5.43230769230769 \tabularnewline
32 & 101.8 & 91.1676923076923 & 10.6323076923077 \tabularnewline
33 & 93.6 & 91.1676923076923 & 2.43230769230769 \tabularnewline
34 & 88.9 & 91.1676923076923 & -2.2676923076923 \tabularnewline
35 & 114.1 & 91.1676923076923 & 22.9323076923077 \tabularnewline
36 & 82.3 & 91.1676923076923 & -8.8676923076923 \tabularnewline
37 & 96.4 & 91.1676923076923 & 5.2323076923077 \tabularnewline
38 & 104 & 91.1676923076923 & 12.8323076923077 \tabularnewline
39 & 88.2 & 91.1676923076923 & -2.9676923076923 \tabularnewline
40 & 85.2 & 91.1676923076923 & -5.9676923076923 \tabularnewline
41 & 87.1 & 91.1676923076923 & -4.06769230769231 \tabularnewline
42 & 85.5 & 91.1676923076923 & -5.6676923076923 \tabularnewline
43 & 89.1 & 91.1676923076923 & -2.06769230769231 \tabularnewline
44 & 105.2 & 91.1676923076923 & 14.0323076923077 \tabularnewline
45 & 82.9 & 91.1676923076923 & -8.2676923076923 \tabularnewline
46 & 86.8 & 91.1676923076923 & -4.36769230769231 \tabularnewline
47 & 112 & 91.1676923076923 & 20.8323076923077 \tabularnewline
48 & 97.4 & 91.1676923076923 & 6.2323076923077 \tabularnewline
49 & 88.9 & 91.1676923076923 & -2.2676923076923 \tabularnewline
50 & 109.4 & 91.1676923076923 & 18.2323076923077 \tabularnewline
51 & 87.8 & 91.1676923076923 & -3.36769230769231 \tabularnewline
52 & 90.5 & 91.1676923076923 & -0.667692307692304 \tabularnewline
53 & 79.3 & 91.1676923076923 & -11.8676923076923 \tabularnewline
54 & 114.9 & 91.1676923076923 & 23.7323076923077 \tabularnewline
55 & 118.8 & 91.1676923076923 & 27.6323076923077 \tabularnewline
56 & 125 & 91.1676923076923 & 33.8323076923077 \tabularnewline
57 & 96.1 & 91.1676923076923 & 4.93230769230769 \tabularnewline
58 & 116.7 & 91.1676923076923 & 25.5323076923077 \tabularnewline
59 & 119.5 & 91.1676923076923 & 28.3323076923077 \tabularnewline
60 & 104.1 & 91.1676923076923 & 12.9323076923077 \tabularnewline
61 & 121 & 91.1676923076923 & 29.8323076923077 \tabularnewline
62 & 127.3 & 91.1676923076923 & 36.1323076923077 \tabularnewline
63 & 117.7 & 91.1676923076923 & 26.5323076923077 \tabularnewline
64 & 108 & 91.1676923076923 & 16.8323076923077 \tabularnewline
65 & 89.4 & 91.1676923076923 & -1.7676923076923 \tabularnewline
66 & 137.4 & 137.23 & 0.170000000000009 \tabularnewline
67 & 142 & 137.23 & 4.77 \tabularnewline
68 & 137.3 & 137.23 & 0.0700000000000147 \tabularnewline
69 & 122.8 & 137.23 & -14.43 \tabularnewline
70 & 126.1 & 137.23 & -11.13 \tabularnewline
71 & 147.6 & 137.23 & 10.37 \tabularnewline
72 & 115.7 & 137.23 & -21.53 \tabularnewline
73 & 139.2 & 137.23 & 1.96999999999999 \tabularnewline
74 & 151.2 & 137.23 & 13.97 \tabularnewline
75 & 123.8 & 137.23 & -13.43 \tabularnewline
76 & 109 & 137.23 & -28.23 \tabularnewline
77 & 112.1 & 137.23 & -25.13 \tabularnewline
78 & 136.4 & 137.23 & -0.829999999999991 \tabularnewline
79 & 135.5 & 137.23 & -1.73000000000000 \tabularnewline
80 & 138.7 & 137.23 & 1.46999999999999 \tabularnewline
81 & 137.5 & 137.23 & 0.270000000000003 \tabularnewline
82 & 141.5 & 137.23 & 4.27 \tabularnewline
83 & 143.6 & 137.23 & 6.37 \tabularnewline
84 & 146.5 & 137.23 & 9.27 \tabularnewline
85 & 200.7 & 137.23 & 63.47 \tabularnewline
\hline
\end{tabular}
%Source: https://freestatistics.org/blog/index.php?pk=25806&T=4

[TABLE]
[ROW][C]Multiple Linear Regression - Actuals, Interpolation, and Residuals[/C][/ROW]
[ROW][C]Time or Index[/C][C]Actuals[/C][C]InterpolationForecast[/C][C]ResidualsPrediction Error[/C][/ROW]
[ROW][C]1[/C][C]92.7[/C][C]91.1676923076925[/C][C]1.53230769230753[/C][/ROW]
[ROW][C]2[/C][C]105.2[/C][C]91.1676923076923[/C][C]14.0323076923077[/C][/ROW]
[ROW][C]3[/C][C]91.5[/C][C]91.1676923076923[/C][C]0.332307692307695[/C][/ROW]
[ROW][C]4[/C][C]75.3[/C][C]91.1676923076923[/C][C]-15.8676923076923[/C][/ROW]
[ROW][C]5[/C][C]60.5[/C][C]91.1676923076923[/C][C]-30.6676923076923[/C][/ROW]
[ROW][C]6[/C][C]80.4[/C][C]91.1676923076923[/C][C]-10.7676923076923[/C][/ROW]
[ROW][C]7[/C][C]84.5[/C][C]91.1676923076923[/C][C]-6.6676923076923[/C][/ROW]
[ROW][C]8[/C][C]93.9[/C][C]91.1676923076923[/C][C]2.7323076923077[/C][/ROW]
[ROW][C]9[/C][C]78[/C][C]91.1676923076923[/C][C]-13.1676923076923[/C][/ROW]
[ROW][C]10[/C][C]92.3[/C][C]91.1676923076923[/C][C]1.13230769230769[/C][/ROW]
[ROW][C]11[/C][C]90[/C][C]91.1676923076923[/C][C]-1.16769230769230[/C][/ROW]
[ROW][C]12[/C][C]72.1[/C][C]91.1676923076923[/C][C]-19.0676923076923[/C][/ROW]
[ROW][C]13[/C][C]76.9[/C][C]91.1676923076923[/C][C]-14.2676923076923[/C][/ROW]
[ROW][C]14[/C][C]76[/C][C]91.1676923076923[/C][C]-15.1676923076923[/C][/ROW]
[ROW][C]15[/C][C]88.7[/C][C]91.1676923076923[/C][C]-2.4676923076923[/C][/ROW]
[ROW][C]16[/C][C]55.4[/C][C]91.1676923076923[/C][C]-35.7676923076923[/C][/ROW]
[ROW][C]17[/C][C]46.6[/C][C]91.1676923076923[/C][C]-44.5676923076923[/C][/ROW]
[ROW][C]18[/C][C]90.9[/C][C]91.1676923076923[/C][C]-0.267692307692299[/C][/ROW]
[ROW][C]19[/C][C]84.9[/C][C]91.1676923076923[/C][C]-6.2676923076923[/C][/ROW]
[ROW][C]20[/C][C]89[/C][C]91.1676923076923[/C][C]-2.16769230769230[/C][/ROW]
[ROW][C]21[/C][C]90.2[/C][C]91.1676923076923[/C][C]-0.967692307692302[/C][/ROW]
[ROW][C]22[/C][C]72.3[/C][C]91.1676923076923[/C][C]-18.8676923076923[/C][/ROW]
[ROW][C]23[/C][C]83[/C][C]91.1676923076923[/C][C]-8.1676923076923[/C][/ROW]
[ROW][C]24[/C][C]71.6[/C][C]91.1676923076923[/C][C]-19.5676923076923[/C][/ROW]
[ROW][C]25[/C][C]75.4[/C][C]91.1676923076923[/C][C]-15.7676923076923[/C][/ROW]
[ROW][C]26[/C][C]85.1[/C][C]91.1676923076923[/C][C]-6.06769230769231[/C][/ROW]
[ROW][C]27[/C][C]81.2[/C][C]91.1676923076923[/C][C]-9.9676923076923[/C][/ROW]
[ROW][C]28[/C][C]68.7[/C][C]91.1676923076923[/C][C]-22.4676923076923[/C][/ROW]
[ROW][C]29[/C][C]68.4[/C][C]91.1676923076923[/C][C]-22.7676923076923[/C][/ROW]
[ROW][C]30[/C][C]93.7[/C][C]91.1676923076923[/C][C]2.5323076923077[/C][/ROW]
[ROW][C]31[/C][C]96.6[/C][C]91.1676923076923[/C][C]5.43230769230769[/C][/ROW]
[ROW][C]32[/C][C]101.8[/C][C]91.1676923076923[/C][C]10.6323076923077[/C][/ROW]
[ROW][C]33[/C][C]93.6[/C][C]91.1676923076923[/C][C]2.43230769230769[/C][/ROW]
[ROW][C]34[/C][C]88.9[/C][C]91.1676923076923[/C][C]-2.2676923076923[/C][/ROW]
[ROW][C]35[/C][C]114.1[/C][C]91.1676923076923[/C][C]22.9323076923077[/C][/ROW]
[ROW][C]36[/C][C]82.3[/C][C]91.1676923076923[/C][C]-8.8676923076923[/C][/ROW]
[ROW][C]37[/C][C]96.4[/C][C]91.1676923076923[/C][C]5.2323076923077[/C][/ROW]
[ROW][C]38[/C][C]104[/C][C]91.1676923076923[/C][C]12.8323076923077[/C][/ROW]
[ROW][C]39[/C][C]88.2[/C][C]91.1676923076923[/C][C]-2.9676923076923[/C][/ROW]
[ROW][C]40[/C][C]85.2[/C][C]91.1676923076923[/C][C]-5.9676923076923[/C][/ROW]
[ROW][C]41[/C][C]87.1[/C][C]91.1676923076923[/C][C]-4.06769230769231[/C][/ROW]
[ROW][C]42[/C][C]85.5[/C][C]91.1676923076923[/C][C]-5.6676923076923[/C][/ROW]
[ROW][C]43[/C][C]89.1[/C][C]91.1676923076923[/C][C]-2.06769230769231[/C][/ROW]
[ROW][C]44[/C][C]105.2[/C][C]91.1676923076923[/C][C]14.0323076923077[/C][/ROW]
[ROW][C]45[/C][C]82.9[/C][C]91.1676923076923[/C][C]-8.2676923076923[/C][/ROW]
[ROW][C]46[/C][C]86.8[/C][C]91.1676923076923[/C][C]-4.36769230769231[/C][/ROW]
[ROW][C]47[/C][C]112[/C][C]91.1676923076923[/C][C]20.8323076923077[/C][/ROW]
[ROW][C]48[/C][C]97.4[/C][C]91.1676923076923[/C][C]6.2323076923077[/C][/ROW]
[ROW][C]49[/C][C]88.9[/C][C]91.1676923076923[/C][C]-2.2676923076923[/C][/ROW]
[ROW][C]50[/C][C]109.4[/C][C]91.1676923076923[/C][C]18.2323076923077[/C][/ROW]
[ROW][C]51[/C][C]87.8[/C][C]91.1676923076923[/C][C]-3.36769230769231[/C][/ROW]
[ROW][C]52[/C][C]90.5[/C][C]91.1676923076923[/C][C]-0.667692307692304[/C][/ROW]
[ROW][C]53[/C][C]79.3[/C][C]91.1676923076923[/C][C]-11.8676923076923[/C][/ROW]
[ROW][C]54[/C][C]114.9[/C][C]91.1676923076923[/C][C]23.7323076923077[/C][/ROW]
[ROW][C]55[/C][C]118.8[/C][C]91.1676923076923[/C][C]27.6323076923077[/C][/ROW]
[ROW][C]56[/C][C]125[/C][C]91.1676923076923[/C][C]33.8323076923077[/C][/ROW]
[ROW][C]57[/C][C]96.1[/C][C]91.1676923076923[/C][C]4.93230769230769[/C][/ROW]
[ROW][C]58[/C][C]116.7[/C][C]91.1676923076923[/C][C]25.5323076923077[/C][/ROW]
[ROW][C]59[/C][C]119.5[/C][C]91.1676923076923[/C][C]28.3323076923077[/C][/ROW]
[ROW][C]60[/C][C]104.1[/C][C]91.1676923076923[/C][C]12.9323076923077[/C][/ROW]
[ROW][C]61[/C][C]121[/C][C]91.1676923076923[/C][C]29.8323076923077[/C][/ROW]
[ROW][C]62[/C][C]127.3[/C][C]91.1676923076923[/C][C]36.1323076923077[/C][/ROW]
[ROW][C]63[/C][C]117.7[/C][C]91.1676923076923[/C][C]26.5323076923077[/C][/ROW]
[ROW][C]64[/C][C]108[/C][C]91.1676923076923[/C][C]16.8323076923077[/C][/ROW]
[ROW][C]65[/C][C]89.4[/C][C]91.1676923076923[/C][C]-1.7676923076923[/C][/ROW]
[ROW][C]66[/C][C]137.4[/C][C]137.23[/C][C]0.170000000000009[/C][/ROW]
[ROW][C]67[/C][C]142[/C][C]137.23[/C][C]4.77[/C][/ROW]
[ROW][C]68[/C][C]137.3[/C][C]137.23[/C][C]0.0700000000000147[/C][/ROW]
[ROW][C]69[/C][C]122.8[/C][C]137.23[/C][C]-14.43[/C][/ROW]
[ROW][C]70[/C][C]126.1[/C][C]137.23[/C][C]-11.13[/C][/ROW]
[ROW][C]71[/C][C]147.6[/C][C]137.23[/C][C]10.37[/C][/ROW]
[ROW][C]72[/C][C]115.7[/C][C]137.23[/C][C]-21.53[/C][/ROW]
[ROW][C]73[/C][C]139.2[/C][C]137.23[/C][C]1.96999999999999[/C][/ROW]
[ROW][C]74[/C][C]151.2[/C][C]137.23[/C][C]13.97[/C][/ROW]
[ROW][C]75[/C][C]123.8[/C][C]137.23[/C][C]-13.43[/C][/ROW]
[ROW][C]76[/C][C]109[/C][C]137.23[/C][C]-28.23[/C][/ROW]
[ROW][C]77[/C][C]112.1[/C][C]137.23[/C][C]-25.13[/C][/ROW]
[ROW][C]78[/C][C]136.4[/C][C]137.23[/C][C]-0.829999999999991[/C][/ROW]
[ROW][C]79[/C][C]135.5[/C][C]137.23[/C][C]-1.73000000000000[/C][/ROW]
[ROW][C]80[/C][C]138.7[/C][C]137.23[/C][C]1.46999999999999[/C][/ROW]
[ROW][C]81[/C][C]137.5[/C][C]137.23[/C][C]0.270000000000003[/C][/ROW]
[ROW][C]82[/C][C]141.5[/C][C]137.23[/C][C]4.27[/C][/ROW]
[ROW][C]83[/C][C]143.6[/C][C]137.23[/C][C]6.37[/C][/ROW]
[ROW][C]84[/C][C]146.5[/C][C]137.23[/C][C]9.27[/C][/ROW]
[ROW][C]85[/C][C]200.7[/C][C]137.23[/C][C]63.47[/C][/ROW]
[/TABLE]
Source: https://freestatistics.org/blog/index.php?pk=25806&T=4

Globally Unique Identifier (entire table): ba.freestatistics.org/blog/index.php?pk=25806&T=4

As an alternative you can also use a QR Code:  

The GUIDs for individual cells are displayed in the table below:

Multiple Linear Regression - Actuals, Interpolation, and Residuals
Time or IndexActualsInterpolationForecastResidualsPrediction Error
192.791.16769230769251.53230769230753
2105.291.167692307692314.0323076923077
391.591.16769230769230.332307692307695
475.391.1676923076923-15.8676923076923
560.591.1676923076923-30.6676923076923
680.491.1676923076923-10.7676923076923
784.591.1676923076923-6.6676923076923
893.991.16769230769232.7323076923077
97891.1676923076923-13.1676923076923
1092.391.16769230769231.13230769230769
119091.1676923076923-1.16769230769230
1272.191.1676923076923-19.0676923076923
1376.991.1676923076923-14.2676923076923
147691.1676923076923-15.1676923076923
1588.791.1676923076923-2.4676923076923
1655.491.1676923076923-35.7676923076923
1746.691.1676923076923-44.5676923076923
1890.991.1676923076923-0.267692307692299
1984.991.1676923076923-6.2676923076923
208991.1676923076923-2.16769230769230
2190.291.1676923076923-0.967692307692302
2272.391.1676923076923-18.8676923076923
238391.1676923076923-8.1676923076923
2471.691.1676923076923-19.5676923076923
2575.491.1676923076923-15.7676923076923
2685.191.1676923076923-6.06769230769231
2781.291.1676923076923-9.9676923076923
2868.791.1676923076923-22.4676923076923
2968.491.1676923076923-22.7676923076923
3093.791.16769230769232.5323076923077
3196.691.16769230769235.43230769230769
32101.891.167692307692310.6323076923077
3393.691.16769230769232.43230769230769
3488.991.1676923076923-2.2676923076923
35114.191.167692307692322.9323076923077
3682.391.1676923076923-8.8676923076923
3796.491.16769230769235.2323076923077
3810491.167692307692312.8323076923077
3988.291.1676923076923-2.9676923076923
4085.291.1676923076923-5.9676923076923
4187.191.1676923076923-4.06769230769231
4285.591.1676923076923-5.6676923076923
4389.191.1676923076923-2.06769230769231
44105.291.167692307692314.0323076923077
4582.991.1676923076923-8.2676923076923
4686.891.1676923076923-4.36769230769231
4711291.167692307692320.8323076923077
4897.491.16769230769236.2323076923077
4988.991.1676923076923-2.2676923076923
50109.491.167692307692318.2323076923077
5187.891.1676923076923-3.36769230769231
5290.591.1676923076923-0.667692307692304
5379.391.1676923076923-11.8676923076923
54114.991.167692307692323.7323076923077
55118.891.167692307692327.6323076923077
5612591.167692307692333.8323076923077
5796.191.16769230769234.93230769230769
58116.791.167692307692325.5323076923077
59119.591.167692307692328.3323076923077
60104.191.167692307692312.9323076923077
6112191.167692307692329.8323076923077
62127.391.167692307692336.1323076923077
63117.791.167692307692326.5323076923077
6410891.167692307692316.8323076923077
6589.491.1676923076923-1.7676923076923
66137.4137.230.170000000000009
67142137.234.77
68137.3137.230.0700000000000147
69122.8137.23-14.43
70126.1137.23-11.13
71147.6137.2310.37
72115.7137.23-21.53
73139.2137.231.96999999999999
74151.2137.2313.97
75123.8137.23-13.43
76109137.23-28.23
77112.1137.23-25.13
78136.4137.23-0.829999999999991
79135.5137.23-1.73000000000000
80138.7137.231.46999999999999
81137.5137.230.270000000000003
82141.5137.234.27
83143.6137.236.37
84146.5137.239.27
85200.7137.2363.47


Parameters (Session):
par1 = 1 ; par2 = Do not include Seasonal Dummies ; par3 = No Linear Trend ;
Parameters (R input):
par1 = 1 ; par2 = Do not include Seasonal Dummies ; par3 = No Linear Trend ;
R code (references can be found in the software module):
library(lattice)
par1 <- as.numeric(par1)
x <- t(y)
k <- length(x[1,])
n <- length(x[,1])
x1 <- cbind(x[,par1], x[,1:k!=par1])
mycolnames <- c(colnames(x)[par1], colnames(x)[1:k!=par1])
colnames(x1) <- mycolnames #colnames(x)[par1]
x <- x1
if (par3 == 'First Differences'){
x2 <- array(0, dim=c(n-1,k), dimnames=list(1:(n-1), paste('(1-B)',colnames(x),sep='')))
for (i in 1:n-1) {
for (j in 1:k) {
x2[i,j] <- x[i+1,j] - x[i,j]
}
}
x <- x2
}
if (par2 == 'Include Monthly Dummies'){
x2 <- array(0, dim=c(n,11), dimnames=list(1:n, paste('M', seq(1:11), sep ='')))
for (i in 1:11){
x2[seq(i,n,12),i] <- 1
}
x <- cbind(x, x2)
}
if (par2 == 'Include Quarterly Dummies'){
x2 <- array(0, dim=c(n,3), dimnames=list(1:n, paste('Q', seq(1:3), sep ='')))
for (i in 1:3){
x2[seq(i,n,4),i] <- 1
}
x <- cbind(x, x2)
}
k <- length(x[1,])
if (par3 == 'Linear Trend'){
x <- cbind(x, c(1:n))
colnames(x)[k+1] <- 't'
}
x
k <- length(x[1,])
df <- as.data.frame(x)
(mylm <- lm(df))
(mysum <- summary(mylm))
bitmap(file='test0.png')
plot(x[,1], type='l', main='Actuals and Interpolation', ylab='value of Actuals and Interpolation (dots)', xlab='time or index')
points(x[,1]-mysum$resid)
grid()
dev.off()
bitmap(file='test1.png')
plot(mysum$resid, type='b', pch=19, main='Residuals', ylab='value of Residuals', xlab='time or index')
grid()
dev.off()
bitmap(file='test2.png')
hist(mysum$resid, main='Residual Histogram', xlab='values of Residuals')
grid()
dev.off()
bitmap(file='test3.png')
densityplot(~mysum$resid,col='black',main='Residual Density Plot', xlab='values of Residuals')
dev.off()
bitmap(file='test4.png')
qqnorm(mysum$resid, main='Residual Normal Q-Q Plot')
grid()
dev.off()
(myerror <- as.ts(mysum$resid))
bitmap(file='test5.png')
dum <- cbind(lag(myerror,k=1),myerror)
dum
dum1 <- dum[2:length(myerror),]
dum1
z <- as.data.frame(dum1)
z
plot(z,main=paste('Residual Lag plot, lowess, and regression line'), ylab='values of Residuals', xlab='lagged values of Residuals')
lines(lowess(z))
abline(lm(z))
grid()
dev.off()
bitmap(file='test6.png')
acf(mysum$resid, lag.max=length(mysum$resid)/2, main='Residual Autocorrelation Function')
grid()
dev.off()
bitmap(file='test7.png')
pacf(mysum$resid, lag.max=length(mysum$resid)/2, main='Residual Partial Autocorrelation Function')
grid()
dev.off()
bitmap(file='test8.png')
opar <- par(mfrow = c(2,2), oma = c(0, 0, 1.1, 0))
plot(mylm, las = 1, sub='Residual Diagnostics')
par(opar)
dev.off()
load(file='createtable')
a<-table.start()
a<-table.row.start(a)
a<-table.element(a, 'Multiple Linear Regression - Estimated Regression Equation', 1, TRUE)
a<-table.row.end(a)
myeq <- colnames(x)[1]
myeq <- paste(myeq, '[t] = ', sep='')
for (i in 1:k){
if (mysum$coefficients[i,1] > 0) myeq <- paste(myeq, '+', '')
myeq <- paste(myeq, mysum$coefficients[i,1], sep=' ')
if (rownames(mysum$coefficients)[i] != '(Intercept)') {
myeq <- paste(myeq, rownames(mysum$coefficients)[i], sep='')
if (rownames(mysum$coefficients)[i] != 't') myeq <- paste(myeq, '[t]', sep='')
}
}
myeq <- paste(myeq, ' + e[t]')
a<-table.row.start(a)
a<-table.element(a, myeq)
a<-table.row.end(a)
a<-table.end(a)
table.save(a,file='mytable1.tab')
a<-table.start()
a<-table.row.start(a)
a<-table.element(a,hyperlink('ols1.htm','Multiple Linear Regression - Ordinary Least Squares',''), 6, TRUE)
a<-table.row.end(a)
a<-table.row.start(a)
a<-table.element(a,'Variable',header=TRUE)
a<-table.element(a,'Parameter',header=TRUE)
a<-table.element(a,'S.D.',header=TRUE)
a<-table.element(a,'T-STAT
H0: parameter = 0',header=TRUE)
a<-table.element(a,'2-tail p-value',header=TRUE)
a<-table.element(a,'1-tail p-value',header=TRUE)
a<-table.row.end(a)
for (i in 1:k){
a<-table.row.start(a)
a<-table.element(a,rownames(mysum$coefficients)[i],header=TRUE)
a<-table.element(a,mysum$coefficients[i,1])
a<-table.element(a, round(mysum$coefficients[i,2],6))
a<-table.element(a, round(mysum$coefficients[i,3],4))
a<-table.element(a, round(mysum$coefficients[i,4],6))
a<-table.element(a, round(mysum$coefficients[i,4]/2,6))
a<-table.row.end(a)
}
a<-table.end(a)
table.save(a,file='mytable2.tab')
a<-table.start()
a<-table.row.start(a)
a<-table.element(a, 'Multiple Linear Regression - Regression Statistics', 2, TRUE)
a<-table.row.end(a)
a<-table.row.start(a)
a<-table.element(a, 'Multiple R',1,TRUE)
a<-table.element(a, sqrt(mysum$r.squared))
a<-table.row.end(a)
a<-table.row.start(a)
a<-table.element(a, 'R-squared',1,TRUE)
a<-table.element(a, mysum$r.squared)
a<-table.row.end(a)
a<-table.row.start(a)
a<-table.element(a, 'Adjusted R-squared',1,TRUE)
a<-table.element(a, mysum$adj.r.squared)
a<-table.row.end(a)
a<-table.row.start(a)
a<-table.element(a, 'F-TEST (value)',1,TRUE)
a<-table.element(a, mysum$fstatistic[1])
a<-table.row.end(a)
a<-table.row.start(a)
a<-table.element(a, 'F-TEST (DF numerator)',1,TRUE)
a<-table.element(a, mysum$fstatistic[2])
a<-table.row.end(a)
a<-table.row.start(a)
a<-table.element(a, 'F-TEST (DF denominator)',1,TRUE)
a<-table.element(a, mysum$fstatistic[3])
a<-table.row.end(a)
a<-table.row.start(a)
a<-table.element(a, 'p-value',1,TRUE)
a<-table.element(a, 1-pf(mysum$fstatistic[1],mysum$fstatistic[2],mysum$fstatistic[3]))
a<-table.row.end(a)
a<-table.row.start(a)
a<-table.element(a, 'Multiple Linear Regression - Residual Statistics', 2, TRUE)
a<-table.row.end(a)
a<-table.row.start(a)
a<-table.element(a, 'Residual Standard Deviation',1,TRUE)
a<-table.element(a, mysum$sigma)
a<-table.row.end(a)
a<-table.row.start(a)
a<-table.element(a, 'Sum Squared Residuals',1,TRUE)
a<-table.element(a, sum(myerror*myerror))
a<-table.row.end(a)
a<-table.end(a)
table.save(a,file='mytable3.tab')
a<-table.start()
a<-table.row.start(a)
a<-table.element(a, 'Multiple Linear Regression - Actuals, Interpolation, and Residuals', 4, TRUE)
a<-table.row.end(a)
a<-table.row.start(a)
a<-table.element(a, 'Time or Index', 1, TRUE)
a<-table.element(a, 'Actuals', 1, TRUE)
a<-table.element(a, 'Interpolation
Forecast', 1, TRUE)
a<-table.element(a, 'Residuals
Prediction Error', 1, TRUE)
a<-table.row.end(a)
for (i in 1:n) {
a<-table.row.start(a)
a<-table.element(a,i, 1, TRUE)
a<-table.element(a,x[i])
a<-table.element(a,x[i]-mysum$resid[i])
a<-table.element(a,mysum$resid[i])
a<-table.row.end(a)
}
a<-table.end(a)
table.save(a,file='mytable4.tab')