Free Statistics

of Irreproducible Research!

Author's title

Author*Unverified author*
R Software Modulerwasp_multipleregression.wasp
Title produced by softwareMultiple Regression
Date of computationThu, 27 Nov 2008 05:56:19 -0700
Cite this page as followsStatistical Computations at FreeStatistics.org, Office for Research Development and Education, URL https://freestatistics.org/blog/index.php?v=date/2008/Nov/27/t1227791363iy4z5fo42ueeely.htm/, Retrieved Mon, 20 May 2024 10:06:45 +0000
Statistical Computations at FreeStatistics.org, Office for Research Development and Education, URL https://freestatistics.org/blog/index.php?pk=25798, Retrieved Mon, 20 May 2024 10:06:45 +0000
QR Codes:

Original text written by user:
IsPrivate?No (this computation is public)
User-defined keywordskleuter
Estimated Impact174
Family? (F = Feedback message, R = changed R code, M = changed R Module, P = changed Parameters, D = changed Data)
F     [Multiple Regression] [] [2008-11-18 09:23:14] [488d9a19d3c63b747ac6ad96017e55c8]
F   PD    [Multiple Regression] [invloed van rookv...] [2008-11-27 12:56:19] [b5c0979bf79a38ace87e0d3abace1ca1] [Current]
Feedback Forum
2008-11-30 10:48:25 [Gert-Jan Geudens] [reply
Deze berekeningen zijn overbodig. We moeten hier echter seizonaliteit en een lineaire trend opnemen. Het kan bijvoorbeeld zijn dat in de winter meer mensen op restaurant gaan dan in de zomer. De student(e) heeft verder in de vraag, de berekening opnieuw gemaakt met seizonaliteit en een lineaire trend.
2008-11-30 10:58:55 [Gert-Jan Geudens] [reply
We moeten hier nog even het volgende rechtzetten. Deze berekening in het geval van de student(e) wel kan aangezien deze jaarcijfers heeft gekozen. Er is dus hier helemaal geen sprake van seizonaliteit. In de vraag staat echter wel dat we seasonal dummies moeten gebruiken en dus is de door de student(e) gekozen tijdreeks, niet geschikt voor deze vraag.
2008-11-30 15:09:17 [6066575aa30c0611e452e930b1dff53d] [reply
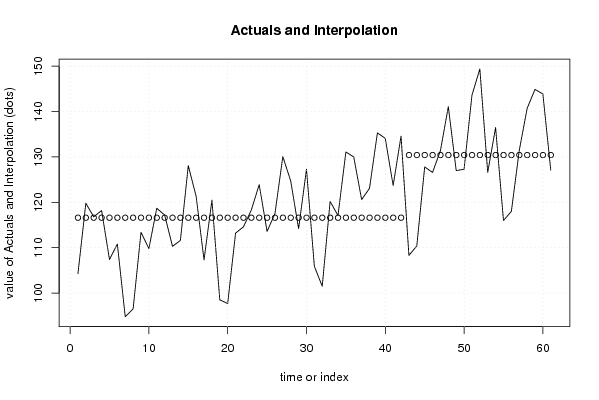
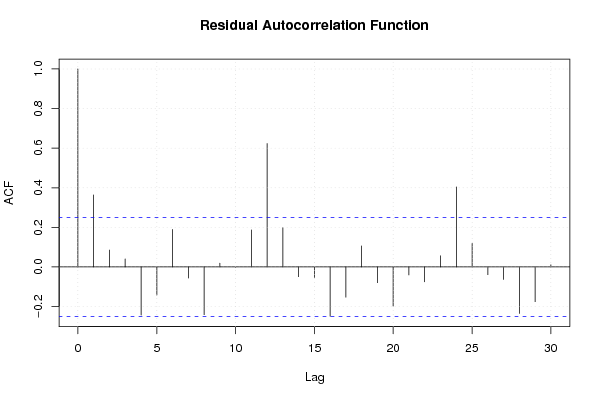
Men had hier eigenlijk de grafiek van actuals and interpolation moeten bespreken. In deze grafiek zien we dat het gaat om een positieve trend en zien we ook een niveauverschil ter hoogte van (ongeveer) 45 (op de x-as).

Post a new message
Dataseries X:
104,3	0
119,8	0
116,8	0
118,2	0
107,4	0
110,8	0
94,8	0
96,5	0
113,4	0
109,8	0
118,7	0
117,2	0
110,3	0
111,6	0
128,1	0
121,3	0
107,3	0
120,5	0
98,5	0
97,7	0
113,2	0
114,6	0
118,3	0
123,9	0
113,6	0
117,5	0
130,1	0
124,7	0
114,2	0
127,3	0
105,9	0
101,5	0
120,2	0
117,1	0
131,1	0
130	0
120,6	0
123,1	0
135,3	0
134,1	0
123,7	0
134,6	0
108,3	1
110,4	1
127,8	1
126,6	1
131,4	1
141,1	1
127	1
127,3	1
143,6	1
149,4	1
126,6	1
136,5	1
116	1
118	1
131,4	1
140,7	1
144,9	1
143,9	1
127,1	1


Summary of computational transaction
Raw Inputview raw input (R code)
Raw Outputview raw output of R engine
Computing time4 seconds
R Server'George Udny Yule' @ 72.249.76.132

\begin{tabular}{lllllllll}
\hline
Summary of computational transaction \tabularnewline
Raw Input & view raw input (R code)  \tabularnewline
Raw Output & view raw output of R engine  \tabularnewline
Computing time & 4 seconds \tabularnewline
R Server & 'George Udny Yule' @ 72.249.76.132 \tabularnewline
\hline
\end{tabular}
%Source: https://freestatistics.org/blog/index.php?pk=25798&T=0

[TABLE]
[ROW][C]Summary of computational transaction[/C][/ROW]
[ROW][C]Raw Input[/C][C]view raw input (R code) [/C][/ROW]
[ROW][C]Raw Output[/C][C]view raw output of R engine [/C][/ROW]
[ROW][C]Computing time[/C][C]4 seconds[/C][/ROW]
[ROW][C]R Server[/C][C]'George Udny Yule' @ 72.249.76.132[/C][/ROW]
[/TABLE]
Source: https://freestatistics.org/blog/index.php?pk=25798&T=0

Globally Unique Identifier (entire table): ba.freestatistics.org/blog/index.php?pk=25798&T=0

As an alternative you can also use a QR Code:  

The GUIDs for individual cells are displayed in the table below:

Summary of computational transaction
Raw Inputview raw input (R code)
Raw Outputview raw output of R engine
Computing time4 seconds
R Server'George Udny Yule' @ 72.249.76.132


Multiple Linear Regression - Estimated Regression Equation
x[t] = + 116.609523809524 + 13.8115288220551y[t] + e[t]

\begin{tabular}{lllllllll}
\hline
Multiple Linear Regression - Estimated Regression Equation \tabularnewline
x[t] =  +  116.609523809524 +  13.8115288220551y[t]  + e[t] \tabularnewline
\hline
\end{tabular}
%Source: https://freestatistics.org/blog/index.php?pk=25798&T=1

[TABLE]
[ROW][C]Multiple Linear Regression - Estimated Regression Equation[/C][/ROW]
[ROW][C]x[t] =  +  116.609523809524 +  13.8115288220551y[t]  + e[t][/C][/ROW]
[/TABLE]
Source: https://freestatistics.org/blog/index.php?pk=25798&T=1

Globally Unique Identifier (entire table): ba.freestatistics.org/blog/index.php?pk=25798&T=1

As an alternative you can also use a QR Code:  

The GUIDs for individual cells are displayed in the table below:

Multiple Linear Regression - Estimated Regression Equation
x[t] = + 116.609523809524 + 13.8115288220551y[t] + e[t]


Multiple Linear Regression - Ordinary Least Squares
VariableParameterS.D.T-STATH0: parameter = 02-tail p-value1-tail p-value
(Intercept)116.6095238095241.6827769.296200
y13.81152882205513.0151774.58072.4e-051.2e-05

\begin{tabular}{lllllllll}
\hline
Multiple Linear Regression - Ordinary Least Squares \tabularnewline
Variable & Parameter & S.D. & T-STATH0: parameter = 0 & 2-tail p-value & 1-tail p-value \tabularnewline
(Intercept) & 116.609523809524 & 1.68277 & 69.2962 & 0 & 0 \tabularnewline
y & 13.8115288220551 & 3.015177 & 4.5807 & 2.4e-05 & 1.2e-05 \tabularnewline
\hline
\end{tabular}
%Source: https://freestatistics.org/blog/index.php?pk=25798&T=2

[TABLE]
[ROW][C]Multiple Linear Regression - Ordinary Least Squares[/C][/ROW]
[ROW][C]Variable[/C][C]Parameter[/C][C]S.D.[/C][C]T-STATH0: parameter = 0[/C][C]2-tail p-value[/C][C]1-tail p-value[/C][/ROW]
[ROW][C](Intercept)[/C][C]116.609523809524[/C][C]1.68277[/C][C]69.2962[/C][C]0[/C][C]0[/C][/ROW]
[ROW][C]y[/C][C]13.8115288220551[/C][C]3.015177[/C][C]4.5807[/C][C]2.4e-05[/C][C]1.2e-05[/C][/ROW]
[/TABLE]
Source: https://freestatistics.org/blog/index.php?pk=25798&T=2

Globally Unique Identifier (entire table): ba.freestatistics.org/blog/index.php?pk=25798&T=2

As an alternative you can also use a QR Code:  

The GUIDs for individual cells are displayed in the table below:

Multiple Linear Regression - Ordinary Least Squares
VariableParameterS.D.T-STATH0: parameter = 02-tail p-value1-tail p-value
(Intercept)116.6095238095241.6827769.296200
y13.81152882205513.0151774.58072.4e-051.2e-05


Multiple Linear Regression - Regression Statistics
Multiple R0.512190311264372
R-squared0.262338914953094
Adjusted R-squared0.249836184698062
F-TEST (value)20.9825301835576
F-TEST (DF numerator)1
F-TEST (DF denominator)59
p-value2.44823599915289e-05
Multiple Linear Regression - Residual Statistics
Residual Standard Deviation10.9055947151875
Sum Squared Residuals7016.98776942355

\begin{tabular}{lllllllll}
\hline
Multiple Linear Regression - Regression Statistics \tabularnewline
Multiple R & 0.512190311264372 \tabularnewline
R-squared & 0.262338914953094 \tabularnewline
Adjusted R-squared & 0.249836184698062 \tabularnewline
F-TEST (value) & 20.9825301835576 \tabularnewline
F-TEST (DF numerator) & 1 \tabularnewline
F-TEST (DF denominator) & 59 \tabularnewline
p-value & 2.44823599915289e-05 \tabularnewline
Multiple Linear Regression - Residual Statistics \tabularnewline
Residual Standard Deviation & 10.9055947151875 \tabularnewline
Sum Squared Residuals & 7016.98776942355 \tabularnewline
\hline
\end{tabular}
%Source: https://freestatistics.org/blog/index.php?pk=25798&T=3

[TABLE]
[ROW][C]Multiple Linear Regression - Regression Statistics[/C][/ROW]
[ROW][C]Multiple R[/C][C]0.512190311264372[/C][/ROW]
[ROW][C]R-squared[/C][C]0.262338914953094[/C][/ROW]
[ROW][C]Adjusted R-squared[/C][C]0.249836184698062[/C][/ROW]
[ROW][C]F-TEST (value)[/C][C]20.9825301835576[/C][/ROW]
[ROW][C]F-TEST (DF numerator)[/C][C]1[/C][/ROW]
[ROW][C]F-TEST (DF denominator)[/C][C]59[/C][/ROW]
[ROW][C]p-value[/C][C]2.44823599915289e-05[/C][/ROW]
[ROW][C]Multiple Linear Regression - Residual Statistics[/C][/ROW]
[ROW][C]Residual Standard Deviation[/C][C]10.9055947151875[/C][/ROW]
[ROW][C]Sum Squared Residuals[/C][C]7016.98776942355[/C][/ROW]
[/TABLE]
Source: https://freestatistics.org/blog/index.php?pk=25798&T=3

Globally Unique Identifier (entire table): ba.freestatistics.org/blog/index.php?pk=25798&T=3

As an alternative you can also use a QR Code:  

The GUIDs for individual cells are displayed in the table below:

Multiple Linear Regression - Regression Statistics
Multiple R0.512190311264372
R-squared0.262338914953094
Adjusted R-squared0.249836184698062
F-TEST (value)20.9825301835576
F-TEST (DF numerator)1
F-TEST (DF denominator)59
p-value2.44823599915289e-05
Multiple Linear Regression - Residual Statistics
Residual Standard Deviation10.9055947151875
Sum Squared Residuals7016.98776942355


Multiple Linear Regression - Actuals, Interpolation, and Residuals
Time or IndexActualsInterpolationForecastResidualsPrediction Error
1104.3116.609523809524-12.3095238095237
2119.8116.6095238095243.19047619047618
3116.8116.6095238095240.190476190476185
4118.2116.6095238095241.59047619047619
5107.4116.609523809524-9.2095238095238
6110.8116.609523809524-5.80952380952382
794.8116.609523809524-21.8095238095238
896.5116.609523809524-20.1095238095238
9113.4116.609523809524-3.20952380952381
10109.8116.609523809524-6.80952380952382
11118.7116.6095238095242.09047619047619
12117.2116.6095238095240.59047619047619
13110.3116.609523809524-6.30952380952382
14111.6116.609523809524-5.00952380952382
15128.1116.60952380952411.4904761904762
16121.3116.6095238095244.69047619047618
17107.3116.609523809524-9.30952380952382
18120.5116.6095238095243.89047619047619
1998.5116.609523809524-18.1095238095238
2097.7116.609523809524-18.9095238095238
21113.2116.609523809524-3.40952380952381
22114.6116.609523809524-2.00952380952382
23118.3116.6095238095241.69047619047618
24123.9116.6095238095247.2904761904762
25113.6116.609523809524-3.00952380952382
26117.5116.6095238095240.890476190476188
27130.1116.60952380952413.4904761904762
28124.7116.6095238095248.0904761904762
29114.2116.609523809524-2.40952380952381
30127.3116.60952380952410.6904761904762
31105.9116.609523809524-10.7095238095238
32101.5116.609523809524-15.1095238095238
33120.2116.6095238095243.59047619047619
34117.1116.6095238095240.490476190476182
35131.1116.60952380952414.4904761904762
36130116.60952380952413.3904761904762
37120.6116.6095238095243.99047619047618
38123.1116.6095238095246.49047619047618
39135.3116.60952380952418.6904761904762
40134.1116.60952380952417.4904761904762
41123.7116.6095238095247.0904761904762
42134.6116.60952380952417.9904761904762
43108.3130.421052631579-22.1210526315790
44110.4130.421052631579-20.0210526315789
45127.8130.421052631579-2.62105263157895
46126.6130.421052631579-3.82105263157895
47131.4130.4210526315790.97894736842106
48141.1130.42105263157910.6789473684210
49127130.421052631579-3.42105263157895
50127.3130.421052631579-3.12105263157895
51143.6130.42105263157913.1789473684210
52149.4130.42105263157918.9789473684211
53126.6130.421052631579-3.82105263157895
54136.5130.4210526315796.07894736842105
55116130.421052631579-14.4210526315789
56118130.421052631579-12.4210526315789
57131.4130.4210526315790.97894736842106
58140.7130.42105263157910.2789473684210
59144.9130.42105263157914.4789473684211
60143.9130.42105263157913.4789473684211
61127.1130.421052631579-3.32105263157895

\begin{tabular}{lllllllll}
\hline
Multiple Linear Regression - Actuals, Interpolation, and Residuals \tabularnewline
Time or Index & Actuals & InterpolationForecast & ResidualsPrediction Error \tabularnewline
1 & 104.3 & 116.609523809524 & -12.3095238095237 \tabularnewline
2 & 119.8 & 116.609523809524 & 3.19047619047618 \tabularnewline
3 & 116.8 & 116.609523809524 & 0.190476190476185 \tabularnewline
4 & 118.2 & 116.609523809524 & 1.59047619047619 \tabularnewline
5 & 107.4 & 116.609523809524 & -9.2095238095238 \tabularnewline
6 & 110.8 & 116.609523809524 & -5.80952380952382 \tabularnewline
7 & 94.8 & 116.609523809524 & -21.8095238095238 \tabularnewline
8 & 96.5 & 116.609523809524 & -20.1095238095238 \tabularnewline
9 & 113.4 & 116.609523809524 & -3.20952380952381 \tabularnewline
10 & 109.8 & 116.609523809524 & -6.80952380952382 \tabularnewline
11 & 118.7 & 116.609523809524 & 2.09047619047619 \tabularnewline
12 & 117.2 & 116.609523809524 & 0.59047619047619 \tabularnewline
13 & 110.3 & 116.609523809524 & -6.30952380952382 \tabularnewline
14 & 111.6 & 116.609523809524 & -5.00952380952382 \tabularnewline
15 & 128.1 & 116.609523809524 & 11.4904761904762 \tabularnewline
16 & 121.3 & 116.609523809524 & 4.69047619047618 \tabularnewline
17 & 107.3 & 116.609523809524 & -9.30952380952382 \tabularnewline
18 & 120.5 & 116.609523809524 & 3.89047619047619 \tabularnewline
19 & 98.5 & 116.609523809524 & -18.1095238095238 \tabularnewline
20 & 97.7 & 116.609523809524 & -18.9095238095238 \tabularnewline
21 & 113.2 & 116.609523809524 & -3.40952380952381 \tabularnewline
22 & 114.6 & 116.609523809524 & -2.00952380952382 \tabularnewline
23 & 118.3 & 116.609523809524 & 1.69047619047618 \tabularnewline
24 & 123.9 & 116.609523809524 & 7.2904761904762 \tabularnewline
25 & 113.6 & 116.609523809524 & -3.00952380952382 \tabularnewline
26 & 117.5 & 116.609523809524 & 0.890476190476188 \tabularnewline
27 & 130.1 & 116.609523809524 & 13.4904761904762 \tabularnewline
28 & 124.7 & 116.609523809524 & 8.0904761904762 \tabularnewline
29 & 114.2 & 116.609523809524 & -2.40952380952381 \tabularnewline
30 & 127.3 & 116.609523809524 & 10.6904761904762 \tabularnewline
31 & 105.9 & 116.609523809524 & -10.7095238095238 \tabularnewline
32 & 101.5 & 116.609523809524 & -15.1095238095238 \tabularnewline
33 & 120.2 & 116.609523809524 & 3.59047619047619 \tabularnewline
34 & 117.1 & 116.609523809524 & 0.490476190476182 \tabularnewline
35 & 131.1 & 116.609523809524 & 14.4904761904762 \tabularnewline
36 & 130 & 116.609523809524 & 13.3904761904762 \tabularnewline
37 & 120.6 & 116.609523809524 & 3.99047619047618 \tabularnewline
38 & 123.1 & 116.609523809524 & 6.49047619047618 \tabularnewline
39 & 135.3 & 116.609523809524 & 18.6904761904762 \tabularnewline
40 & 134.1 & 116.609523809524 & 17.4904761904762 \tabularnewline
41 & 123.7 & 116.609523809524 & 7.0904761904762 \tabularnewline
42 & 134.6 & 116.609523809524 & 17.9904761904762 \tabularnewline
43 & 108.3 & 130.421052631579 & -22.1210526315790 \tabularnewline
44 & 110.4 & 130.421052631579 & -20.0210526315789 \tabularnewline
45 & 127.8 & 130.421052631579 & -2.62105263157895 \tabularnewline
46 & 126.6 & 130.421052631579 & -3.82105263157895 \tabularnewline
47 & 131.4 & 130.421052631579 & 0.97894736842106 \tabularnewline
48 & 141.1 & 130.421052631579 & 10.6789473684210 \tabularnewline
49 & 127 & 130.421052631579 & -3.42105263157895 \tabularnewline
50 & 127.3 & 130.421052631579 & -3.12105263157895 \tabularnewline
51 & 143.6 & 130.421052631579 & 13.1789473684210 \tabularnewline
52 & 149.4 & 130.421052631579 & 18.9789473684211 \tabularnewline
53 & 126.6 & 130.421052631579 & -3.82105263157895 \tabularnewline
54 & 136.5 & 130.421052631579 & 6.07894736842105 \tabularnewline
55 & 116 & 130.421052631579 & -14.4210526315789 \tabularnewline
56 & 118 & 130.421052631579 & -12.4210526315789 \tabularnewline
57 & 131.4 & 130.421052631579 & 0.97894736842106 \tabularnewline
58 & 140.7 & 130.421052631579 & 10.2789473684210 \tabularnewline
59 & 144.9 & 130.421052631579 & 14.4789473684211 \tabularnewline
60 & 143.9 & 130.421052631579 & 13.4789473684211 \tabularnewline
61 & 127.1 & 130.421052631579 & -3.32105263157895 \tabularnewline
\hline
\end{tabular}
%Source: https://freestatistics.org/blog/index.php?pk=25798&T=4

[TABLE]
[ROW][C]Multiple Linear Regression - Actuals, Interpolation, and Residuals[/C][/ROW]
[ROW][C]Time or Index[/C][C]Actuals[/C][C]InterpolationForecast[/C][C]ResidualsPrediction Error[/C][/ROW]
[ROW][C]1[/C][C]104.3[/C][C]116.609523809524[/C][C]-12.3095238095237[/C][/ROW]
[ROW][C]2[/C][C]119.8[/C][C]116.609523809524[/C][C]3.19047619047618[/C][/ROW]
[ROW][C]3[/C][C]116.8[/C][C]116.609523809524[/C][C]0.190476190476185[/C][/ROW]
[ROW][C]4[/C][C]118.2[/C][C]116.609523809524[/C][C]1.59047619047619[/C][/ROW]
[ROW][C]5[/C][C]107.4[/C][C]116.609523809524[/C][C]-9.2095238095238[/C][/ROW]
[ROW][C]6[/C][C]110.8[/C][C]116.609523809524[/C][C]-5.80952380952382[/C][/ROW]
[ROW][C]7[/C][C]94.8[/C][C]116.609523809524[/C][C]-21.8095238095238[/C][/ROW]
[ROW][C]8[/C][C]96.5[/C][C]116.609523809524[/C][C]-20.1095238095238[/C][/ROW]
[ROW][C]9[/C][C]113.4[/C][C]116.609523809524[/C][C]-3.20952380952381[/C][/ROW]
[ROW][C]10[/C][C]109.8[/C][C]116.609523809524[/C][C]-6.80952380952382[/C][/ROW]
[ROW][C]11[/C][C]118.7[/C][C]116.609523809524[/C][C]2.09047619047619[/C][/ROW]
[ROW][C]12[/C][C]117.2[/C][C]116.609523809524[/C][C]0.59047619047619[/C][/ROW]
[ROW][C]13[/C][C]110.3[/C][C]116.609523809524[/C][C]-6.30952380952382[/C][/ROW]
[ROW][C]14[/C][C]111.6[/C][C]116.609523809524[/C][C]-5.00952380952382[/C][/ROW]
[ROW][C]15[/C][C]128.1[/C][C]116.609523809524[/C][C]11.4904761904762[/C][/ROW]
[ROW][C]16[/C][C]121.3[/C][C]116.609523809524[/C][C]4.69047619047618[/C][/ROW]
[ROW][C]17[/C][C]107.3[/C][C]116.609523809524[/C][C]-9.30952380952382[/C][/ROW]
[ROW][C]18[/C][C]120.5[/C][C]116.609523809524[/C][C]3.89047619047619[/C][/ROW]
[ROW][C]19[/C][C]98.5[/C][C]116.609523809524[/C][C]-18.1095238095238[/C][/ROW]
[ROW][C]20[/C][C]97.7[/C][C]116.609523809524[/C][C]-18.9095238095238[/C][/ROW]
[ROW][C]21[/C][C]113.2[/C][C]116.609523809524[/C][C]-3.40952380952381[/C][/ROW]
[ROW][C]22[/C][C]114.6[/C][C]116.609523809524[/C][C]-2.00952380952382[/C][/ROW]
[ROW][C]23[/C][C]118.3[/C][C]116.609523809524[/C][C]1.69047619047618[/C][/ROW]
[ROW][C]24[/C][C]123.9[/C][C]116.609523809524[/C][C]7.2904761904762[/C][/ROW]
[ROW][C]25[/C][C]113.6[/C][C]116.609523809524[/C][C]-3.00952380952382[/C][/ROW]
[ROW][C]26[/C][C]117.5[/C][C]116.609523809524[/C][C]0.890476190476188[/C][/ROW]
[ROW][C]27[/C][C]130.1[/C][C]116.609523809524[/C][C]13.4904761904762[/C][/ROW]
[ROW][C]28[/C][C]124.7[/C][C]116.609523809524[/C][C]8.0904761904762[/C][/ROW]
[ROW][C]29[/C][C]114.2[/C][C]116.609523809524[/C][C]-2.40952380952381[/C][/ROW]
[ROW][C]30[/C][C]127.3[/C][C]116.609523809524[/C][C]10.6904761904762[/C][/ROW]
[ROW][C]31[/C][C]105.9[/C][C]116.609523809524[/C][C]-10.7095238095238[/C][/ROW]
[ROW][C]32[/C][C]101.5[/C][C]116.609523809524[/C][C]-15.1095238095238[/C][/ROW]
[ROW][C]33[/C][C]120.2[/C][C]116.609523809524[/C][C]3.59047619047619[/C][/ROW]
[ROW][C]34[/C][C]117.1[/C][C]116.609523809524[/C][C]0.490476190476182[/C][/ROW]
[ROW][C]35[/C][C]131.1[/C][C]116.609523809524[/C][C]14.4904761904762[/C][/ROW]
[ROW][C]36[/C][C]130[/C][C]116.609523809524[/C][C]13.3904761904762[/C][/ROW]
[ROW][C]37[/C][C]120.6[/C][C]116.609523809524[/C][C]3.99047619047618[/C][/ROW]
[ROW][C]38[/C][C]123.1[/C][C]116.609523809524[/C][C]6.49047619047618[/C][/ROW]
[ROW][C]39[/C][C]135.3[/C][C]116.609523809524[/C][C]18.6904761904762[/C][/ROW]
[ROW][C]40[/C][C]134.1[/C][C]116.609523809524[/C][C]17.4904761904762[/C][/ROW]
[ROW][C]41[/C][C]123.7[/C][C]116.609523809524[/C][C]7.0904761904762[/C][/ROW]
[ROW][C]42[/C][C]134.6[/C][C]116.609523809524[/C][C]17.9904761904762[/C][/ROW]
[ROW][C]43[/C][C]108.3[/C][C]130.421052631579[/C][C]-22.1210526315790[/C][/ROW]
[ROW][C]44[/C][C]110.4[/C][C]130.421052631579[/C][C]-20.0210526315789[/C][/ROW]
[ROW][C]45[/C][C]127.8[/C][C]130.421052631579[/C][C]-2.62105263157895[/C][/ROW]
[ROW][C]46[/C][C]126.6[/C][C]130.421052631579[/C][C]-3.82105263157895[/C][/ROW]
[ROW][C]47[/C][C]131.4[/C][C]130.421052631579[/C][C]0.97894736842106[/C][/ROW]
[ROW][C]48[/C][C]141.1[/C][C]130.421052631579[/C][C]10.6789473684210[/C][/ROW]
[ROW][C]49[/C][C]127[/C][C]130.421052631579[/C][C]-3.42105263157895[/C][/ROW]
[ROW][C]50[/C][C]127.3[/C][C]130.421052631579[/C][C]-3.12105263157895[/C][/ROW]
[ROW][C]51[/C][C]143.6[/C][C]130.421052631579[/C][C]13.1789473684210[/C][/ROW]
[ROW][C]52[/C][C]149.4[/C][C]130.421052631579[/C][C]18.9789473684211[/C][/ROW]
[ROW][C]53[/C][C]126.6[/C][C]130.421052631579[/C][C]-3.82105263157895[/C][/ROW]
[ROW][C]54[/C][C]136.5[/C][C]130.421052631579[/C][C]6.07894736842105[/C][/ROW]
[ROW][C]55[/C][C]116[/C][C]130.421052631579[/C][C]-14.4210526315789[/C][/ROW]
[ROW][C]56[/C][C]118[/C][C]130.421052631579[/C][C]-12.4210526315789[/C][/ROW]
[ROW][C]57[/C][C]131.4[/C][C]130.421052631579[/C][C]0.97894736842106[/C][/ROW]
[ROW][C]58[/C][C]140.7[/C][C]130.421052631579[/C][C]10.2789473684210[/C][/ROW]
[ROW][C]59[/C][C]144.9[/C][C]130.421052631579[/C][C]14.4789473684211[/C][/ROW]
[ROW][C]60[/C][C]143.9[/C][C]130.421052631579[/C][C]13.4789473684211[/C][/ROW]
[ROW][C]61[/C][C]127.1[/C][C]130.421052631579[/C][C]-3.32105263157895[/C][/ROW]
[/TABLE]
Source: https://freestatistics.org/blog/index.php?pk=25798&T=4

Globally Unique Identifier (entire table): ba.freestatistics.org/blog/index.php?pk=25798&T=4

As an alternative you can also use a QR Code:  

The GUIDs for individual cells are displayed in the table below:

Multiple Linear Regression - Actuals, Interpolation, and Residuals
Time or IndexActualsInterpolationForecastResidualsPrediction Error
1104.3116.609523809524-12.3095238095237
2119.8116.6095238095243.19047619047618
3116.8116.6095238095240.190476190476185
4118.2116.6095238095241.59047619047619
5107.4116.609523809524-9.2095238095238
6110.8116.609523809524-5.80952380952382
794.8116.609523809524-21.8095238095238
896.5116.609523809524-20.1095238095238
9113.4116.609523809524-3.20952380952381
10109.8116.609523809524-6.80952380952382
11118.7116.6095238095242.09047619047619
12117.2116.6095238095240.59047619047619
13110.3116.609523809524-6.30952380952382
14111.6116.609523809524-5.00952380952382
15128.1116.60952380952411.4904761904762
16121.3116.6095238095244.69047619047618
17107.3116.609523809524-9.30952380952382
18120.5116.6095238095243.89047619047619
1998.5116.609523809524-18.1095238095238
2097.7116.609523809524-18.9095238095238
21113.2116.609523809524-3.40952380952381
22114.6116.609523809524-2.00952380952382
23118.3116.6095238095241.69047619047618
24123.9116.6095238095247.2904761904762
25113.6116.609523809524-3.00952380952382
26117.5116.6095238095240.890476190476188
27130.1116.60952380952413.4904761904762
28124.7116.6095238095248.0904761904762
29114.2116.609523809524-2.40952380952381
30127.3116.60952380952410.6904761904762
31105.9116.609523809524-10.7095238095238
32101.5116.609523809524-15.1095238095238
33120.2116.6095238095243.59047619047619
34117.1116.6095238095240.490476190476182
35131.1116.60952380952414.4904761904762
36130116.60952380952413.3904761904762
37120.6116.6095238095243.99047619047618
38123.1116.6095238095246.49047619047618
39135.3116.60952380952418.6904761904762
40134.1116.60952380952417.4904761904762
41123.7116.6095238095247.0904761904762
42134.6116.60952380952417.9904761904762
43108.3130.421052631579-22.1210526315790
44110.4130.421052631579-20.0210526315789
45127.8130.421052631579-2.62105263157895
46126.6130.421052631579-3.82105263157895
47131.4130.4210526315790.97894736842106
48141.1130.42105263157910.6789473684210
49127130.421052631579-3.42105263157895
50127.3130.421052631579-3.12105263157895
51143.6130.42105263157913.1789473684210
52149.4130.42105263157918.9789473684211
53126.6130.421052631579-3.82105263157895
54136.5130.4210526315796.07894736842105
55116130.421052631579-14.4210526315789
56118130.421052631579-12.4210526315789
57131.4130.4210526315790.97894736842106
58140.7130.42105263157910.2789473684210
59144.9130.42105263157914.4789473684211
60143.9130.42105263157913.4789473684211
61127.1130.421052631579-3.32105263157895


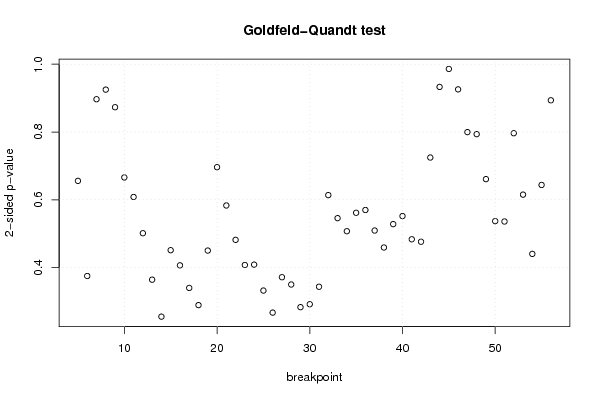
Goldfeld-Quandt test for Heteroskedasticity
p-valuesAlternative Hypothesis
breakpoint indexgreater2-sidedless
50.3279119794429820.6558239588859650.672088020557018
60.187547204958890.375094409917780.81245279504111
70.4483299215980940.8966598431961890.551670078401906
80.5374904361432670.9250191277134660.462509563856733
90.436583796034950.87316759206990.56341620396505
100.3329821982987610.6659643965975230.667017801701238
110.3041189875797210.6082379751594420.695881012420279
120.250668431766440.501336863532880.74933156823356
130.1821340747565150.3642681495130290.817865925243485
140.1275936012439670.2551872024879330.872406398756033
150.2256351886135210.4512703772270410.77436481138648
160.2033062080389390.4066124160778780.796693791961061
170.1699541946010270.3399083892020530.830045805398973
180.1445959887940310.2891919775880630.855404011205969
190.22508927507760.45017855015520.7749107249224
200.3480984202006710.6961968404013420.651901579799329
210.2915915145884390.5831830291768780.708408485411561
220.2409254652423420.4818509304846830.759074534757658
230.2038094683598310.4076189367196630.796190531640169
240.2043515715731990.4087031431463980.7956484284268
250.1660917995248830.3321835990497660.833908200475117
260.1335341480944340.2670682961888670.866465851905566
270.1857846757816910.3715693515633820.814215324218309
280.1750302697158080.3500605394316160.824969730284192
290.1415599985834260.2831199971668510.858440001416574
300.1459197929328330.2918395858656650.854080207067167
310.1717055320265530.3434110640531050.828294467973447
320.3068848818501630.6137697637003260.693115118149837
330.2728860683419330.5457721366838670.727113931658067
340.2536188436035790.5072376872071580.746381156396421
350.2807911536680890.5615823073361770.719208846331912
360.2848969759452440.5697939518904880.715103024054756
370.2546330359678660.5092660719357320.745366964032134
380.2296117741117990.4592235482235990.7703882258882
390.2640825866621940.5281651733243880.735917413337806
400.275966958532340.551933917064680.72403304146766
410.2417330928895440.4834661857790880.758266907110456
420.2381148731618880.4762297463237750.761885126838112
430.3623116277976950.724623255595390.637688372202305
440.5335050265860210.9329899468279580.466494973413979
450.5069911109708540.9860177780582920.493008889029146
460.4628865025163060.9257730050326110.537113497483694
470.399822137867030.799644275734060.60017786213297
480.3968093016711130.7936186033422250.603190698328887
490.3304940457654620.6609880915309240.669505954234538
500.2684874572952910.5369749145905830.731512542704709
510.2679466583491040.5358933166982070.732053341650896
520.3982250259218770.7964500518437530.601774974078124
530.3075928069392230.6151856138784470.692407193060777
540.2201829247065960.4403658494131930.779817075293404
550.3218715154076280.6437430308152560.678128484592372
560.5532233610434740.8935532779130530.446776638956526

\begin{tabular}{lllllllll}
\hline
Goldfeld-Quandt test for Heteroskedasticity \tabularnewline
p-values & Alternative Hypothesis \tabularnewline
breakpoint index & greater & 2-sided & less \tabularnewline
5 & 0.327911979442982 & 0.655823958885965 & 0.672088020557018 \tabularnewline
6 & 0.18754720495889 & 0.37509440991778 & 0.81245279504111 \tabularnewline
7 & 0.448329921598094 & 0.896659843196189 & 0.551670078401906 \tabularnewline
8 & 0.537490436143267 & 0.925019127713466 & 0.462509563856733 \tabularnewline
9 & 0.43658379603495 & 0.8731675920699 & 0.56341620396505 \tabularnewline
10 & 0.332982198298761 & 0.665964396597523 & 0.667017801701238 \tabularnewline
11 & 0.304118987579721 & 0.608237975159442 & 0.695881012420279 \tabularnewline
12 & 0.25066843176644 & 0.50133686353288 & 0.74933156823356 \tabularnewline
13 & 0.182134074756515 & 0.364268149513029 & 0.817865925243485 \tabularnewline
14 & 0.127593601243967 & 0.255187202487933 & 0.872406398756033 \tabularnewline
15 & 0.225635188613521 & 0.451270377227041 & 0.77436481138648 \tabularnewline
16 & 0.203306208038939 & 0.406612416077878 & 0.796693791961061 \tabularnewline
17 & 0.169954194601027 & 0.339908389202053 & 0.830045805398973 \tabularnewline
18 & 0.144595988794031 & 0.289191977588063 & 0.855404011205969 \tabularnewline
19 & 0.2250892750776 & 0.4501785501552 & 0.7749107249224 \tabularnewline
20 & 0.348098420200671 & 0.696196840401342 & 0.651901579799329 \tabularnewline
21 & 0.291591514588439 & 0.583183029176878 & 0.708408485411561 \tabularnewline
22 & 0.240925465242342 & 0.481850930484683 & 0.759074534757658 \tabularnewline
23 & 0.203809468359831 & 0.407618936719663 & 0.796190531640169 \tabularnewline
24 & 0.204351571573199 & 0.408703143146398 & 0.7956484284268 \tabularnewline
25 & 0.166091799524883 & 0.332183599049766 & 0.833908200475117 \tabularnewline
26 & 0.133534148094434 & 0.267068296188867 & 0.866465851905566 \tabularnewline
27 & 0.185784675781691 & 0.371569351563382 & 0.814215324218309 \tabularnewline
28 & 0.175030269715808 & 0.350060539431616 & 0.824969730284192 \tabularnewline
29 & 0.141559998583426 & 0.283119997166851 & 0.858440001416574 \tabularnewline
30 & 0.145919792932833 & 0.291839585865665 & 0.854080207067167 \tabularnewline
31 & 0.171705532026553 & 0.343411064053105 & 0.828294467973447 \tabularnewline
32 & 0.306884881850163 & 0.613769763700326 & 0.693115118149837 \tabularnewline
33 & 0.272886068341933 & 0.545772136683867 & 0.727113931658067 \tabularnewline
34 & 0.253618843603579 & 0.507237687207158 & 0.746381156396421 \tabularnewline
35 & 0.280791153668089 & 0.561582307336177 & 0.719208846331912 \tabularnewline
36 & 0.284896975945244 & 0.569793951890488 & 0.715103024054756 \tabularnewline
37 & 0.254633035967866 & 0.509266071935732 & 0.745366964032134 \tabularnewline
38 & 0.229611774111799 & 0.459223548223599 & 0.7703882258882 \tabularnewline
39 & 0.264082586662194 & 0.528165173324388 & 0.735917413337806 \tabularnewline
40 & 0.27596695853234 & 0.55193391706468 & 0.72403304146766 \tabularnewline
41 & 0.241733092889544 & 0.483466185779088 & 0.758266907110456 \tabularnewline
42 & 0.238114873161888 & 0.476229746323775 & 0.761885126838112 \tabularnewline
43 & 0.362311627797695 & 0.72462325559539 & 0.637688372202305 \tabularnewline
44 & 0.533505026586021 & 0.932989946827958 & 0.466494973413979 \tabularnewline
45 & 0.506991110970854 & 0.986017778058292 & 0.493008889029146 \tabularnewline
46 & 0.462886502516306 & 0.925773005032611 & 0.537113497483694 \tabularnewline
47 & 0.39982213786703 & 0.79964427573406 & 0.60017786213297 \tabularnewline
48 & 0.396809301671113 & 0.793618603342225 & 0.603190698328887 \tabularnewline
49 & 0.330494045765462 & 0.660988091530924 & 0.669505954234538 \tabularnewline
50 & 0.268487457295291 & 0.536974914590583 & 0.731512542704709 \tabularnewline
51 & 0.267946658349104 & 0.535893316698207 & 0.732053341650896 \tabularnewline
52 & 0.398225025921877 & 0.796450051843753 & 0.601774974078124 \tabularnewline
53 & 0.307592806939223 & 0.615185613878447 & 0.692407193060777 \tabularnewline
54 & 0.220182924706596 & 0.440365849413193 & 0.779817075293404 \tabularnewline
55 & 0.321871515407628 & 0.643743030815256 & 0.678128484592372 \tabularnewline
56 & 0.553223361043474 & 0.893553277913053 & 0.446776638956526 \tabularnewline
\hline
\end{tabular}
%Source: https://freestatistics.org/blog/index.php?pk=25798&T=5

[TABLE]
[ROW][C]Goldfeld-Quandt test for Heteroskedasticity[/C][/ROW]
[ROW][C]p-values[/C][C]Alternative Hypothesis[/C][/ROW]
[ROW][C]breakpoint index[/C][C]greater[/C][C]2-sided[/C][C]less[/C][/ROW]
[ROW][C]5[/C][C]0.327911979442982[/C][C]0.655823958885965[/C][C]0.672088020557018[/C][/ROW]
[ROW][C]6[/C][C]0.18754720495889[/C][C]0.37509440991778[/C][C]0.81245279504111[/C][/ROW]
[ROW][C]7[/C][C]0.448329921598094[/C][C]0.896659843196189[/C][C]0.551670078401906[/C][/ROW]
[ROW][C]8[/C][C]0.537490436143267[/C][C]0.925019127713466[/C][C]0.462509563856733[/C][/ROW]
[ROW][C]9[/C][C]0.43658379603495[/C][C]0.8731675920699[/C][C]0.56341620396505[/C][/ROW]
[ROW][C]10[/C][C]0.332982198298761[/C][C]0.665964396597523[/C][C]0.667017801701238[/C][/ROW]
[ROW][C]11[/C][C]0.304118987579721[/C][C]0.608237975159442[/C][C]0.695881012420279[/C][/ROW]
[ROW][C]12[/C][C]0.25066843176644[/C][C]0.50133686353288[/C][C]0.74933156823356[/C][/ROW]
[ROW][C]13[/C][C]0.182134074756515[/C][C]0.364268149513029[/C][C]0.817865925243485[/C][/ROW]
[ROW][C]14[/C][C]0.127593601243967[/C][C]0.255187202487933[/C][C]0.872406398756033[/C][/ROW]
[ROW][C]15[/C][C]0.225635188613521[/C][C]0.451270377227041[/C][C]0.77436481138648[/C][/ROW]
[ROW][C]16[/C][C]0.203306208038939[/C][C]0.406612416077878[/C][C]0.796693791961061[/C][/ROW]
[ROW][C]17[/C][C]0.169954194601027[/C][C]0.339908389202053[/C][C]0.830045805398973[/C][/ROW]
[ROW][C]18[/C][C]0.144595988794031[/C][C]0.289191977588063[/C][C]0.855404011205969[/C][/ROW]
[ROW][C]19[/C][C]0.2250892750776[/C][C]0.4501785501552[/C][C]0.7749107249224[/C][/ROW]
[ROW][C]20[/C][C]0.348098420200671[/C][C]0.696196840401342[/C][C]0.651901579799329[/C][/ROW]
[ROW][C]21[/C][C]0.291591514588439[/C][C]0.583183029176878[/C][C]0.708408485411561[/C][/ROW]
[ROW][C]22[/C][C]0.240925465242342[/C][C]0.481850930484683[/C][C]0.759074534757658[/C][/ROW]
[ROW][C]23[/C][C]0.203809468359831[/C][C]0.407618936719663[/C][C]0.796190531640169[/C][/ROW]
[ROW][C]24[/C][C]0.204351571573199[/C][C]0.408703143146398[/C][C]0.7956484284268[/C][/ROW]
[ROW][C]25[/C][C]0.166091799524883[/C][C]0.332183599049766[/C][C]0.833908200475117[/C][/ROW]
[ROW][C]26[/C][C]0.133534148094434[/C][C]0.267068296188867[/C][C]0.866465851905566[/C][/ROW]
[ROW][C]27[/C][C]0.185784675781691[/C][C]0.371569351563382[/C][C]0.814215324218309[/C][/ROW]
[ROW][C]28[/C][C]0.175030269715808[/C][C]0.350060539431616[/C][C]0.824969730284192[/C][/ROW]
[ROW][C]29[/C][C]0.141559998583426[/C][C]0.283119997166851[/C][C]0.858440001416574[/C][/ROW]
[ROW][C]30[/C][C]0.145919792932833[/C][C]0.291839585865665[/C][C]0.854080207067167[/C][/ROW]
[ROW][C]31[/C][C]0.171705532026553[/C][C]0.343411064053105[/C][C]0.828294467973447[/C][/ROW]
[ROW][C]32[/C][C]0.306884881850163[/C][C]0.613769763700326[/C][C]0.693115118149837[/C][/ROW]
[ROW][C]33[/C][C]0.272886068341933[/C][C]0.545772136683867[/C][C]0.727113931658067[/C][/ROW]
[ROW][C]34[/C][C]0.253618843603579[/C][C]0.507237687207158[/C][C]0.746381156396421[/C][/ROW]
[ROW][C]35[/C][C]0.280791153668089[/C][C]0.561582307336177[/C][C]0.719208846331912[/C][/ROW]
[ROW][C]36[/C][C]0.284896975945244[/C][C]0.569793951890488[/C][C]0.715103024054756[/C][/ROW]
[ROW][C]37[/C][C]0.254633035967866[/C][C]0.509266071935732[/C][C]0.745366964032134[/C][/ROW]
[ROW][C]38[/C][C]0.229611774111799[/C][C]0.459223548223599[/C][C]0.7703882258882[/C][/ROW]
[ROW][C]39[/C][C]0.264082586662194[/C][C]0.528165173324388[/C][C]0.735917413337806[/C][/ROW]
[ROW][C]40[/C][C]0.27596695853234[/C][C]0.55193391706468[/C][C]0.72403304146766[/C][/ROW]
[ROW][C]41[/C][C]0.241733092889544[/C][C]0.483466185779088[/C][C]0.758266907110456[/C][/ROW]
[ROW][C]42[/C][C]0.238114873161888[/C][C]0.476229746323775[/C][C]0.761885126838112[/C][/ROW]
[ROW][C]43[/C][C]0.362311627797695[/C][C]0.72462325559539[/C][C]0.637688372202305[/C][/ROW]
[ROW][C]44[/C][C]0.533505026586021[/C][C]0.932989946827958[/C][C]0.466494973413979[/C][/ROW]
[ROW][C]45[/C][C]0.506991110970854[/C][C]0.986017778058292[/C][C]0.493008889029146[/C][/ROW]
[ROW][C]46[/C][C]0.462886502516306[/C][C]0.925773005032611[/C][C]0.537113497483694[/C][/ROW]
[ROW][C]47[/C][C]0.39982213786703[/C][C]0.79964427573406[/C][C]0.60017786213297[/C][/ROW]
[ROW][C]48[/C][C]0.396809301671113[/C][C]0.793618603342225[/C][C]0.603190698328887[/C][/ROW]
[ROW][C]49[/C][C]0.330494045765462[/C][C]0.660988091530924[/C][C]0.669505954234538[/C][/ROW]
[ROW][C]50[/C][C]0.268487457295291[/C][C]0.536974914590583[/C][C]0.731512542704709[/C][/ROW]
[ROW][C]51[/C][C]0.267946658349104[/C][C]0.535893316698207[/C][C]0.732053341650896[/C][/ROW]
[ROW][C]52[/C][C]0.398225025921877[/C][C]0.796450051843753[/C][C]0.601774974078124[/C][/ROW]
[ROW][C]53[/C][C]0.307592806939223[/C][C]0.615185613878447[/C][C]0.692407193060777[/C][/ROW]
[ROW][C]54[/C][C]0.220182924706596[/C][C]0.440365849413193[/C][C]0.779817075293404[/C][/ROW]
[ROW][C]55[/C][C]0.321871515407628[/C][C]0.643743030815256[/C][C]0.678128484592372[/C][/ROW]
[ROW][C]56[/C][C]0.553223361043474[/C][C]0.893553277913053[/C][C]0.446776638956526[/C][/ROW]
[/TABLE]
Source: https://freestatistics.org/blog/index.php?pk=25798&T=5

Globally Unique Identifier (entire table): ba.freestatistics.org/blog/index.php?pk=25798&T=5

As an alternative you can also use a QR Code:  

The GUIDs for individual cells are displayed in the table below:

Goldfeld-Quandt test for Heteroskedasticity
p-valuesAlternative Hypothesis
breakpoint indexgreater2-sidedless
50.3279119794429820.6558239588859650.672088020557018
60.187547204958890.375094409917780.81245279504111
70.4483299215980940.8966598431961890.551670078401906
80.5374904361432670.9250191277134660.462509563856733
90.436583796034950.87316759206990.56341620396505
100.3329821982987610.6659643965975230.667017801701238
110.3041189875797210.6082379751594420.695881012420279
120.250668431766440.501336863532880.74933156823356
130.1821340747565150.3642681495130290.817865925243485
140.1275936012439670.2551872024879330.872406398756033
150.2256351886135210.4512703772270410.77436481138648
160.2033062080389390.4066124160778780.796693791961061
170.1699541946010270.3399083892020530.830045805398973
180.1445959887940310.2891919775880630.855404011205969
190.22508927507760.45017855015520.7749107249224
200.3480984202006710.6961968404013420.651901579799329
210.2915915145884390.5831830291768780.708408485411561
220.2409254652423420.4818509304846830.759074534757658
230.2038094683598310.4076189367196630.796190531640169
240.2043515715731990.4087031431463980.7956484284268
250.1660917995248830.3321835990497660.833908200475117
260.1335341480944340.2670682961888670.866465851905566
270.1857846757816910.3715693515633820.814215324218309
280.1750302697158080.3500605394316160.824969730284192
290.1415599985834260.2831199971668510.858440001416574
300.1459197929328330.2918395858656650.854080207067167
310.1717055320265530.3434110640531050.828294467973447
320.3068848818501630.6137697637003260.693115118149837
330.2728860683419330.5457721366838670.727113931658067
340.2536188436035790.5072376872071580.746381156396421
350.2807911536680890.5615823073361770.719208846331912
360.2848969759452440.5697939518904880.715103024054756
370.2546330359678660.5092660719357320.745366964032134
380.2296117741117990.4592235482235990.7703882258882
390.2640825866621940.5281651733243880.735917413337806
400.275966958532340.551933917064680.72403304146766
410.2417330928895440.4834661857790880.758266907110456
420.2381148731618880.4762297463237750.761885126838112
430.3623116277976950.724623255595390.637688372202305
440.5335050265860210.9329899468279580.466494973413979
450.5069911109708540.9860177780582920.493008889029146
460.4628865025163060.9257730050326110.537113497483694
470.399822137867030.799644275734060.60017786213297
480.3968093016711130.7936186033422250.603190698328887
490.3304940457654620.6609880915309240.669505954234538
500.2684874572952910.5369749145905830.731512542704709
510.2679466583491040.5358933166982070.732053341650896
520.3982250259218770.7964500518437530.601774974078124
530.3075928069392230.6151856138784470.692407193060777
540.2201829247065960.4403658494131930.779817075293404
550.3218715154076280.6437430308152560.678128484592372
560.5532233610434740.8935532779130530.446776638956526


Meta Analysis of Goldfeld-Quandt test for Heteroskedasticity
Description# significant tests% significant testsOK/NOK
1% type I error level00OK
5% type I error level00OK
10% type I error level00OK

\begin{tabular}{lllllllll}
\hline
Meta Analysis of Goldfeld-Quandt test for Heteroskedasticity \tabularnewline
Description & # significant tests & % significant tests & OK/NOK \tabularnewline
1% type I error level & 0 & 0 & OK \tabularnewline
5% type I error level & 0 & 0 & OK \tabularnewline
10% type I error level & 0 & 0 & OK \tabularnewline
\hline
\end{tabular}
%Source: https://freestatistics.org/blog/index.php?pk=25798&T=6

[TABLE]
[ROW][C]Meta Analysis of Goldfeld-Quandt test for Heteroskedasticity[/C][/ROW]
[ROW][C]Description[/C][C]# significant tests[/C][C]% significant tests[/C][C]OK/NOK[/C][/ROW]
[ROW][C]1% type I error level[/C][C]0[/C][C]0[/C][C]OK[/C][/ROW]
[ROW][C]5% type I error level[/C][C]0[/C][C]0[/C][C]OK[/C][/ROW]
[ROW][C]10% type I error level[/C][C]0[/C][C]0[/C][C]OK[/C][/ROW]
[/TABLE]
Source: https://freestatistics.org/blog/index.php?pk=25798&T=6

Globally Unique Identifier (entire table): ba.freestatistics.org/blog/index.php?pk=25798&T=6

As an alternative you can also use a QR Code:  

The GUIDs for individual cells are displayed in the table below:

Meta Analysis of Goldfeld-Quandt test for Heteroskedasticity
Description# significant tests% significant testsOK/NOK
1% type I error level00OK
5% type I error level00OK
10% type I error level00OK


Parameters (Session):
par1 = 1 ; par2 = Do not include Seasonal Dummies ; par3 = No Linear Trend ;
Parameters (R input):
par1 = 1 ; par2 = Do not include Seasonal Dummies ; par3 = No Linear Trend ;
R code (references can be found in the software module):
library(lattice)
library(lmtest)
n25 <- 25 #minimum number of obs. for Goldfeld-Quandt test
par1 <- as.numeric(par1)
x <- t(y)
k <- length(x[1,])
n <- length(x[,1])
x1 <- cbind(x[,par1], x[,1:k!=par1])
mycolnames <- c(colnames(x)[par1], colnames(x)[1:k!=par1])
colnames(x1) <- mycolnames #colnames(x)[par1]
x <- x1
if (par3 == 'First Differences'){
x2 <- array(0, dim=c(n-1,k), dimnames=list(1:(n-1), paste('(1-B)',colnames(x),sep='')))
for (i in 1:n-1) {
for (j in 1:k) {
x2[i,j] <- x[i+1,j] - x[i,j]
}
}
x <- x2
}
if (par2 == 'Include Monthly Dummies'){
x2 <- array(0, dim=c(n,11), dimnames=list(1:n, paste('M', seq(1:11), sep ='')))
for (i in 1:11){
x2[seq(i,n,12),i] <- 1
}
x <- cbind(x, x2)
}
if (par2 == 'Include Quarterly Dummies'){
x2 <- array(0, dim=c(n,3), dimnames=list(1:n, paste('Q', seq(1:3), sep ='')))
for (i in 1:3){
x2[seq(i,n,4),i] <- 1
}
x <- cbind(x, x2)
}
k <- length(x[1,])
if (par3 == 'Linear Trend'){
x <- cbind(x, c(1:n))
colnames(x)[k+1] <- 't'
}
x
k <- length(x[1,])
df <- as.data.frame(x)
(mylm <- lm(df))
(mysum <- summary(mylm))
if (n > n25) {
kp3 <- k + 3
nmkm3 <- n - k - 3
gqarr <- array(NA, dim=c(nmkm3-kp3+1,3))
numgqtests <- 0
numsignificant1 <- 0
numsignificant5 <- 0
numsignificant10 <- 0
for (mypoint in kp3:nmkm3) {
j <- 0
numgqtests <- numgqtests + 1
for (myalt in c('greater', 'two.sided', 'less')) {
j <- j + 1
gqarr[mypoint-kp3+1,j] <- gqtest(mylm, point=mypoint, alternative=myalt)$p.value
}
if (gqarr[mypoint-kp3+1,2] < 0.01) numsignificant1 <- numsignificant1 + 1
if (gqarr[mypoint-kp3+1,2] < 0.05) numsignificant5 <- numsignificant5 + 1
if (gqarr[mypoint-kp3+1,2] < 0.10) numsignificant10 <- numsignificant10 + 1
}
gqarr
}
bitmap(file='test0.png')
plot(x[,1], type='l', main='Actuals and Interpolation', ylab='value of Actuals and Interpolation (dots)', xlab='time or index')
points(x[,1]-mysum$resid)
grid()
dev.off()
bitmap(file='test1.png')
plot(mysum$resid, type='b', pch=19, main='Residuals', ylab='value of Residuals', xlab='time or index')
grid()
dev.off()
bitmap(file='test2.png')
hist(mysum$resid, main='Residual Histogram', xlab='values of Residuals')
grid()
dev.off()
bitmap(file='test3.png')
densityplot(~mysum$resid,col='black',main='Residual Density Plot', xlab='values of Residuals')
dev.off()
bitmap(file='test4.png')
qqnorm(mysum$resid, main='Residual Normal Q-Q Plot')
qqline(mysum$resid)
grid()
dev.off()
(myerror <- as.ts(mysum$resid))
bitmap(file='test5.png')
dum <- cbind(lag(myerror,k=1),myerror)
dum
dum1 <- dum[2:length(myerror),]
dum1
z <- as.data.frame(dum1)
z
plot(z,main=paste('Residual Lag plot, lowess, and regression line'), ylab='values of Residuals', xlab='lagged values of Residuals')
lines(lowess(z))
abline(lm(z))
grid()
dev.off()
bitmap(file='test6.png')
acf(mysum$resid, lag.max=length(mysum$resid)/2, main='Residual Autocorrelation Function')
grid()
dev.off()
bitmap(file='test7.png')
pacf(mysum$resid, lag.max=length(mysum$resid)/2, main='Residual Partial Autocorrelation Function')
grid()
dev.off()
bitmap(file='test8.png')
opar <- par(mfrow = c(2,2), oma = c(0, 0, 1.1, 0))
plot(mylm, las = 1, sub='Residual Diagnostics')
par(opar)
dev.off()
if (n > n25) {
bitmap(file='test9.png')
plot(kp3:nmkm3,gqarr[,2], main='Goldfeld-Quandt test',ylab='2-sided p-value',xlab='breakpoint')
grid()
dev.off()
}
load(file='createtable')
a<-table.start()
a<-table.row.start(a)
a<-table.element(a, 'Multiple Linear Regression - Estimated Regression Equation', 1, TRUE)
a<-table.row.end(a)
myeq <- colnames(x)[1]
myeq <- paste(myeq, '[t] = ', sep='')
for (i in 1:k){
if (mysum$coefficients[i,1] > 0) myeq <- paste(myeq, '+', '')
myeq <- paste(myeq, mysum$coefficients[i,1], sep=' ')
if (rownames(mysum$coefficients)[i] != '(Intercept)') {
myeq <- paste(myeq, rownames(mysum$coefficients)[i], sep='')
if (rownames(mysum$coefficients)[i] != 't') myeq <- paste(myeq, '[t]', sep='')
}
}
myeq <- paste(myeq, ' + e[t]')
a<-table.row.start(a)
a<-table.element(a, myeq)
a<-table.row.end(a)
a<-table.end(a)
table.save(a,file='mytable1.tab')
a<-table.start()
a<-table.row.start(a)
a<-table.element(a,hyperlink('ols1.htm','Multiple Linear Regression - Ordinary Least Squares',''), 6, TRUE)
a<-table.row.end(a)
a<-table.row.start(a)
a<-table.element(a,'Variable',header=TRUE)
a<-table.element(a,'Parameter',header=TRUE)
a<-table.element(a,'S.D.',header=TRUE)
a<-table.element(a,'T-STAT
H0: parameter = 0',header=TRUE)
a<-table.element(a,'2-tail p-value',header=TRUE)
a<-table.element(a,'1-tail p-value',header=TRUE)
a<-table.row.end(a)
for (i in 1:k){
a<-table.row.start(a)
a<-table.element(a,rownames(mysum$coefficients)[i],header=TRUE)
a<-table.element(a,mysum$coefficients[i,1])
a<-table.element(a, round(mysum$coefficients[i,2],6))
a<-table.element(a, round(mysum$coefficients[i,3],4))
a<-table.element(a, round(mysum$coefficients[i,4],6))
a<-table.element(a, round(mysum$coefficients[i,4]/2,6))
a<-table.row.end(a)
}
a<-table.end(a)
table.save(a,file='mytable2.tab')
a<-table.start()
a<-table.row.start(a)
a<-table.element(a, 'Multiple Linear Regression - Regression Statistics', 2, TRUE)
a<-table.row.end(a)
a<-table.row.start(a)
a<-table.element(a, 'Multiple R',1,TRUE)
a<-table.element(a, sqrt(mysum$r.squared))
a<-table.row.end(a)
a<-table.row.start(a)
a<-table.element(a, 'R-squared',1,TRUE)
a<-table.element(a, mysum$r.squared)
a<-table.row.end(a)
a<-table.row.start(a)
a<-table.element(a, 'Adjusted R-squared',1,TRUE)
a<-table.element(a, mysum$adj.r.squared)
a<-table.row.end(a)
a<-table.row.start(a)
a<-table.element(a, 'F-TEST (value)',1,TRUE)
a<-table.element(a, mysum$fstatistic[1])
a<-table.row.end(a)
a<-table.row.start(a)
a<-table.element(a, 'F-TEST (DF numerator)',1,TRUE)
a<-table.element(a, mysum$fstatistic[2])
a<-table.row.end(a)
a<-table.row.start(a)
a<-table.element(a, 'F-TEST (DF denominator)',1,TRUE)
a<-table.element(a, mysum$fstatistic[3])
a<-table.row.end(a)
a<-table.row.start(a)
a<-table.element(a, 'p-value',1,TRUE)
a<-table.element(a, 1-pf(mysum$fstatistic[1],mysum$fstatistic[2],mysum$fstatistic[3]))
a<-table.row.end(a)
a<-table.row.start(a)
a<-table.element(a, 'Multiple Linear Regression - Residual Statistics', 2, TRUE)
a<-table.row.end(a)
a<-table.row.start(a)
a<-table.element(a, 'Residual Standard Deviation',1,TRUE)
a<-table.element(a, mysum$sigma)
a<-table.row.end(a)
a<-table.row.start(a)
a<-table.element(a, 'Sum Squared Residuals',1,TRUE)
a<-table.element(a, sum(myerror*myerror))
a<-table.row.end(a)
a<-table.end(a)
table.save(a,file='mytable3.tab')
a<-table.start()
a<-table.row.start(a)
a<-table.element(a, 'Multiple Linear Regression - Actuals, Interpolation, and Residuals', 4, TRUE)
a<-table.row.end(a)
a<-table.row.start(a)
a<-table.element(a, 'Time or Index', 1, TRUE)
a<-table.element(a, 'Actuals', 1, TRUE)
a<-table.element(a, 'Interpolation
Forecast', 1, TRUE)
a<-table.element(a, 'Residuals
Prediction Error', 1, TRUE)
a<-table.row.end(a)
for (i in 1:n) {
a<-table.row.start(a)
a<-table.element(a,i, 1, TRUE)
a<-table.element(a,x[i])
a<-table.element(a,x[i]-mysum$resid[i])
a<-table.element(a,mysum$resid[i])
a<-table.row.end(a)
}
a<-table.end(a)
table.save(a,file='mytable4.tab')
if (n > n25) {
a<-table.start()
a<-table.row.start(a)
a<-table.element(a,'Goldfeld-Quandt test for Heteroskedasticity',4,TRUE)
a<-table.row.end(a)
a<-table.row.start(a)
a<-table.element(a,'p-values',header=TRUE)
a<-table.element(a,'Alternative Hypothesis',3,header=TRUE)
a<-table.row.end(a)
a<-table.row.start(a)
a<-table.element(a,'breakpoint index',header=TRUE)
a<-table.element(a,'greater',header=TRUE)
a<-table.element(a,'2-sided',header=TRUE)
a<-table.element(a,'less',header=TRUE)
a<-table.row.end(a)
for (mypoint in kp3:nmkm3) {
a<-table.row.start(a)
a<-table.element(a,mypoint,header=TRUE)
a<-table.element(a,gqarr[mypoint-kp3+1,1])
a<-table.element(a,gqarr[mypoint-kp3+1,2])
a<-table.element(a,gqarr[mypoint-kp3+1,3])
a<-table.row.end(a)
}
a<-table.end(a)
table.save(a,file='mytable5.tab')
a<-table.start()
a<-table.row.start(a)
a<-table.element(a,'Meta Analysis of Goldfeld-Quandt test for Heteroskedasticity',4,TRUE)
a<-table.row.end(a)
a<-table.row.start(a)
a<-table.element(a,'Description',header=TRUE)
a<-table.element(a,'# significant tests',header=TRUE)
a<-table.element(a,'% significant tests',header=TRUE)
a<-table.element(a,'OK/NOK',header=TRUE)
a<-table.row.end(a)
a<-table.row.start(a)
a<-table.element(a,'1% type I error level',header=TRUE)
a<-table.element(a,numsignificant1)
a<-table.element(a,numsignificant1/numgqtests)
if (numsignificant1/numgqtests < 0.01) dum <- 'OK' else dum <- 'NOK'
a<-table.element(a,dum)
a<-table.row.end(a)
a<-table.row.start(a)
a<-table.element(a,'5% type I error level',header=TRUE)
a<-table.element(a,numsignificant5)
a<-table.element(a,numsignificant5/numgqtests)
if (numsignificant5/numgqtests < 0.05) dum <- 'OK' else dum <- 'NOK'
a<-table.element(a,dum)
a<-table.row.end(a)
a<-table.row.start(a)
a<-table.element(a,'10% type I error level',header=TRUE)
a<-table.element(a,numsignificant10)
a<-table.element(a,numsignificant10/numgqtests)
if (numsignificant10/numgqtests < 0.1) dum <- 'OK' else dum <- 'NOK'
a<-table.element(a,dum)
a<-table.row.end(a)
a<-table.end(a)
table.save(a,file='mytable6.tab')
}