Free Statistics

of Irreproducible Research!

Author's title

Author*Unverified author*
R Software Modulerwasp_multipleregression.wasp
Title produced by softwareMultiple Regression
Date of computationThu, 27 Nov 2008 05:43:33 -0700
Cite this page as followsStatistical Computations at FreeStatistics.org, Office for Research Development and Education, URL https://freestatistics.org/blog/index.php?v=date/2008/Nov/27/t1227789889e6shtt5htf90aq0.htm/, Retrieved Mon, 20 May 2024 10:36:34 +0000
Statistical Computations at FreeStatistics.org, Office for Research Development and Education, URL https://freestatistics.org/blog/index.php?pk=25792, Retrieved Mon, 20 May 2024 10:36:34 +0000
QR Codes:

Original text written by user:
IsPrivate?No (this computation is public)
User-defined keywords
Estimated Impact187
Family? (F = Feedback message, R = changed R code, M = changed R Module, P = changed Parameters, D = changed Data)
-     [Multiple Regression] [Q1 The Seatbeltlaw] [2007-11-14 19:27:43] [8cd6641b921d30ebe00b648d1481bba0]
F    D  [Multiple Regression] [seatbelt Q1] [2008-11-27 09:23:12] [74be16979710d4c4e7c6647856088456]
F    D      [Multiple Regression] [Q3] [2008-11-27 12:43:33] [1a15026c70cce1c14dcfcc267c5d8133] [Current]
Feedback Forum
2008-11-30 14:06:25 [Britt Severijns] [reply
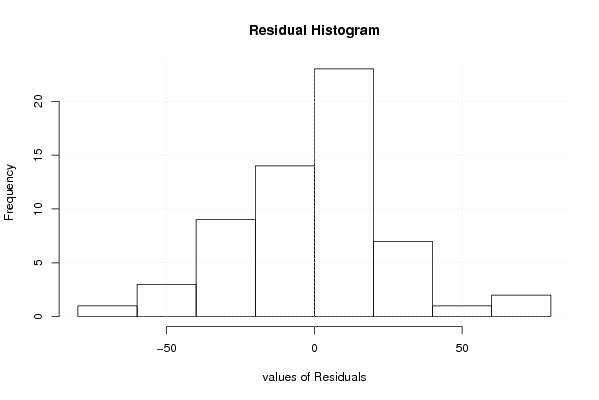
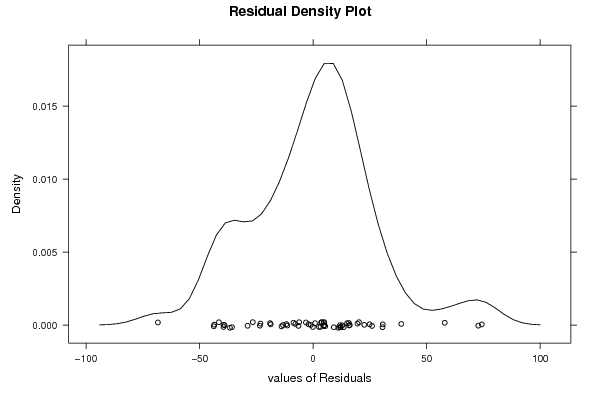
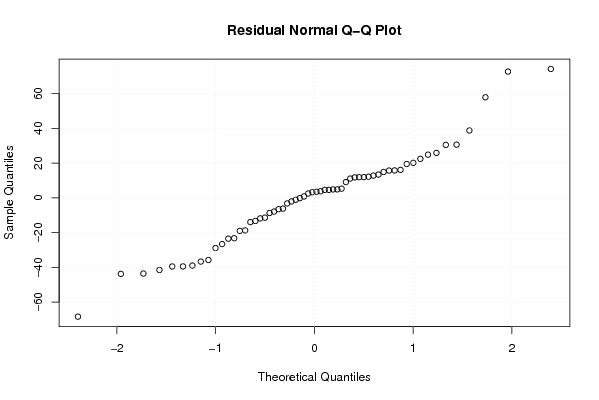
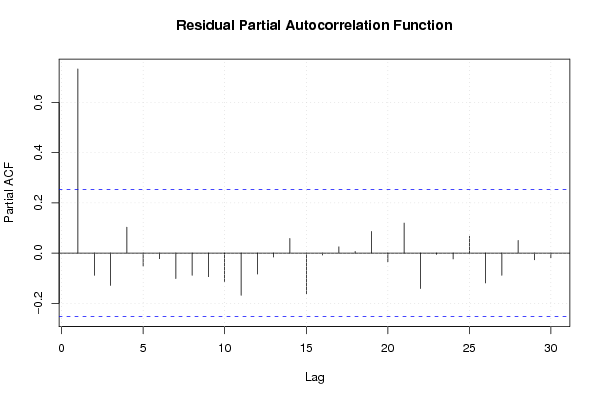
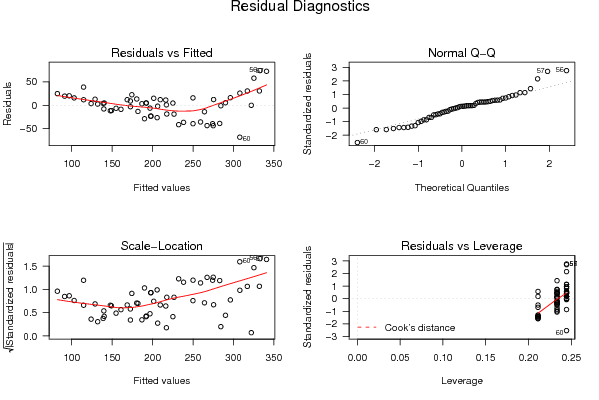
De stijging kan zoals de student heeft opgemerkt te wijten zijn aan toeval. (p-waarden zijn groter dan 5%). Als men de residuals bekijkt zie je dat het model toch nog wel wat verbetert kan woorden. Er is niet voldaan aan alle assumpties en er zijn geen normaalverdelingen te zien.
2008-12-01 17:45:34 [Angelique Van de Vijver] [reply
goede berekening en juiste uileg van de verschillende termen uit de tabel. Goed om antwoord te staven met getallen. Grafieken juist geïnterpreteerd. De voorspellingsfouten lopen wel niet volledig volgens een normaalverdeling en het gemiddelde hiervan zal ook niet gelijk aan 0 zijn. De student kon ook nog vermelden dat de absolute waarden van sommige T-statistieken groter zijn dan 2. Hier is er dan sprake van een significant verschil. De meesten zijn kleiner dan 2 dus hier is er dan geen sprake van een significant verschil en is er toeval bij betrokken.

Post a new message
Dataseries X:
107,1	0
110,7	0
117,1	0
118,7	0
126,5	0
127,5	0
134,6	0
131,8	0
135,9	0
142,7	0
141,7	0
153,4	0
145,0	0
137,7	0
148,3	0
152,2	0
169,4	0
168,6	0
161,1	0
174,1	0
179,0	0
190,6	0
190,0	0
181,6	0
174,8	0
180,5	1
196,8	1
193,8	1
197,0	1
216,3	1
221,4	1
217,9	1
229,7	1
227,4	1
204,2	1
196,6	1
198,8	1
207,5	1
190,7	1
201,6	1
210,5	1
223,5	1
223,8	1
231,2	1
244,0	1
234,7	1
250,2	1
265,7	1
287,6	1
283,3	1
295,4	1
312,3	1
333,8	1
347,7	1
383,2	1
407,1	1
413,6	1
362,7	1
321,9	1
239,4	1


Summary of computational transaction
Raw Inputview raw input (R code)
Raw Outputview raw output of R engine
Computing time5 seconds
R Server'Sir Ronald Aylmer Fisher' @ 193.190.124.24

\begin{tabular}{lllllllll}
\hline
Summary of computational transaction \tabularnewline
Raw Input & view raw input (R code)  \tabularnewline
Raw Output & view raw output of R engine  \tabularnewline
Computing time & 5 seconds \tabularnewline
R Server & 'Sir Ronald Aylmer Fisher' @ 193.190.124.24 \tabularnewline
\hline
\end{tabular}
%Source: https://freestatistics.org/blog/index.php?pk=25792&T=0

[TABLE]
[ROW][C]Summary of computational transaction[/C][/ROW]
[ROW][C]Raw Input[/C][C]view raw input (R code) [/C][/ROW]
[ROW][C]Raw Output[/C][C]view raw output of R engine [/C][/ROW]
[ROW][C]Computing time[/C][C]5 seconds[/C][/ROW]
[ROW][C]R Server[/C][C]'Sir Ronald Aylmer Fisher' @ 193.190.124.24[/C][/ROW]
[/TABLE]
Source: https://freestatistics.org/blog/index.php?pk=25792&T=0

Globally Unique Identifier (entire table): ba.freestatistics.org/blog/index.php?pk=25792&T=0

As an alternative you can also use a QR Code:  

The GUIDs for individual cells are displayed in the table below:

Summary of computational transaction
Raw Inputview raw input (R code)
Raw Outputview raw output of R engine
Computing time5 seconds
R Server'Sir Ronald Aylmer Fisher' @ 193.190.124.24


Multiple Linear Regression - Estimated Regression Equation
PIC_grondstoffen[t] = + 56.69 -38.4000000000001Dummy[t] + 20.7119444444444M1[t] + 24.8472222222222M2[t] + 25.7425M3[t] + 26.9777777777778M4[t] + 33.8730555555556M5[t] + 38.3283333333333M6[t] + 41.6036111111111M7[t] + 44.3788888888889M8[t] + 47.5741666666667M9[t] + 33.9294444444444M10[t] + 19.0847222222222M11[t] + 4.82472222222222t + e[t]

\begin{tabular}{lllllllll}
\hline
Multiple Linear Regression - Estimated Regression Equation \tabularnewline
PIC_grondstoffen[t] =  +  56.69 -38.4000000000001Dummy[t] +  20.7119444444444M1[t] +  24.8472222222222M2[t] +  25.7425M3[t] +  26.9777777777778M4[t] +  33.8730555555556M5[t] +  38.3283333333333M6[t] +  41.6036111111111M7[t] +  44.3788888888889M8[t] +  47.5741666666667M9[t] +  33.9294444444444M10[t] +  19.0847222222222M11[t] +  4.82472222222222t  + e[t] \tabularnewline
\hline
\end{tabular}
%Source: https://freestatistics.org/blog/index.php?pk=25792&T=1

[TABLE]
[ROW][C]Multiple Linear Regression - Estimated Regression Equation[/C][/ROW]
[ROW][C]PIC_grondstoffen[t] =  +  56.69 -38.4000000000001Dummy[t] +  20.7119444444444M1[t] +  24.8472222222222M2[t] +  25.7425M3[t] +  26.9777777777778M4[t] +  33.8730555555556M5[t] +  38.3283333333333M6[t] +  41.6036111111111M7[t] +  44.3788888888889M8[t] +  47.5741666666667M9[t] +  33.9294444444444M10[t] +  19.0847222222222M11[t] +  4.82472222222222t  + e[t][/C][/ROW]
[/TABLE]
Source: https://freestatistics.org/blog/index.php?pk=25792&T=1

Globally Unique Identifier (entire table): ba.freestatistics.org/blog/index.php?pk=25792&T=1

As an alternative you can also use a QR Code:  

The GUIDs for individual cells are displayed in the table below:

Multiple Linear Regression - Estimated Regression Equation
PIC_grondstoffen[t] = + 56.69 -38.4000000000001Dummy[t] + 20.7119444444444M1[t] + 24.8472222222222M2[t] + 25.7425M3[t] + 26.9777777777778M4[t] + 33.8730555555556M5[t] + 38.3283333333333M6[t] + 41.6036111111111M7[t] + 44.3788888888889M8[t] + 47.5741666666667M9[t] + 33.9294444444444M10[t] + 19.0847222222222M11[t] + 4.82472222222222t + e[t]


Multiple Linear Regression - Ordinary Least Squares
VariableParameterS.D.T-STATH0: parameter = 02-tail p-value1-tail p-value
(Intercept)56.6916.953643.34380.001650.000825
Dummy-38.400000000000116.313647-2.35390.0229070.011454
M120.711944444444419.7848521.04690.3006340.150317
M224.847222222222220.1348571.2340.2234560.111728
M325.742520.0299441.28520.2051560.102578
M426.977777777777819.9356061.35320.182590.091295
M533.873055555555619.8519951.70630.09470.04735
M638.328333333333319.7792461.93780.05880.0294
M741.603611111111119.717482.110.0403290.020165
M844.378888888888919.6667992.25650.0288320.014416
M947.574166666666719.6272912.42390.0193460.009673
M1033.929444444444419.5990221.73120.0901230.045061
M1119.084722222222219.582040.97460.3348550.167427
t4.824722222222220.47093410.24500

\begin{tabular}{lllllllll}
\hline
Multiple Linear Regression - Ordinary Least Squares \tabularnewline
Variable & Parameter & S.D. & T-STATH0: parameter = 0 & 2-tail p-value & 1-tail p-value \tabularnewline
(Intercept) & 56.69 & 16.95364 & 3.3438 & 0.00165 & 0.000825 \tabularnewline
Dummy & -38.4000000000001 & 16.313647 & -2.3539 & 0.022907 & 0.011454 \tabularnewline
M1 & 20.7119444444444 & 19.784852 & 1.0469 & 0.300634 & 0.150317 \tabularnewline
M2 & 24.8472222222222 & 20.134857 & 1.234 & 0.223456 & 0.111728 \tabularnewline
M3 & 25.7425 & 20.029944 & 1.2852 & 0.205156 & 0.102578 \tabularnewline
M4 & 26.9777777777778 & 19.935606 & 1.3532 & 0.18259 & 0.091295 \tabularnewline
M5 & 33.8730555555556 & 19.851995 & 1.7063 & 0.0947 & 0.04735 \tabularnewline
M6 & 38.3283333333333 & 19.779246 & 1.9378 & 0.0588 & 0.0294 \tabularnewline
M7 & 41.6036111111111 & 19.71748 & 2.11 & 0.040329 & 0.020165 \tabularnewline
M8 & 44.3788888888889 & 19.666799 & 2.2565 & 0.028832 & 0.014416 \tabularnewline
M9 & 47.5741666666667 & 19.627291 & 2.4239 & 0.019346 & 0.009673 \tabularnewline
M10 & 33.9294444444444 & 19.599022 & 1.7312 & 0.090123 & 0.045061 \tabularnewline
M11 & 19.0847222222222 & 19.58204 & 0.9746 & 0.334855 & 0.167427 \tabularnewline
t & 4.82472222222222 & 0.470934 & 10.245 & 0 & 0 \tabularnewline
\hline
\end{tabular}
%Source: https://freestatistics.org/blog/index.php?pk=25792&T=2

[TABLE]
[ROW][C]Multiple Linear Regression - Ordinary Least Squares[/C][/ROW]
[ROW][C]Variable[/C][C]Parameter[/C][C]S.D.[/C][C]T-STATH0: parameter = 0[/C][C]2-tail p-value[/C][C]1-tail p-value[/C][/ROW]
[ROW][C](Intercept)[/C][C]56.69[/C][C]16.95364[/C][C]3.3438[/C][C]0.00165[/C][C]0.000825[/C][/ROW]
[ROW][C]Dummy[/C][C]-38.4000000000001[/C][C]16.313647[/C][C]-2.3539[/C][C]0.022907[/C][C]0.011454[/C][/ROW]
[ROW][C]M1[/C][C]20.7119444444444[/C][C]19.784852[/C][C]1.0469[/C][C]0.300634[/C][C]0.150317[/C][/ROW]
[ROW][C]M2[/C][C]24.8472222222222[/C][C]20.134857[/C][C]1.234[/C][C]0.223456[/C][C]0.111728[/C][/ROW]
[ROW][C]M3[/C][C]25.7425[/C][C]20.029944[/C][C]1.2852[/C][C]0.205156[/C][C]0.102578[/C][/ROW]
[ROW][C]M4[/C][C]26.9777777777778[/C][C]19.935606[/C][C]1.3532[/C][C]0.18259[/C][C]0.091295[/C][/ROW]
[ROW][C]M5[/C][C]33.8730555555556[/C][C]19.851995[/C][C]1.7063[/C][C]0.0947[/C][C]0.04735[/C][/ROW]
[ROW][C]M6[/C][C]38.3283333333333[/C][C]19.779246[/C][C]1.9378[/C][C]0.0588[/C][C]0.0294[/C][/ROW]
[ROW][C]M7[/C][C]41.6036111111111[/C][C]19.71748[/C][C]2.11[/C][C]0.040329[/C][C]0.020165[/C][/ROW]
[ROW][C]M8[/C][C]44.3788888888889[/C][C]19.666799[/C][C]2.2565[/C][C]0.028832[/C][C]0.014416[/C][/ROW]
[ROW][C]M9[/C][C]47.5741666666667[/C][C]19.627291[/C][C]2.4239[/C][C]0.019346[/C][C]0.009673[/C][/ROW]
[ROW][C]M10[/C][C]33.9294444444444[/C][C]19.599022[/C][C]1.7312[/C][C]0.090123[/C][C]0.045061[/C][/ROW]
[ROW][C]M11[/C][C]19.0847222222222[/C][C]19.58204[/C][C]0.9746[/C][C]0.334855[/C][C]0.167427[/C][/ROW]
[ROW][C]t[/C][C]4.82472222222222[/C][C]0.470934[/C][C]10.245[/C][C]0[/C][C]0[/C][/ROW]
[/TABLE]
Source: https://freestatistics.org/blog/index.php?pk=25792&T=2

Globally Unique Identifier (entire table): ba.freestatistics.org/blog/index.php?pk=25792&T=2

As an alternative you can also use a QR Code:  

The GUIDs for individual cells are displayed in the table below:

Multiple Linear Regression - Ordinary Least Squares
VariableParameterS.D.T-STATH0: parameter = 02-tail p-value1-tail p-value
(Intercept)56.6916.953643.34380.001650.000825
Dummy-38.400000000000116.313647-2.35390.0229070.011454
M120.711944444444419.7848521.04690.3006340.150317
M224.847222222222220.1348571.2340.2234560.111728
M325.742520.0299441.28520.2051560.102578
M426.977777777777819.9356061.35320.182590.091295
M533.873055555555619.8519951.70630.09470.04735
M638.328333333333319.7792461.93780.05880.0294
M741.603611111111119.717482.110.0403290.020165
M844.378888888888919.6667992.25650.0288320.014416
M947.574166666666719.6272912.42390.0193460.009673
M1033.929444444444419.5990221.73120.0901230.045061
M1119.084722222222219.582040.97460.3348550.167427
t4.824722222222220.47093410.24500


Multiple Linear Regression - Regression Statistics
Multiple R0.930648906349803
R-squared0.866107386890084
Adjusted R-squared0.828268170141629
F-TEST (value)22.8891467983532
F-TEST (DF numerator)13
F-TEST (DF denominator)46
p-value8.88178419700125e-16
Multiple Linear Regression - Residual Statistics
Residual Standard Deviation30.9529694672511
Sum Squared Residuals44071.9706666667

\begin{tabular}{lllllllll}
\hline
Multiple Linear Regression - Regression Statistics \tabularnewline
Multiple R & 0.930648906349803 \tabularnewline
R-squared & 0.866107386890084 \tabularnewline
Adjusted R-squared & 0.828268170141629 \tabularnewline
F-TEST (value) & 22.8891467983532 \tabularnewline
F-TEST (DF numerator) & 13 \tabularnewline
F-TEST (DF denominator) & 46 \tabularnewline
p-value & 8.88178419700125e-16 \tabularnewline
Multiple Linear Regression - Residual Statistics \tabularnewline
Residual Standard Deviation & 30.9529694672511 \tabularnewline
Sum Squared Residuals & 44071.9706666667 \tabularnewline
\hline
\end{tabular}
%Source: https://freestatistics.org/blog/index.php?pk=25792&T=3

[TABLE]
[ROW][C]Multiple Linear Regression - Regression Statistics[/C][/ROW]
[ROW][C]Multiple R[/C][C]0.930648906349803[/C][/ROW]
[ROW][C]R-squared[/C][C]0.866107386890084[/C][/ROW]
[ROW][C]Adjusted R-squared[/C][C]0.828268170141629[/C][/ROW]
[ROW][C]F-TEST (value)[/C][C]22.8891467983532[/C][/ROW]
[ROW][C]F-TEST (DF numerator)[/C][C]13[/C][/ROW]
[ROW][C]F-TEST (DF denominator)[/C][C]46[/C][/ROW]
[ROW][C]p-value[/C][C]8.88178419700125e-16[/C][/ROW]
[ROW][C]Multiple Linear Regression - Residual Statistics[/C][/ROW]
[ROW][C]Residual Standard Deviation[/C][C]30.9529694672511[/C][/ROW]
[ROW][C]Sum Squared Residuals[/C][C]44071.9706666667[/C][/ROW]
[/TABLE]
Source: https://freestatistics.org/blog/index.php?pk=25792&T=3

Globally Unique Identifier (entire table): ba.freestatistics.org/blog/index.php?pk=25792&T=3

As an alternative you can also use a QR Code:  

The GUIDs for individual cells are displayed in the table below:

Multiple Linear Regression - Regression Statistics
Multiple R0.930648906349803
R-squared0.866107386890084
Adjusted R-squared0.828268170141629
F-TEST (value)22.8891467983532
F-TEST (DF numerator)13
F-TEST (DF denominator)46
p-value8.88178419700125e-16
Multiple Linear Regression - Residual Statistics
Residual Standard Deviation30.9529694672511
Sum Squared Residuals44071.9706666667


Multiple Linear Regression - Actuals, Interpolation, and Residuals
Time or IndexActualsInterpolationForecastResidualsPrediction Error
1107.182.226666666666824.8733333333332
2110.791.186666666666719.5133333333333
3117.196.906666666666620.1933333333334
4118.7102.96666666666715.7333333333334
5126.5114.68666666666711.8133333333333
6127.5123.9666666666673.53333333333336
7134.6132.0666666666672.53333333333335
8131.8139.666666666667-7.86666666666665
9135.9147.686666666667-11.7866666666667
10142.7138.8666666666673.83333333333335
11141.7128.84666666666712.8533333333333
12153.4114.58666666666738.8133333333333
13145140.1233333333334.87666666666671
14137.7149.083333333333-11.3833333333333
15148.3154.803333333333-6.50333333333333
16152.2160.863333333333-8.66333333333337
17169.4172.583333333333-3.18333333333333
18168.6181.863333333333-13.2633333333333
19161.1189.963333333333-28.8633333333333
20174.1197.563333333333-23.4633333333334
21179205.583333333333-26.5833333333334
22190.6196.763333333333-6.16333333333334
23190186.7433333333333.25666666666667
24181.6172.4833333333339.11666666666666
25174.8198.02-23.2200000000000
26180.5168.5811.92
27196.8174.322.5
28193.8180.3613.4400000000000
29197192.084.92
30216.3201.3614.94
31221.4209.4611.94
32217.9217.060.840000000000009
33229.7225.084.61999999999999
34227.4216.2611.1400000000000
35204.2206.24-2.03999999999997
36196.6191.984.62000000000001
37198.8217.516666666667-18.7166666666666
38207.5226.476666666667-18.9766666666667
39190.7232.196666666667-41.4966666666667
40201.6238.256666666667-36.6566666666667
41210.5249.976666666667-39.4766666666667
42223.5259.256666666667-35.7566666666667
43223.8267.356666666667-43.5566666666667
44231.2274.956666666667-43.7566666666667
45244282.976666666667-38.9766666666667
46234.7274.156666666667-39.4566666666667
47250.2264.136666666667-13.9366666666667
48265.7249.87666666666715.8233333333333
49287.6275.41333333333312.1866666666667
50283.3284.373333333333-1.07333333333333
51295.4290.0933333333335.30666666666663
52312.3296.15333333333316.1466666666667
53333.8307.87333333333325.9266666666667
54347.7317.15333333333330.5466666666666
55383.2325.25333333333357.9466666666666
56407.1332.85333333333374.2466666666667
57413.6340.87333333333372.7266666666667
58362.7332.05333333333330.6466666666666
59321.9322.033333333333-0.133333333333337
60239.4307.773333333333-68.3733333333333

\begin{tabular}{lllllllll}
\hline
Multiple Linear Regression - Actuals, Interpolation, and Residuals \tabularnewline
Time or Index & Actuals & InterpolationForecast & ResidualsPrediction Error \tabularnewline
1 & 107.1 & 82.2266666666668 & 24.8733333333332 \tabularnewline
2 & 110.7 & 91.1866666666667 & 19.5133333333333 \tabularnewline
3 & 117.1 & 96.9066666666666 & 20.1933333333334 \tabularnewline
4 & 118.7 & 102.966666666667 & 15.7333333333334 \tabularnewline
5 & 126.5 & 114.686666666667 & 11.8133333333333 \tabularnewline
6 & 127.5 & 123.966666666667 & 3.53333333333336 \tabularnewline
7 & 134.6 & 132.066666666667 & 2.53333333333335 \tabularnewline
8 & 131.8 & 139.666666666667 & -7.86666666666665 \tabularnewline
9 & 135.9 & 147.686666666667 & -11.7866666666667 \tabularnewline
10 & 142.7 & 138.866666666667 & 3.83333333333335 \tabularnewline
11 & 141.7 & 128.846666666667 & 12.8533333333333 \tabularnewline
12 & 153.4 & 114.586666666667 & 38.8133333333333 \tabularnewline
13 & 145 & 140.123333333333 & 4.87666666666671 \tabularnewline
14 & 137.7 & 149.083333333333 & -11.3833333333333 \tabularnewline
15 & 148.3 & 154.803333333333 & -6.50333333333333 \tabularnewline
16 & 152.2 & 160.863333333333 & -8.66333333333337 \tabularnewline
17 & 169.4 & 172.583333333333 & -3.18333333333333 \tabularnewline
18 & 168.6 & 181.863333333333 & -13.2633333333333 \tabularnewline
19 & 161.1 & 189.963333333333 & -28.8633333333333 \tabularnewline
20 & 174.1 & 197.563333333333 & -23.4633333333334 \tabularnewline
21 & 179 & 205.583333333333 & -26.5833333333334 \tabularnewline
22 & 190.6 & 196.763333333333 & -6.16333333333334 \tabularnewline
23 & 190 & 186.743333333333 & 3.25666666666667 \tabularnewline
24 & 181.6 & 172.483333333333 & 9.11666666666666 \tabularnewline
25 & 174.8 & 198.02 & -23.2200000000000 \tabularnewline
26 & 180.5 & 168.58 & 11.92 \tabularnewline
27 & 196.8 & 174.3 & 22.5 \tabularnewline
28 & 193.8 & 180.36 & 13.4400000000000 \tabularnewline
29 & 197 & 192.08 & 4.92 \tabularnewline
30 & 216.3 & 201.36 & 14.94 \tabularnewline
31 & 221.4 & 209.46 & 11.94 \tabularnewline
32 & 217.9 & 217.06 & 0.840000000000009 \tabularnewline
33 & 229.7 & 225.08 & 4.61999999999999 \tabularnewline
34 & 227.4 & 216.26 & 11.1400000000000 \tabularnewline
35 & 204.2 & 206.24 & -2.03999999999997 \tabularnewline
36 & 196.6 & 191.98 & 4.62000000000001 \tabularnewline
37 & 198.8 & 217.516666666667 & -18.7166666666666 \tabularnewline
38 & 207.5 & 226.476666666667 & -18.9766666666667 \tabularnewline
39 & 190.7 & 232.196666666667 & -41.4966666666667 \tabularnewline
40 & 201.6 & 238.256666666667 & -36.6566666666667 \tabularnewline
41 & 210.5 & 249.976666666667 & -39.4766666666667 \tabularnewline
42 & 223.5 & 259.256666666667 & -35.7566666666667 \tabularnewline
43 & 223.8 & 267.356666666667 & -43.5566666666667 \tabularnewline
44 & 231.2 & 274.956666666667 & -43.7566666666667 \tabularnewline
45 & 244 & 282.976666666667 & -38.9766666666667 \tabularnewline
46 & 234.7 & 274.156666666667 & -39.4566666666667 \tabularnewline
47 & 250.2 & 264.136666666667 & -13.9366666666667 \tabularnewline
48 & 265.7 & 249.876666666667 & 15.8233333333333 \tabularnewline
49 & 287.6 & 275.413333333333 & 12.1866666666667 \tabularnewline
50 & 283.3 & 284.373333333333 & -1.07333333333333 \tabularnewline
51 & 295.4 & 290.093333333333 & 5.30666666666663 \tabularnewline
52 & 312.3 & 296.153333333333 & 16.1466666666667 \tabularnewline
53 & 333.8 & 307.873333333333 & 25.9266666666667 \tabularnewline
54 & 347.7 & 317.153333333333 & 30.5466666666666 \tabularnewline
55 & 383.2 & 325.253333333333 & 57.9466666666666 \tabularnewline
56 & 407.1 & 332.853333333333 & 74.2466666666667 \tabularnewline
57 & 413.6 & 340.873333333333 & 72.7266666666667 \tabularnewline
58 & 362.7 & 332.053333333333 & 30.6466666666666 \tabularnewline
59 & 321.9 & 322.033333333333 & -0.133333333333337 \tabularnewline
60 & 239.4 & 307.773333333333 & -68.3733333333333 \tabularnewline
\hline
\end{tabular}
%Source: https://freestatistics.org/blog/index.php?pk=25792&T=4

[TABLE]
[ROW][C]Multiple Linear Regression - Actuals, Interpolation, and Residuals[/C][/ROW]
[ROW][C]Time or Index[/C][C]Actuals[/C][C]InterpolationForecast[/C][C]ResidualsPrediction Error[/C][/ROW]
[ROW][C]1[/C][C]107.1[/C][C]82.2266666666668[/C][C]24.8733333333332[/C][/ROW]
[ROW][C]2[/C][C]110.7[/C][C]91.1866666666667[/C][C]19.5133333333333[/C][/ROW]
[ROW][C]3[/C][C]117.1[/C][C]96.9066666666666[/C][C]20.1933333333334[/C][/ROW]
[ROW][C]4[/C][C]118.7[/C][C]102.966666666667[/C][C]15.7333333333334[/C][/ROW]
[ROW][C]5[/C][C]126.5[/C][C]114.686666666667[/C][C]11.8133333333333[/C][/ROW]
[ROW][C]6[/C][C]127.5[/C][C]123.966666666667[/C][C]3.53333333333336[/C][/ROW]
[ROW][C]7[/C][C]134.6[/C][C]132.066666666667[/C][C]2.53333333333335[/C][/ROW]
[ROW][C]8[/C][C]131.8[/C][C]139.666666666667[/C][C]-7.86666666666665[/C][/ROW]
[ROW][C]9[/C][C]135.9[/C][C]147.686666666667[/C][C]-11.7866666666667[/C][/ROW]
[ROW][C]10[/C][C]142.7[/C][C]138.866666666667[/C][C]3.83333333333335[/C][/ROW]
[ROW][C]11[/C][C]141.7[/C][C]128.846666666667[/C][C]12.8533333333333[/C][/ROW]
[ROW][C]12[/C][C]153.4[/C][C]114.586666666667[/C][C]38.8133333333333[/C][/ROW]
[ROW][C]13[/C][C]145[/C][C]140.123333333333[/C][C]4.87666666666671[/C][/ROW]
[ROW][C]14[/C][C]137.7[/C][C]149.083333333333[/C][C]-11.3833333333333[/C][/ROW]
[ROW][C]15[/C][C]148.3[/C][C]154.803333333333[/C][C]-6.50333333333333[/C][/ROW]
[ROW][C]16[/C][C]152.2[/C][C]160.863333333333[/C][C]-8.66333333333337[/C][/ROW]
[ROW][C]17[/C][C]169.4[/C][C]172.583333333333[/C][C]-3.18333333333333[/C][/ROW]
[ROW][C]18[/C][C]168.6[/C][C]181.863333333333[/C][C]-13.2633333333333[/C][/ROW]
[ROW][C]19[/C][C]161.1[/C][C]189.963333333333[/C][C]-28.8633333333333[/C][/ROW]
[ROW][C]20[/C][C]174.1[/C][C]197.563333333333[/C][C]-23.4633333333334[/C][/ROW]
[ROW][C]21[/C][C]179[/C][C]205.583333333333[/C][C]-26.5833333333334[/C][/ROW]
[ROW][C]22[/C][C]190.6[/C][C]196.763333333333[/C][C]-6.16333333333334[/C][/ROW]
[ROW][C]23[/C][C]190[/C][C]186.743333333333[/C][C]3.25666666666667[/C][/ROW]
[ROW][C]24[/C][C]181.6[/C][C]172.483333333333[/C][C]9.11666666666666[/C][/ROW]
[ROW][C]25[/C][C]174.8[/C][C]198.02[/C][C]-23.2200000000000[/C][/ROW]
[ROW][C]26[/C][C]180.5[/C][C]168.58[/C][C]11.92[/C][/ROW]
[ROW][C]27[/C][C]196.8[/C][C]174.3[/C][C]22.5[/C][/ROW]
[ROW][C]28[/C][C]193.8[/C][C]180.36[/C][C]13.4400000000000[/C][/ROW]
[ROW][C]29[/C][C]197[/C][C]192.08[/C][C]4.92[/C][/ROW]
[ROW][C]30[/C][C]216.3[/C][C]201.36[/C][C]14.94[/C][/ROW]
[ROW][C]31[/C][C]221.4[/C][C]209.46[/C][C]11.94[/C][/ROW]
[ROW][C]32[/C][C]217.9[/C][C]217.06[/C][C]0.840000000000009[/C][/ROW]
[ROW][C]33[/C][C]229.7[/C][C]225.08[/C][C]4.61999999999999[/C][/ROW]
[ROW][C]34[/C][C]227.4[/C][C]216.26[/C][C]11.1400000000000[/C][/ROW]
[ROW][C]35[/C][C]204.2[/C][C]206.24[/C][C]-2.03999999999997[/C][/ROW]
[ROW][C]36[/C][C]196.6[/C][C]191.98[/C][C]4.62000000000001[/C][/ROW]
[ROW][C]37[/C][C]198.8[/C][C]217.516666666667[/C][C]-18.7166666666666[/C][/ROW]
[ROW][C]38[/C][C]207.5[/C][C]226.476666666667[/C][C]-18.9766666666667[/C][/ROW]
[ROW][C]39[/C][C]190.7[/C][C]232.196666666667[/C][C]-41.4966666666667[/C][/ROW]
[ROW][C]40[/C][C]201.6[/C][C]238.256666666667[/C][C]-36.6566666666667[/C][/ROW]
[ROW][C]41[/C][C]210.5[/C][C]249.976666666667[/C][C]-39.4766666666667[/C][/ROW]
[ROW][C]42[/C][C]223.5[/C][C]259.256666666667[/C][C]-35.7566666666667[/C][/ROW]
[ROW][C]43[/C][C]223.8[/C][C]267.356666666667[/C][C]-43.5566666666667[/C][/ROW]
[ROW][C]44[/C][C]231.2[/C][C]274.956666666667[/C][C]-43.7566666666667[/C][/ROW]
[ROW][C]45[/C][C]244[/C][C]282.976666666667[/C][C]-38.9766666666667[/C][/ROW]
[ROW][C]46[/C][C]234.7[/C][C]274.156666666667[/C][C]-39.4566666666667[/C][/ROW]
[ROW][C]47[/C][C]250.2[/C][C]264.136666666667[/C][C]-13.9366666666667[/C][/ROW]
[ROW][C]48[/C][C]265.7[/C][C]249.876666666667[/C][C]15.8233333333333[/C][/ROW]
[ROW][C]49[/C][C]287.6[/C][C]275.413333333333[/C][C]12.1866666666667[/C][/ROW]
[ROW][C]50[/C][C]283.3[/C][C]284.373333333333[/C][C]-1.07333333333333[/C][/ROW]
[ROW][C]51[/C][C]295.4[/C][C]290.093333333333[/C][C]5.30666666666663[/C][/ROW]
[ROW][C]52[/C][C]312.3[/C][C]296.153333333333[/C][C]16.1466666666667[/C][/ROW]
[ROW][C]53[/C][C]333.8[/C][C]307.873333333333[/C][C]25.9266666666667[/C][/ROW]
[ROW][C]54[/C][C]347.7[/C][C]317.153333333333[/C][C]30.5466666666666[/C][/ROW]
[ROW][C]55[/C][C]383.2[/C][C]325.253333333333[/C][C]57.9466666666666[/C][/ROW]
[ROW][C]56[/C][C]407.1[/C][C]332.853333333333[/C][C]74.2466666666667[/C][/ROW]
[ROW][C]57[/C][C]413.6[/C][C]340.873333333333[/C][C]72.7266666666667[/C][/ROW]
[ROW][C]58[/C][C]362.7[/C][C]332.053333333333[/C][C]30.6466666666666[/C][/ROW]
[ROW][C]59[/C][C]321.9[/C][C]322.033333333333[/C][C]-0.133333333333337[/C][/ROW]
[ROW][C]60[/C][C]239.4[/C][C]307.773333333333[/C][C]-68.3733333333333[/C][/ROW]
[/TABLE]
Source: https://freestatistics.org/blog/index.php?pk=25792&T=4

Globally Unique Identifier (entire table): ba.freestatistics.org/blog/index.php?pk=25792&T=4

As an alternative you can also use a QR Code:  

The GUIDs for individual cells are displayed in the table below:

Multiple Linear Regression - Actuals, Interpolation, and Residuals
Time or IndexActualsInterpolationForecastResidualsPrediction Error
1107.182.226666666666824.8733333333332
2110.791.186666666666719.5133333333333
3117.196.906666666666620.1933333333334
4118.7102.96666666666715.7333333333334
5126.5114.68666666666711.8133333333333
6127.5123.9666666666673.53333333333336
7134.6132.0666666666672.53333333333335
8131.8139.666666666667-7.86666666666665
9135.9147.686666666667-11.7866666666667
10142.7138.8666666666673.83333333333335
11141.7128.84666666666712.8533333333333
12153.4114.58666666666738.8133333333333
13145140.1233333333334.87666666666671
14137.7149.083333333333-11.3833333333333
15148.3154.803333333333-6.50333333333333
16152.2160.863333333333-8.66333333333337
17169.4172.583333333333-3.18333333333333
18168.6181.863333333333-13.2633333333333
19161.1189.963333333333-28.8633333333333
20174.1197.563333333333-23.4633333333334
21179205.583333333333-26.5833333333334
22190.6196.763333333333-6.16333333333334
23190186.7433333333333.25666666666667
24181.6172.4833333333339.11666666666666
25174.8198.02-23.2200000000000
26180.5168.5811.92
27196.8174.322.5
28193.8180.3613.4400000000000
29197192.084.92
30216.3201.3614.94
31221.4209.4611.94
32217.9217.060.840000000000009
33229.7225.084.61999999999999
34227.4216.2611.1400000000000
35204.2206.24-2.03999999999997
36196.6191.984.62000000000001
37198.8217.516666666667-18.7166666666666
38207.5226.476666666667-18.9766666666667
39190.7232.196666666667-41.4966666666667
40201.6238.256666666667-36.6566666666667
41210.5249.976666666667-39.4766666666667
42223.5259.256666666667-35.7566666666667
43223.8267.356666666667-43.5566666666667
44231.2274.956666666667-43.7566666666667
45244282.976666666667-38.9766666666667
46234.7274.156666666667-39.4566666666667
47250.2264.136666666667-13.9366666666667
48265.7249.87666666666715.8233333333333
49287.6275.41333333333312.1866666666667
50283.3284.373333333333-1.07333333333333
51295.4290.0933333333335.30666666666663
52312.3296.15333333333316.1466666666667
53333.8307.87333333333325.9266666666667
54347.7317.15333333333330.5466666666666
55383.2325.25333333333357.9466666666666
56407.1332.85333333333374.2466666666667
57413.6340.87333333333372.7266666666667
58362.7332.05333333333330.6466666666666
59321.9322.033333333333-0.133333333333337
60239.4307.773333333333-68.3733333333333


Parameters (Session):
par1 = 1 ; par2 = Include Monthly Dummies ; par3 = Linear Trend ;
Parameters (R input):
par1 = 1 ; par2 = Include Monthly Dummies ; par3 = Linear Trend ;
R code (references can be found in the software module):
library(lattice)
par1 <- as.numeric(par1)
x <- t(y)
k <- length(x[1,])
n <- length(x[,1])
x1 <- cbind(x[,par1], x[,1:k!=par1])
mycolnames <- c(colnames(x)[par1], colnames(x)[1:k!=par1])
colnames(x1) <- mycolnames #colnames(x)[par1]
x <- x1
if (par3 == 'First Differences'){
x2 <- array(0, dim=c(n-1,k), dimnames=list(1:(n-1), paste('(1-B)',colnames(x),sep='')))
for (i in 1:n-1) {
for (j in 1:k) {
x2[i,j] <- x[i+1,j] - x[i,j]
}
}
x <- x2
}
if (par2 == 'Include Monthly Dummies'){
x2 <- array(0, dim=c(n,11), dimnames=list(1:n, paste('M', seq(1:11), sep ='')))
for (i in 1:11){
x2[seq(i,n,12),i] <- 1
}
x <- cbind(x, x2)
}
if (par2 == 'Include Quarterly Dummies'){
x2 <- array(0, dim=c(n,3), dimnames=list(1:n, paste('Q', seq(1:3), sep ='')))
for (i in 1:3){
x2[seq(i,n,4),i] <- 1
}
x <- cbind(x, x2)
}
k <- length(x[1,])
if (par3 == 'Linear Trend'){
x <- cbind(x, c(1:n))
colnames(x)[k+1] <- 't'
}
x
k <- length(x[1,])
df <- as.data.frame(x)
(mylm <- lm(df))
(mysum <- summary(mylm))
bitmap(file='test0.png')
plot(x[,1], type='l', main='Actuals and Interpolation', ylab='value of Actuals and Interpolation (dots)', xlab='time or index')
points(x[,1]-mysum$resid)
grid()
dev.off()
bitmap(file='test1.png')
plot(mysum$resid, type='b', pch=19, main='Residuals', ylab='value of Residuals', xlab='time or index')
grid()
dev.off()
bitmap(file='test2.png')
hist(mysum$resid, main='Residual Histogram', xlab='values of Residuals')
grid()
dev.off()
bitmap(file='test3.png')
densityplot(~mysum$resid,col='black',main='Residual Density Plot', xlab='values of Residuals')
dev.off()
bitmap(file='test4.png')
qqnorm(mysum$resid, main='Residual Normal Q-Q Plot')
grid()
dev.off()
(myerror <- as.ts(mysum$resid))
bitmap(file='test5.png')
dum <- cbind(lag(myerror,k=1),myerror)
dum
dum1 <- dum[2:length(myerror),]
dum1
z <- as.data.frame(dum1)
z
plot(z,main=paste('Residual Lag plot, lowess, and regression line'), ylab='values of Residuals', xlab='lagged values of Residuals')
lines(lowess(z))
abline(lm(z))
grid()
dev.off()
bitmap(file='test6.png')
acf(mysum$resid, lag.max=length(mysum$resid)/2, main='Residual Autocorrelation Function')
grid()
dev.off()
bitmap(file='test7.png')
pacf(mysum$resid, lag.max=length(mysum$resid)/2, main='Residual Partial Autocorrelation Function')
grid()
dev.off()
bitmap(file='test8.png')
opar <- par(mfrow = c(2,2), oma = c(0, 0, 1.1, 0))
plot(mylm, las = 1, sub='Residual Diagnostics')
par(opar)
dev.off()
load(file='createtable')
a<-table.start()
a<-table.row.start(a)
a<-table.element(a, 'Multiple Linear Regression - Estimated Regression Equation', 1, TRUE)
a<-table.row.end(a)
myeq <- colnames(x)[1]
myeq <- paste(myeq, '[t] = ', sep='')
for (i in 1:k){
if (mysum$coefficients[i,1] > 0) myeq <- paste(myeq, '+', '')
myeq <- paste(myeq, mysum$coefficients[i,1], sep=' ')
if (rownames(mysum$coefficients)[i] != '(Intercept)') {
myeq <- paste(myeq, rownames(mysum$coefficients)[i], sep='')
if (rownames(mysum$coefficients)[i] != 't') myeq <- paste(myeq, '[t]', sep='')
}
}
myeq <- paste(myeq, ' + e[t]')
a<-table.row.start(a)
a<-table.element(a, myeq)
a<-table.row.end(a)
a<-table.end(a)
table.save(a,file='mytable1.tab')
a<-table.start()
a<-table.row.start(a)
a<-table.element(a,hyperlink('ols1.htm','Multiple Linear Regression - Ordinary Least Squares',''), 6, TRUE)
a<-table.row.end(a)
a<-table.row.start(a)
a<-table.element(a,'Variable',header=TRUE)
a<-table.element(a,'Parameter',header=TRUE)
a<-table.element(a,'S.D.',header=TRUE)
a<-table.element(a,'T-STAT
H0: parameter = 0',header=TRUE)
a<-table.element(a,'2-tail p-value',header=TRUE)
a<-table.element(a,'1-tail p-value',header=TRUE)
a<-table.row.end(a)
for (i in 1:k){
a<-table.row.start(a)
a<-table.element(a,rownames(mysum$coefficients)[i],header=TRUE)
a<-table.element(a,mysum$coefficients[i,1])
a<-table.element(a, round(mysum$coefficients[i,2],6))
a<-table.element(a, round(mysum$coefficients[i,3],4))
a<-table.element(a, round(mysum$coefficients[i,4],6))
a<-table.element(a, round(mysum$coefficients[i,4]/2,6))
a<-table.row.end(a)
}
a<-table.end(a)
table.save(a,file='mytable2.tab')
a<-table.start()
a<-table.row.start(a)
a<-table.element(a, 'Multiple Linear Regression - Regression Statistics', 2, TRUE)
a<-table.row.end(a)
a<-table.row.start(a)
a<-table.element(a, 'Multiple R',1,TRUE)
a<-table.element(a, sqrt(mysum$r.squared))
a<-table.row.end(a)
a<-table.row.start(a)
a<-table.element(a, 'R-squared',1,TRUE)
a<-table.element(a, mysum$r.squared)
a<-table.row.end(a)
a<-table.row.start(a)
a<-table.element(a, 'Adjusted R-squared',1,TRUE)
a<-table.element(a, mysum$adj.r.squared)
a<-table.row.end(a)
a<-table.row.start(a)
a<-table.element(a, 'F-TEST (value)',1,TRUE)
a<-table.element(a, mysum$fstatistic[1])
a<-table.row.end(a)
a<-table.row.start(a)
a<-table.element(a, 'F-TEST (DF numerator)',1,TRUE)
a<-table.element(a, mysum$fstatistic[2])
a<-table.row.end(a)
a<-table.row.start(a)
a<-table.element(a, 'F-TEST (DF denominator)',1,TRUE)
a<-table.element(a, mysum$fstatistic[3])
a<-table.row.end(a)
a<-table.row.start(a)
a<-table.element(a, 'p-value',1,TRUE)
a<-table.element(a, 1-pf(mysum$fstatistic[1],mysum$fstatistic[2],mysum$fstatistic[3]))
a<-table.row.end(a)
a<-table.row.start(a)
a<-table.element(a, 'Multiple Linear Regression - Residual Statistics', 2, TRUE)
a<-table.row.end(a)
a<-table.row.start(a)
a<-table.element(a, 'Residual Standard Deviation',1,TRUE)
a<-table.element(a, mysum$sigma)
a<-table.row.end(a)
a<-table.row.start(a)
a<-table.element(a, 'Sum Squared Residuals',1,TRUE)
a<-table.element(a, sum(myerror*myerror))
a<-table.row.end(a)
a<-table.end(a)
table.save(a,file='mytable3.tab')
a<-table.start()
a<-table.row.start(a)
a<-table.element(a, 'Multiple Linear Regression - Actuals, Interpolation, and Residuals', 4, TRUE)
a<-table.row.end(a)
a<-table.row.start(a)
a<-table.element(a, 'Time or Index', 1, TRUE)
a<-table.element(a, 'Actuals', 1, TRUE)
a<-table.element(a, 'Interpolation
Forecast', 1, TRUE)
a<-table.element(a, 'Residuals
Prediction Error', 1, TRUE)
a<-table.row.end(a)
for (i in 1:n) {
a<-table.row.start(a)
a<-table.element(a,i, 1, TRUE)
a<-table.element(a,x[i])
a<-table.element(a,x[i]-mysum$resid[i])
a<-table.element(a,mysum$resid[i])
a<-table.row.end(a)
}
a<-table.end(a)
table.save(a,file='mytable4.tab')