Free Statistics

of Irreproducible Research!

Author's title

Author*The author of this computation has been verified*
R Software Modulerwasp_multipleregression.wasp
Title produced by softwareMultiple Regression
Date of computationThu, 27 Nov 2008 05:33:19 -0700
Cite this page as followsStatistical Computations at FreeStatistics.org, Office for Research Development and Education, URL https://freestatistics.org/blog/index.php?v=date/2008/Nov/27/t1227789285eia7vqubga6h2px.htm/, Retrieved Mon, 20 May 2024 10:35:40 +0000
Statistical Computations at FreeStatistics.org, Office for Research Development and Education, URL https://freestatistics.org/blog/index.php?pk=25776, Retrieved Mon, 20 May 2024 10:35:40 +0000
QR Codes:

Original text written by user:
IsPrivate?No (this computation is public)
User-defined keywords
Estimated Impact163
Family? (F = Feedback message, R = changed R code, M = changed R Module, P = changed Parameters, D = changed Data)
-     [Multiple Regression] [Q1 The Seatbeltlaw] [2007-11-14 19:27:43] [8cd6641b921d30ebe00b648d1481bba0]
- R  D  [Multiple Regression] [Q2] [2008-11-22 13:16:56] [74be16979710d4c4e7c6647856088456]
F    D      [Multiple Regression] [Q3] [2008-11-27 12:33:19] [d41d8cd98f00b204e9800998ecf8427e] [Current]
F   PD        [Multiple Regression] [Q3 Eigen data] [2008-11-27 12:38:30] [74be16979710d4c4e7c6647856088456]
Feedback Forum
2008-12-01 20:55:45 [Julian De Ruyter] [reply
Je hebt het even volledig en correct besproken zoals in Q1 en Q2.
Belangrijk is dat je waarnam dat het model relatief goed is maar zeker en vast nog voor verbetering vatbaar is.
2008-12-01 22:05:04 [Yannick Van Schil] [reply
de vraag is goed beantwoord, alleen vind ik niet terug wat de dummy betekent...

Post a new message
Dataseries X:
97,3	0
97,4	0
97,5	0
95,5	0
95,3	0
95,4	0
95,4	0
95,4	0
95,5	0
94,6	0
95,2	0
95,2	0
94,7	0
94,7	0
94,7	0
95,3	0
94,7	0
94,8	0
94,9	0
95,4	0
96	0
95,9	0
95,8	0
95,8	0
95,1	0
95,2	0
95,2	0
95,3	0
95,4	0
95,3	0
95,3	0
95	0
94,9	0
95,7	0
95,7	0
96,3	0
91,7	1
92,2	1
92,2	1
92,6	1
93	1
93	1
93	1
93,7	1
93,1	1
93,1	1
93,2	1
93,2	1
93	1
93,7	1
94	1
93,1	1
94,2	1
94,2	1
93,5	1
95	1
93,7	1
93,9	1
94,6	1
93,8	1
91,2	1
91,4	1
91,3	1
91,5	1
91,5	1
91,5	1
91,3	1
92,8	1


Summary of computational transaction
Raw Inputview raw input (R code)
Raw Outputview raw output of R engine
Computing time4 seconds
R Server'George Udny Yule' @ 72.249.76.132

\begin{tabular}{lllllllll}
\hline
Summary of computational transaction \tabularnewline
Raw Input & view raw input (R code)  \tabularnewline
Raw Output & view raw output of R engine  \tabularnewline
Computing time & 4 seconds \tabularnewline
R Server & 'George Udny Yule' @ 72.249.76.132 \tabularnewline
\hline
\end{tabular}
%Source: https://freestatistics.org/blog/index.php?pk=25776&T=0

[TABLE]
[ROW][C]Summary of computational transaction[/C][/ROW]
[ROW][C]Raw Input[/C][C]view raw input (R code) [/C][/ROW]
[ROW][C]Raw Output[/C][C]view raw output of R engine [/C][/ROW]
[ROW][C]Computing time[/C][C]4 seconds[/C][/ROW]
[ROW][C]R Server[/C][C]'George Udny Yule' @ 72.249.76.132[/C][/ROW]
[/TABLE]
Source: https://freestatistics.org/blog/index.php?pk=25776&T=0

Globally Unique Identifier (entire table): ba.freestatistics.org/blog/index.php?pk=25776&T=0

As an alternative you can also use a QR Code:  

The GUIDs for individual cells are displayed in the table below:

Summary of computational transaction
Raw Inputview raw input (R code)
Raw Outputview raw output of R engine
Computing time4 seconds
R Server'George Udny Yule' @ 72.249.76.132


Multiple Linear Regression - Estimated Regression Equation
X[t] = + 96.4646666666667 -1.59666666666666Y[t] -1.00116666666664M1[t] -0.707666666666663M2[t] -0.630833333333333M3[t] -0.870666666666669M4[t] -0.710499999999999M5[t] -0.666999999999999M6[t] -0.773499999999998M7[t] -0.0966666666666634M8[t] -0.300499999999999M9[t] -0.273666666666665M10[t] + 0.0131666666666679M11[t] -0.0268333333333338t + e[t]

\begin{tabular}{lllllllll}
\hline
Multiple Linear Regression - Estimated Regression Equation \tabularnewline
X[t] =  +  96.4646666666667 -1.59666666666666Y[t] -1.00116666666664M1[t] -0.707666666666663M2[t] -0.630833333333333M3[t] -0.870666666666669M4[t] -0.710499999999999M5[t] -0.666999999999999M6[t] -0.773499999999998M7[t] -0.0966666666666634M8[t] -0.300499999999999M9[t] -0.273666666666665M10[t] +  0.0131666666666679M11[t] -0.0268333333333338t  + e[t] \tabularnewline
\hline
\end{tabular}
%Source: https://freestatistics.org/blog/index.php?pk=25776&T=1

[TABLE]
[ROW][C]Multiple Linear Regression - Estimated Regression Equation[/C][/ROW]
[ROW][C]X[t] =  +  96.4646666666667 -1.59666666666666Y[t] -1.00116666666664M1[t] -0.707666666666663M2[t] -0.630833333333333M3[t] -0.870666666666669M4[t] -0.710499999999999M5[t] -0.666999999999999M6[t] -0.773499999999998M7[t] -0.0966666666666634M8[t] -0.300499999999999M9[t] -0.273666666666665M10[t] +  0.0131666666666679M11[t] -0.0268333333333338t  + e[t][/C][/ROW]
[/TABLE]
Source: https://freestatistics.org/blog/index.php?pk=25776&T=1

Globally Unique Identifier (entire table): ba.freestatistics.org/blog/index.php?pk=25776&T=1

As an alternative you can also use a QR Code:  

The GUIDs for individual cells are displayed in the table below:

Multiple Linear Regression - Estimated Regression Equation
X[t] = + 96.4646666666667 -1.59666666666666Y[t] -1.00116666666664M1[t] -0.707666666666663M2[t] -0.630833333333333M3[t] -0.870666666666669M4[t] -0.710499999999999M5[t] -0.666999999999999M6[t] -0.773499999999998M7[t] -0.0966666666666634M8[t] -0.300499999999999M9[t] -0.273666666666665M10[t] + 0.0131666666666679M11[t] -0.0268333333333338t + e[t]


Multiple Linear Regression - Ordinary Least Squares
VariableParameterS.D.T-STATH0: parameter = 02-tail p-value1-tail p-value
(Intercept)96.46466666666670.48033200.8300
Y-1.596666666666660.445975-3.58020.0007360.000368
M1-1.001166666666640.548947-1.82380.0737190.036859
M2-0.7076666666666630.547082-1.29350.2013340.100667
M3-0.6308333333333330.545447-1.15650.2525490.126275
M4-0.8706666666666690.544044-1.60040.1153530.057677
M5-0.7104999999999990.542875-1.30880.1961540.098077
M6-0.6669999999999990.541941-1.23080.2237460.111873
M7-0.7734999999999980.541244-1.42910.1587310.079365
M8-0.09666666666666340.540784-0.17880.8588010.4294
M9-0.3004999999999990.565146-0.53170.59710.29855
M10-0.2736666666666650.564576-0.48470.6298290.314914
M110.01316666666666790.5642330.02330.9814690.490734
t-0.02683333333333380.011354-2.36330.021740.01087

\begin{tabular}{lllllllll}
\hline
Multiple Linear Regression - Ordinary Least Squares \tabularnewline
Variable & Parameter & S.D. & T-STATH0: parameter = 0 & 2-tail p-value & 1-tail p-value \tabularnewline
(Intercept) & 96.4646666666667 & 0.48033 & 200.83 & 0 & 0 \tabularnewline
Y & -1.59666666666666 & 0.445975 & -3.5802 & 0.000736 & 0.000368 \tabularnewline
M1 & -1.00116666666664 & 0.548947 & -1.8238 & 0.073719 & 0.036859 \tabularnewline
M2 & -0.707666666666663 & 0.547082 & -1.2935 & 0.201334 & 0.100667 \tabularnewline
M3 & -0.630833333333333 & 0.545447 & -1.1565 & 0.252549 & 0.126275 \tabularnewline
M4 & -0.870666666666669 & 0.544044 & -1.6004 & 0.115353 & 0.057677 \tabularnewline
M5 & -0.710499999999999 & 0.542875 & -1.3088 & 0.196154 & 0.098077 \tabularnewline
M6 & -0.666999999999999 & 0.541941 & -1.2308 & 0.223746 & 0.111873 \tabularnewline
M7 & -0.773499999999998 & 0.541244 & -1.4291 & 0.158731 & 0.079365 \tabularnewline
M8 & -0.0966666666666634 & 0.540784 & -0.1788 & 0.858801 & 0.4294 \tabularnewline
M9 & -0.300499999999999 & 0.565146 & -0.5317 & 0.5971 & 0.29855 \tabularnewline
M10 & -0.273666666666665 & 0.564576 & -0.4847 & 0.629829 & 0.314914 \tabularnewline
M11 & 0.0131666666666679 & 0.564233 & 0.0233 & 0.981469 & 0.490734 \tabularnewline
t & -0.0268333333333338 & 0.011354 & -2.3633 & 0.02174 & 0.01087 \tabularnewline
\hline
\end{tabular}
%Source: https://freestatistics.org/blog/index.php?pk=25776&T=2

[TABLE]
[ROW][C]Multiple Linear Regression - Ordinary Least Squares[/C][/ROW]
[ROW][C]Variable[/C][C]Parameter[/C][C]S.D.[/C][C]T-STATH0: parameter = 0[/C][C]2-tail p-value[/C][C]1-tail p-value[/C][/ROW]
[ROW][C](Intercept)[/C][C]96.4646666666667[/C][C]0.48033[/C][C]200.83[/C][C]0[/C][C]0[/C][/ROW]
[ROW][C]Y[/C][C]-1.59666666666666[/C][C]0.445975[/C][C]-3.5802[/C][C]0.000736[/C][C]0.000368[/C][/ROW]
[ROW][C]M1[/C][C]-1.00116666666664[/C][C]0.548947[/C][C]-1.8238[/C][C]0.073719[/C][C]0.036859[/C][/ROW]
[ROW][C]M2[/C][C]-0.707666666666663[/C][C]0.547082[/C][C]-1.2935[/C][C]0.201334[/C][C]0.100667[/C][/ROW]
[ROW][C]M3[/C][C]-0.630833333333333[/C][C]0.545447[/C][C]-1.1565[/C][C]0.252549[/C][C]0.126275[/C][/ROW]
[ROW][C]M4[/C][C]-0.870666666666669[/C][C]0.544044[/C][C]-1.6004[/C][C]0.115353[/C][C]0.057677[/C][/ROW]
[ROW][C]M5[/C][C]-0.710499999999999[/C][C]0.542875[/C][C]-1.3088[/C][C]0.196154[/C][C]0.098077[/C][/ROW]
[ROW][C]M6[/C][C]-0.666999999999999[/C][C]0.541941[/C][C]-1.2308[/C][C]0.223746[/C][C]0.111873[/C][/ROW]
[ROW][C]M7[/C][C]-0.773499999999998[/C][C]0.541244[/C][C]-1.4291[/C][C]0.158731[/C][C]0.079365[/C][/ROW]
[ROW][C]M8[/C][C]-0.0966666666666634[/C][C]0.540784[/C][C]-0.1788[/C][C]0.858801[/C][C]0.4294[/C][/ROW]
[ROW][C]M9[/C][C]-0.300499999999999[/C][C]0.565146[/C][C]-0.5317[/C][C]0.5971[/C][C]0.29855[/C][/ROW]
[ROW][C]M10[/C][C]-0.273666666666665[/C][C]0.564576[/C][C]-0.4847[/C][C]0.629829[/C][C]0.314914[/C][/ROW]
[ROW][C]M11[/C][C]0.0131666666666679[/C][C]0.564233[/C][C]0.0233[/C][C]0.981469[/C][C]0.490734[/C][/ROW]
[ROW][C]t[/C][C]-0.0268333333333338[/C][C]0.011354[/C][C]-2.3633[/C][C]0.02174[/C][C]0.01087[/C][/ROW]
[/TABLE]
Source: https://freestatistics.org/blog/index.php?pk=25776&T=2

Globally Unique Identifier (entire table): ba.freestatistics.org/blog/index.php?pk=25776&T=2

As an alternative you can also use a QR Code:  

The GUIDs for individual cells are displayed in the table below:

Multiple Linear Regression - Ordinary Least Squares
VariableParameterS.D.T-STATH0: parameter = 02-tail p-value1-tail p-value
(Intercept)96.46466666666670.48033200.8300
Y-1.596666666666660.445975-3.58020.0007360.000368
M1-1.001166666666640.548947-1.82380.0737190.036859
M2-0.7076666666666630.547082-1.29350.2013340.100667
M3-0.6308333333333330.545447-1.15650.2525490.126275
M4-0.8706666666666690.544044-1.60040.1153530.057677
M5-0.7104999999999990.542875-1.30880.1961540.098077
M6-0.6669999999999990.541941-1.23080.2237460.111873
M7-0.7734999999999980.541244-1.42910.1587310.079365
M8-0.09666666666666340.540784-0.17880.8588010.4294
M9-0.3004999999999990.565146-0.53170.59710.29855
M10-0.2736666666666650.564576-0.48470.6298290.314914
M110.01316666666666790.5642330.02330.9814690.490734
t-0.02683333333333380.011354-2.36330.021740.01087


Multiple Linear Regression - Regression Statistics
Multiple R0.858360551898973
R-squared0.73678283705631
Adjusted R-squared0.673415742273569
F-TEST (value)11.6272150330141
F-TEST (DF numerator)13
F-TEST (DF denominator)54
p-value2.14550599508812e-11
Multiple Linear Regression - Residual Statistics
Residual Standard Deviation0.891950283727735
Sum Squared Residuals42.9610666666673

\begin{tabular}{lllllllll}
\hline
Multiple Linear Regression - Regression Statistics \tabularnewline
Multiple R & 0.858360551898973 \tabularnewline
R-squared & 0.73678283705631 \tabularnewline
Adjusted R-squared & 0.673415742273569 \tabularnewline
F-TEST (value) & 11.6272150330141 \tabularnewline
F-TEST (DF numerator) & 13 \tabularnewline
F-TEST (DF denominator) & 54 \tabularnewline
p-value & 2.14550599508812e-11 \tabularnewline
Multiple Linear Regression - Residual Statistics \tabularnewline
Residual Standard Deviation & 0.891950283727735 \tabularnewline
Sum Squared Residuals & 42.9610666666673 \tabularnewline
\hline
\end{tabular}
%Source: https://freestatistics.org/blog/index.php?pk=25776&T=3

[TABLE]
[ROW][C]Multiple Linear Regression - Regression Statistics[/C][/ROW]
[ROW][C]Multiple R[/C][C]0.858360551898973[/C][/ROW]
[ROW][C]R-squared[/C][C]0.73678283705631[/C][/ROW]
[ROW][C]Adjusted R-squared[/C][C]0.673415742273569[/C][/ROW]
[ROW][C]F-TEST (value)[/C][C]11.6272150330141[/C][/ROW]
[ROW][C]F-TEST (DF numerator)[/C][C]13[/C][/ROW]
[ROW][C]F-TEST (DF denominator)[/C][C]54[/C][/ROW]
[ROW][C]p-value[/C][C]2.14550599508812e-11[/C][/ROW]
[ROW][C]Multiple Linear Regression - Residual Statistics[/C][/ROW]
[ROW][C]Residual Standard Deviation[/C][C]0.891950283727735[/C][/ROW]
[ROW][C]Sum Squared Residuals[/C][C]42.9610666666673[/C][/ROW]
[/TABLE]
Source: https://freestatistics.org/blog/index.php?pk=25776&T=3

Globally Unique Identifier (entire table): ba.freestatistics.org/blog/index.php?pk=25776&T=3

As an alternative you can also use a QR Code:  

The GUIDs for individual cells are displayed in the table below:

Multiple Linear Regression - Regression Statistics
Multiple R0.858360551898973
R-squared0.73678283705631
Adjusted R-squared0.673415742273569
F-TEST (value)11.6272150330141
F-TEST (DF numerator)13
F-TEST (DF denominator)54
p-value2.14550599508812e-11
Multiple Linear Regression - Residual Statistics
Residual Standard Deviation0.891950283727735
Sum Squared Residuals42.9610666666673


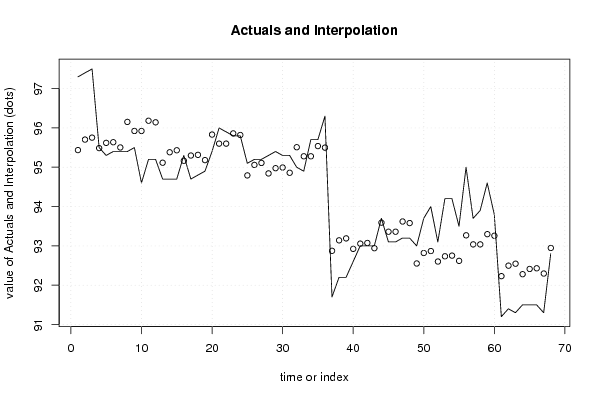
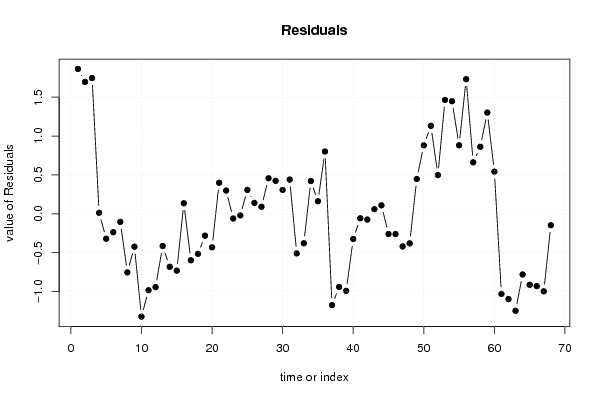
Multiple Linear Regression - Actuals, Interpolation, and Residuals
Time or IndexActualsInterpolationForecastResidualsPrediction Error
197.395.43666666666651.86333333333348
297.495.70333333333331.69666666666666
397.595.75333333333331.74666666666666
495.595.48666666666670.0133333333333264
595.395.62-0.320000000000013
695.495.6366666666667-0.236666666666672
795.495.5033333333333-0.103333333333337
895.496.1533333333334-0.753333333333338
995.595.9226666666667-0.422666666666675
1094.695.9226666666667-1.32266666666668
1195.296.1826666666667-0.982666666666671
1295.296.1426666666667-0.94266666666667
1394.795.1146666666667-0.414666666666699
1494.795.3813333333333-0.681333333333338
1594.795.4313333333333-0.731333333333335
1695.395.16466666666670.135333333333330
1794.795.298-0.598000000000002
1894.895.3146666666667-0.514666666666673
1994.995.1813333333333-0.281333333333332
2095.495.8313333333333-0.431333333333333
219695.60066666666670.399333333333331
2295.995.60066666666670.299333333333336
2395.895.8606666666667-0.0606666666666712
2495.895.8206666666667-0.0206666666666696
2595.194.79266666666670.307333333333298
2695.295.05933333333330.140666666666668
2795.295.10933333333330.0906666666666705
2895.394.84266666666670.457333333333335
2995.494.9760.424000000000006
3095.394.99266666666670.307333333333332
3195.394.85933333333330.440666666666664
329595.5093333333333-0.509333333333334
3394.995.2786666666667-0.378666666666658
3495.795.27866666666670.421333333333339
3595.795.53866666666670.161333333333340
3696.395.49866666666670.801333333333335
3791.792.874-1.17400000000003
3892.293.1406666666667-0.94066666666667
3992.293.1906666666667-0.990666666666667
4092.692.924-0.324000000000005
419393.0573333333333-0.0573333333333363
429393.074-0.0740000000000018
439392.94066666666670.0593333333333308
4493.793.59066666666670.109333333333333
4593.193.36-0.260000000000006
4693.193.36-0.260000000000006
4793.293.62-0.419999999999997
4893.293.58-0.379999999999995
499392.5520.447999999999972
5093.792.81866666666670.881333333333336
519492.86866666666671.13133333333334
5293.192.6020.498000000000001
5394.292.73533333333331.46466666666667
5494.292.7521.44800000000001
5593.592.61866666666670.881333333333336
569593.26866666666671.73133333333333
5793.793.0380.662000000000008
5893.993.0380.86200000000001
5994.693.2981.302
6093.893.2580.542000000000004
6191.292.23-1.03000000000002
6291.492.4966666666667-1.09666666666666
6391.392.5466666666667-1.24666666666666
6491.592.28-0.779999999999988
6591.592.4133333333333-0.913333333333326
6691.592.43-0.92999999999999
6791.392.2966666666667-0.996666666666661
6892.892.9466666666667-0.146666666666662

\begin{tabular}{lllllllll}
\hline
Multiple Linear Regression - Actuals, Interpolation, and Residuals \tabularnewline
Time or Index & Actuals & InterpolationForecast & ResidualsPrediction Error \tabularnewline
1 & 97.3 & 95.4366666666665 & 1.86333333333348 \tabularnewline
2 & 97.4 & 95.7033333333333 & 1.69666666666666 \tabularnewline
3 & 97.5 & 95.7533333333333 & 1.74666666666666 \tabularnewline
4 & 95.5 & 95.4866666666667 & 0.0133333333333264 \tabularnewline
5 & 95.3 & 95.62 & -0.320000000000013 \tabularnewline
6 & 95.4 & 95.6366666666667 & -0.236666666666672 \tabularnewline
7 & 95.4 & 95.5033333333333 & -0.103333333333337 \tabularnewline
8 & 95.4 & 96.1533333333334 & -0.753333333333338 \tabularnewline
9 & 95.5 & 95.9226666666667 & -0.422666666666675 \tabularnewline
10 & 94.6 & 95.9226666666667 & -1.32266666666668 \tabularnewline
11 & 95.2 & 96.1826666666667 & -0.982666666666671 \tabularnewline
12 & 95.2 & 96.1426666666667 & -0.94266666666667 \tabularnewline
13 & 94.7 & 95.1146666666667 & -0.414666666666699 \tabularnewline
14 & 94.7 & 95.3813333333333 & -0.681333333333338 \tabularnewline
15 & 94.7 & 95.4313333333333 & -0.731333333333335 \tabularnewline
16 & 95.3 & 95.1646666666667 & 0.135333333333330 \tabularnewline
17 & 94.7 & 95.298 & -0.598000000000002 \tabularnewline
18 & 94.8 & 95.3146666666667 & -0.514666666666673 \tabularnewline
19 & 94.9 & 95.1813333333333 & -0.281333333333332 \tabularnewline
20 & 95.4 & 95.8313333333333 & -0.431333333333333 \tabularnewline
21 & 96 & 95.6006666666667 & 0.399333333333331 \tabularnewline
22 & 95.9 & 95.6006666666667 & 0.299333333333336 \tabularnewline
23 & 95.8 & 95.8606666666667 & -0.0606666666666712 \tabularnewline
24 & 95.8 & 95.8206666666667 & -0.0206666666666696 \tabularnewline
25 & 95.1 & 94.7926666666667 & 0.307333333333298 \tabularnewline
26 & 95.2 & 95.0593333333333 & 0.140666666666668 \tabularnewline
27 & 95.2 & 95.1093333333333 & 0.0906666666666705 \tabularnewline
28 & 95.3 & 94.8426666666667 & 0.457333333333335 \tabularnewline
29 & 95.4 & 94.976 & 0.424000000000006 \tabularnewline
30 & 95.3 & 94.9926666666667 & 0.307333333333332 \tabularnewline
31 & 95.3 & 94.8593333333333 & 0.440666666666664 \tabularnewline
32 & 95 & 95.5093333333333 & -0.509333333333334 \tabularnewline
33 & 94.9 & 95.2786666666667 & -0.378666666666658 \tabularnewline
34 & 95.7 & 95.2786666666667 & 0.421333333333339 \tabularnewline
35 & 95.7 & 95.5386666666667 & 0.161333333333340 \tabularnewline
36 & 96.3 & 95.4986666666667 & 0.801333333333335 \tabularnewline
37 & 91.7 & 92.874 & -1.17400000000003 \tabularnewline
38 & 92.2 & 93.1406666666667 & -0.94066666666667 \tabularnewline
39 & 92.2 & 93.1906666666667 & -0.990666666666667 \tabularnewline
40 & 92.6 & 92.924 & -0.324000000000005 \tabularnewline
41 & 93 & 93.0573333333333 & -0.0573333333333363 \tabularnewline
42 & 93 & 93.074 & -0.0740000000000018 \tabularnewline
43 & 93 & 92.9406666666667 & 0.0593333333333308 \tabularnewline
44 & 93.7 & 93.5906666666667 & 0.109333333333333 \tabularnewline
45 & 93.1 & 93.36 & -0.260000000000006 \tabularnewline
46 & 93.1 & 93.36 & -0.260000000000006 \tabularnewline
47 & 93.2 & 93.62 & -0.419999999999997 \tabularnewline
48 & 93.2 & 93.58 & -0.379999999999995 \tabularnewline
49 & 93 & 92.552 & 0.447999999999972 \tabularnewline
50 & 93.7 & 92.8186666666667 & 0.881333333333336 \tabularnewline
51 & 94 & 92.8686666666667 & 1.13133333333334 \tabularnewline
52 & 93.1 & 92.602 & 0.498000000000001 \tabularnewline
53 & 94.2 & 92.7353333333333 & 1.46466666666667 \tabularnewline
54 & 94.2 & 92.752 & 1.44800000000001 \tabularnewline
55 & 93.5 & 92.6186666666667 & 0.881333333333336 \tabularnewline
56 & 95 & 93.2686666666667 & 1.73133333333333 \tabularnewline
57 & 93.7 & 93.038 & 0.662000000000008 \tabularnewline
58 & 93.9 & 93.038 & 0.86200000000001 \tabularnewline
59 & 94.6 & 93.298 & 1.302 \tabularnewline
60 & 93.8 & 93.258 & 0.542000000000004 \tabularnewline
61 & 91.2 & 92.23 & -1.03000000000002 \tabularnewline
62 & 91.4 & 92.4966666666667 & -1.09666666666666 \tabularnewline
63 & 91.3 & 92.5466666666667 & -1.24666666666666 \tabularnewline
64 & 91.5 & 92.28 & -0.779999999999988 \tabularnewline
65 & 91.5 & 92.4133333333333 & -0.913333333333326 \tabularnewline
66 & 91.5 & 92.43 & -0.92999999999999 \tabularnewline
67 & 91.3 & 92.2966666666667 & -0.996666666666661 \tabularnewline
68 & 92.8 & 92.9466666666667 & -0.146666666666662 \tabularnewline
\hline
\end{tabular}
%Source: https://freestatistics.org/blog/index.php?pk=25776&T=4

[TABLE]
[ROW][C]Multiple Linear Regression - Actuals, Interpolation, and Residuals[/C][/ROW]
[ROW][C]Time or Index[/C][C]Actuals[/C][C]InterpolationForecast[/C][C]ResidualsPrediction Error[/C][/ROW]
[ROW][C]1[/C][C]97.3[/C][C]95.4366666666665[/C][C]1.86333333333348[/C][/ROW]
[ROW][C]2[/C][C]97.4[/C][C]95.7033333333333[/C][C]1.69666666666666[/C][/ROW]
[ROW][C]3[/C][C]97.5[/C][C]95.7533333333333[/C][C]1.74666666666666[/C][/ROW]
[ROW][C]4[/C][C]95.5[/C][C]95.4866666666667[/C][C]0.0133333333333264[/C][/ROW]
[ROW][C]5[/C][C]95.3[/C][C]95.62[/C][C]-0.320000000000013[/C][/ROW]
[ROW][C]6[/C][C]95.4[/C][C]95.6366666666667[/C][C]-0.236666666666672[/C][/ROW]
[ROW][C]7[/C][C]95.4[/C][C]95.5033333333333[/C][C]-0.103333333333337[/C][/ROW]
[ROW][C]8[/C][C]95.4[/C][C]96.1533333333334[/C][C]-0.753333333333338[/C][/ROW]
[ROW][C]9[/C][C]95.5[/C][C]95.9226666666667[/C][C]-0.422666666666675[/C][/ROW]
[ROW][C]10[/C][C]94.6[/C][C]95.9226666666667[/C][C]-1.32266666666668[/C][/ROW]
[ROW][C]11[/C][C]95.2[/C][C]96.1826666666667[/C][C]-0.982666666666671[/C][/ROW]
[ROW][C]12[/C][C]95.2[/C][C]96.1426666666667[/C][C]-0.94266666666667[/C][/ROW]
[ROW][C]13[/C][C]94.7[/C][C]95.1146666666667[/C][C]-0.414666666666699[/C][/ROW]
[ROW][C]14[/C][C]94.7[/C][C]95.3813333333333[/C][C]-0.681333333333338[/C][/ROW]
[ROW][C]15[/C][C]94.7[/C][C]95.4313333333333[/C][C]-0.731333333333335[/C][/ROW]
[ROW][C]16[/C][C]95.3[/C][C]95.1646666666667[/C][C]0.135333333333330[/C][/ROW]
[ROW][C]17[/C][C]94.7[/C][C]95.298[/C][C]-0.598000000000002[/C][/ROW]
[ROW][C]18[/C][C]94.8[/C][C]95.3146666666667[/C][C]-0.514666666666673[/C][/ROW]
[ROW][C]19[/C][C]94.9[/C][C]95.1813333333333[/C][C]-0.281333333333332[/C][/ROW]
[ROW][C]20[/C][C]95.4[/C][C]95.8313333333333[/C][C]-0.431333333333333[/C][/ROW]
[ROW][C]21[/C][C]96[/C][C]95.6006666666667[/C][C]0.399333333333331[/C][/ROW]
[ROW][C]22[/C][C]95.9[/C][C]95.6006666666667[/C][C]0.299333333333336[/C][/ROW]
[ROW][C]23[/C][C]95.8[/C][C]95.8606666666667[/C][C]-0.0606666666666712[/C][/ROW]
[ROW][C]24[/C][C]95.8[/C][C]95.8206666666667[/C][C]-0.0206666666666696[/C][/ROW]
[ROW][C]25[/C][C]95.1[/C][C]94.7926666666667[/C][C]0.307333333333298[/C][/ROW]
[ROW][C]26[/C][C]95.2[/C][C]95.0593333333333[/C][C]0.140666666666668[/C][/ROW]
[ROW][C]27[/C][C]95.2[/C][C]95.1093333333333[/C][C]0.0906666666666705[/C][/ROW]
[ROW][C]28[/C][C]95.3[/C][C]94.8426666666667[/C][C]0.457333333333335[/C][/ROW]
[ROW][C]29[/C][C]95.4[/C][C]94.976[/C][C]0.424000000000006[/C][/ROW]
[ROW][C]30[/C][C]95.3[/C][C]94.9926666666667[/C][C]0.307333333333332[/C][/ROW]
[ROW][C]31[/C][C]95.3[/C][C]94.8593333333333[/C][C]0.440666666666664[/C][/ROW]
[ROW][C]32[/C][C]95[/C][C]95.5093333333333[/C][C]-0.509333333333334[/C][/ROW]
[ROW][C]33[/C][C]94.9[/C][C]95.2786666666667[/C][C]-0.378666666666658[/C][/ROW]
[ROW][C]34[/C][C]95.7[/C][C]95.2786666666667[/C][C]0.421333333333339[/C][/ROW]
[ROW][C]35[/C][C]95.7[/C][C]95.5386666666667[/C][C]0.161333333333340[/C][/ROW]
[ROW][C]36[/C][C]96.3[/C][C]95.4986666666667[/C][C]0.801333333333335[/C][/ROW]
[ROW][C]37[/C][C]91.7[/C][C]92.874[/C][C]-1.17400000000003[/C][/ROW]
[ROW][C]38[/C][C]92.2[/C][C]93.1406666666667[/C][C]-0.94066666666667[/C][/ROW]
[ROW][C]39[/C][C]92.2[/C][C]93.1906666666667[/C][C]-0.990666666666667[/C][/ROW]
[ROW][C]40[/C][C]92.6[/C][C]92.924[/C][C]-0.324000000000005[/C][/ROW]
[ROW][C]41[/C][C]93[/C][C]93.0573333333333[/C][C]-0.0573333333333363[/C][/ROW]
[ROW][C]42[/C][C]93[/C][C]93.074[/C][C]-0.0740000000000018[/C][/ROW]
[ROW][C]43[/C][C]93[/C][C]92.9406666666667[/C][C]0.0593333333333308[/C][/ROW]
[ROW][C]44[/C][C]93.7[/C][C]93.5906666666667[/C][C]0.109333333333333[/C][/ROW]
[ROW][C]45[/C][C]93.1[/C][C]93.36[/C][C]-0.260000000000006[/C][/ROW]
[ROW][C]46[/C][C]93.1[/C][C]93.36[/C][C]-0.260000000000006[/C][/ROW]
[ROW][C]47[/C][C]93.2[/C][C]93.62[/C][C]-0.419999999999997[/C][/ROW]
[ROW][C]48[/C][C]93.2[/C][C]93.58[/C][C]-0.379999999999995[/C][/ROW]
[ROW][C]49[/C][C]93[/C][C]92.552[/C][C]0.447999999999972[/C][/ROW]
[ROW][C]50[/C][C]93.7[/C][C]92.8186666666667[/C][C]0.881333333333336[/C][/ROW]
[ROW][C]51[/C][C]94[/C][C]92.8686666666667[/C][C]1.13133333333334[/C][/ROW]
[ROW][C]52[/C][C]93.1[/C][C]92.602[/C][C]0.498000000000001[/C][/ROW]
[ROW][C]53[/C][C]94.2[/C][C]92.7353333333333[/C][C]1.46466666666667[/C][/ROW]
[ROW][C]54[/C][C]94.2[/C][C]92.752[/C][C]1.44800000000001[/C][/ROW]
[ROW][C]55[/C][C]93.5[/C][C]92.6186666666667[/C][C]0.881333333333336[/C][/ROW]
[ROW][C]56[/C][C]95[/C][C]93.2686666666667[/C][C]1.73133333333333[/C][/ROW]
[ROW][C]57[/C][C]93.7[/C][C]93.038[/C][C]0.662000000000008[/C][/ROW]
[ROW][C]58[/C][C]93.9[/C][C]93.038[/C][C]0.86200000000001[/C][/ROW]
[ROW][C]59[/C][C]94.6[/C][C]93.298[/C][C]1.302[/C][/ROW]
[ROW][C]60[/C][C]93.8[/C][C]93.258[/C][C]0.542000000000004[/C][/ROW]
[ROW][C]61[/C][C]91.2[/C][C]92.23[/C][C]-1.03000000000002[/C][/ROW]
[ROW][C]62[/C][C]91.4[/C][C]92.4966666666667[/C][C]-1.09666666666666[/C][/ROW]
[ROW][C]63[/C][C]91.3[/C][C]92.5466666666667[/C][C]-1.24666666666666[/C][/ROW]
[ROW][C]64[/C][C]91.5[/C][C]92.28[/C][C]-0.779999999999988[/C][/ROW]
[ROW][C]65[/C][C]91.5[/C][C]92.4133333333333[/C][C]-0.913333333333326[/C][/ROW]
[ROW][C]66[/C][C]91.5[/C][C]92.43[/C][C]-0.92999999999999[/C][/ROW]
[ROW][C]67[/C][C]91.3[/C][C]92.2966666666667[/C][C]-0.996666666666661[/C][/ROW]
[ROW][C]68[/C][C]92.8[/C][C]92.9466666666667[/C][C]-0.146666666666662[/C][/ROW]
[/TABLE]
Source: https://freestatistics.org/blog/index.php?pk=25776&T=4

Globally Unique Identifier (entire table): ba.freestatistics.org/blog/index.php?pk=25776&T=4

As an alternative you can also use a QR Code:  

The GUIDs for individual cells are displayed in the table below:

Multiple Linear Regression - Actuals, Interpolation, and Residuals
Time or IndexActualsInterpolationForecastResidualsPrediction Error
197.395.43666666666651.86333333333348
297.495.70333333333331.69666666666666
397.595.75333333333331.74666666666666
495.595.48666666666670.0133333333333264
595.395.62-0.320000000000013
695.495.6366666666667-0.236666666666672
795.495.5033333333333-0.103333333333337
895.496.1533333333334-0.753333333333338
995.595.9226666666667-0.422666666666675
1094.695.9226666666667-1.32266666666668
1195.296.1826666666667-0.982666666666671
1295.296.1426666666667-0.94266666666667
1394.795.1146666666667-0.414666666666699
1494.795.3813333333333-0.681333333333338
1594.795.4313333333333-0.731333333333335
1695.395.16466666666670.135333333333330
1794.795.298-0.598000000000002
1894.895.3146666666667-0.514666666666673
1994.995.1813333333333-0.281333333333332
2095.495.8313333333333-0.431333333333333
219695.60066666666670.399333333333331
2295.995.60066666666670.299333333333336
2395.895.8606666666667-0.0606666666666712
2495.895.8206666666667-0.0206666666666696
2595.194.79266666666670.307333333333298
2695.295.05933333333330.140666666666668
2795.295.10933333333330.0906666666666705
2895.394.84266666666670.457333333333335
2995.494.9760.424000000000006
3095.394.99266666666670.307333333333332
3195.394.85933333333330.440666666666664
329595.5093333333333-0.509333333333334
3394.995.2786666666667-0.378666666666658
3495.795.27866666666670.421333333333339
3595.795.53866666666670.161333333333340
3696.395.49866666666670.801333333333335
3791.792.874-1.17400000000003
3892.293.1406666666667-0.94066666666667
3992.293.1906666666667-0.990666666666667
4092.692.924-0.324000000000005
419393.0573333333333-0.0573333333333363
429393.074-0.0740000000000018
439392.94066666666670.0593333333333308
4493.793.59066666666670.109333333333333
4593.193.36-0.260000000000006
4693.193.36-0.260000000000006
4793.293.62-0.419999999999997
4893.293.58-0.379999999999995
499392.5520.447999999999972
5093.792.81866666666670.881333333333336
519492.86866666666671.13133333333334
5293.192.6020.498000000000001
5394.292.73533333333331.46466666666667
5494.292.7521.44800000000001
5593.592.61866666666670.881333333333336
569593.26866666666671.73133333333333
5793.793.0380.662000000000008
5893.993.0380.86200000000001
5994.693.2981.302
6093.893.2580.542000000000004
6191.292.23-1.03000000000002
6291.492.4966666666667-1.09666666666666
6391.392.5466666666667-1.24666666666666
6491.592.28-0.779999999999988
6591.592.4133333333333-0.913333333333326
6691.592.43-0.92999999999999
6791.392.2966666666667-0.996666666666661
6892.892.9466666666667-0.146666666666662


Goldfeld-Quandt test for Heteroskedasticity
p-valuesAlternative Hypothesis
breakpoint indexgreater2-sidedless
170.7897676678463440.4204646643073120.210232332153656
180.7418624911681640.5162750176636730.258137508831836
190.6838126520173270.6323746959653460.316187347982673
200.6853530089072930.6292939821854130.314646991092707
210.7169471422948060.5661057154103880.283052857705194
220.8104076090261440.3791847819477120.189592390973856
230.7916304663060990.4167390673878020.208369533693901
240.7619630269884980.4760739460230040.238036973011502
250.6875770995151170.6248458009697660.312422900484883
260.5980138453515790.8039723092968420.401986154648421
270.5041894427310660.9916211145378670.495810557268934
280.445051190086040.890102380172080.55494880991396
290.4127223987265760.8254447974531520.587277601273424
300.3530331629566140.7060663259132280.646966837043386
310.2976339371447520.5952678742895040.702366062855248
320.2445790598760040.4891581197520080.755420940123996
330.1897098054658980.3794196109317970.810290194534101
340.1559591102298560.3119182204597110.844040889770144
350.1224391026173110.2448782052346210.87756089738269
360.1057071014996300.2114142029992590.89429289850037
370.08069022906864760.1613804581372950.919309770931352
380.06294204211176070.1258840842235210.93705795788824
390.052236430037010.104472860074020.94776356996299
400.04065671717914430.08131343435828860.959343282820856
410.03973455069402450.0794691013880490.960265449305975
420.03564045264125530.07128090528251050.964359547358745
430.02643610837453350.05287221674906710.973563891625467
440.0427750562814840.0855501125629680.957224943718516
450.04784885036329590.09569770072659180.952151149636704
460.07910494527061570.1582098905412310.920895054729384
470.4006474101085750.801294820217150.599352589891425
480.9787441998088660.04251160038226760.0212558001911338
490.9682777311432170.06344453771356520.0317222688567826
500.9240296311942960.1519407376114070.0759703688057037
510.8636871155098720.2726257689802560.136312884490128

\begin{tabular}{lllllllll}
\hline
Goldfeld-Quandt test for Heteroskedasticity \tabularnewline
p-values & Alternative Hypothesis \tabularnewline
breakpoint index & greater & 2-sided & less \tabularnewline
17 & 0.789767667846344 & 0.420464664307312 & 0.210232332153656 \tabularnewline
18 & 0.741862491168164 & 0.516275017663673 & 0.258137508831836 \tabularnewline
19 & 0.683812652017327 & 0.632374695965346 & 0.316187347982673 \tabularnewline
20 & 0.685353008907293 & 0.629293982185413 & 0.314646991092707 \tabularnewline
21 & 0.716947142294806 & 0.566105715410388 & 0.283052857705194 \tabularnewline
22 & 0.810407609026144 & 0.379184781947712 & 0.189592390973856 \tabularnewline
23 & 0.791630466306099 & 0.416739067387802 & 0.208369533693901 \tabularnewline
24 & 0.761963026988498 & 0.476073946023004 & 0.238036973011502 \tabularnewline
25 & 0.687577099515117 & 0.624845800969766 & 0.312422900484883 \tabularnewline
26 & 0.598013845351579 & 0.803972309296842 & 0.401986154648421 \tabularnewline
27 & 0.504189442731066 & 0.991621114537867 & 0.495810557268934 \tabularnewline
28 & 0.44505119008604 & 0.89010238017208 & 0.55494880991396 \tabularnewline
29 & 0.412722398726576 & 0.825444797453152 & 0.587277601273424 \tabularnewline
30 & 0.353033162956614 & 0.706066325913228 & 0.646966837043386 \tabularnewline
31 & 0.297633937144752 & 0.595267874289504 & 0.702366062855248 \tabularnewline
32 & 0.244579059876004 & 0.489158119752008 & 0.755420940123996 \tabularnewline
33 & 0.189709805465898 & 0.379419610931797 & 0.810290194534101 \tabularnewline
34 & 0.155959110229856 & 0.311918220459711 & 0.844040889770144 \tabularnewline
35 & 0.122439102617311 & 0.244878205234621 & 0.87756089738269 \tabularnewline
36 & 0.105707101499630 & 0.211414202999259 & 0.89429289850037 \tabularnewline
37 & 0.0806902290686476 & 0.161380458137295 & 0.919309770931352 \tabularnewline
38 & 0.0629420421117607 & 0.125884084223521 & 0.93705795788824 \tabularnewline
39 & 0.05223643003701 & 0.10447286007402 & 0.94776356996299 \tabularnewline
40 & 0.0406567171791443 & 0.0813134343582886 & 0.959343282820856 \tabularnewline
41 & 0.0397345506940245 & 0.079469101388049 & 0.960265449305975 \tabularnewline
42 & 0.0356404526412553 & 0.0712809052825105 & 0.964359547358745 \tabularnewline
43 & 0.0264361083745335 & 0.0528722167490671 & 0.973563891625467 \tabularnewline
44 & 0.042775056281484 & 0.085550112562968 & 0.957224943718516 \tabularnewline
45 & 0.0478488503632959 & 0.0956977007265918 & 0.952151149636704 \tabularnewline
46 & 0.0791049452706157 & 0.158209890541231 & 0.920895054729384 \tabularnewline
47 & 0.400647410108575 & 0.80129482021715 & 0.599352589891425 \tabularnewline
48 & 0.978744199808866 & 0.0425116003822676 & 0.0212558001911338 \tabularnewline
49 & 0.968277731143217 & 0.0634445377135652 & 0.0317222688567826 \tabularnewline
50 & 0.924029631194296 & 0.151940737611407 & 0.0759703688057037 \tabularnewline
51 & 0.863687115509872 & 0.272625768980256 & 0.136312884490128 \tabularnewline
\hline
\end{tabular}
%Source: https://freestatistics.org/blog/index.php?pk=25776&T=5

[TABLE]
[ROW][C]Goldfeld-Quandt test for Heteroskedasticity[/C][/ROW]
[ROW][C]p-values[/C][C]Alternative Hypothesis[/C][/ROW]
[ROW][C]breakpoint index[/C][C]greater[/C][C]2-sided[/C][C]less[/C][/ROW]
[ROW][C]17[/C][C]0.789767667846344[/C][C]0.420464664307312[/C][C]0.210232332153656[/C][/ROW]
[ROW][C]18[/C][C]0.741862491168164[/C][C]0.516275017663673[/C][C]0.258137508831836[/C][/ROW]
[ROW][C]19[/C][C]0.683812652017327[/C][C]0.632374695965346[/C][C]0.316187347982673[/C][/ROW]
[ROW][C]20[/C][C]0.685353008907293[/C][C]0.629293982185413[/C][C]0.314646991092707[/C][/ROW]
[ROW][C]21[/C][C]0.716947142294806[/C][C]0.566105715410388[/C][C]0.283052857705194[/C][/ROW]
[ROW][C]22[/C][C]0.810407609026144[/C][C]0.379184781947712[/C][C]0.189592390973856[/C][/ROW]
[ROW][C]23[/C][C]0.791630466306099[/C][C]0.416739067387802[/C][C]0.208369533693901[/C][/ROW]
[ROW][C]24[/C][C]0.761963026988498[/C][C]0.476073946023004[/C][C]0.238036973011502[/C][/ROW]
[ROW][C]25[/C][C]0.687577099515117[/C][C]0.624845800969766[/C][C]0.312422900484883[/C][/ROW]
[ROW][C]26[/C][C]0.598013845351579[/C][C]0.803972309296842[/C][C]0.401986154648421[/C][/ROW]
[ROW][C]27[/C][C]0.504189442731066[/C][C]0.991621114537867[/C][C]0.495810557268934[/C][/ROW]
[ROW][C]28[/C][C]0.44505119008604[/C][C]0.89010238017208[/C][C]0.55494880991396[/C][/ROW]
[ROW][C]29[/C][C]0.412722398726576[/C][C]0.825444797453152[/C][C]0.587277601273424[/C][/ROW]
[ROW][C]30[/C][C]0.353033162956614[/C][C]0.706066325913228[/C][C]0.646966837043386[/C][/ROW]
[ROW][C]31[/C][C]0.297633937144752[/C][C]0.595267874289504[/C][C]0.702366062855248[/C][/ROW]
[ROW][C]32[/C][C]0.244579059876004[/C][C]0.489158119752008[/C][C]0.755420940123996[/C][/ROW]
[ROW][C]33[/C][C]0.189709805465898[/C][C]0.379419610931797[/C][C]0.810290194534101[/C][/ROW]
[ROW][C]34[/C][C]0.155959110229856[/C][C]0.311918220459711[/C][C]0.844040889770144[/C][/ROW]
[ROW][C]35[/C][C]0.122439102617311[/C][C]0.244878205234621[/C][C]0.87756089738269[/C][/ROW]
[ROW][C]36[/C][C]0.105707101499630[/C][C]0.211414202999259[/C][C]0.89429289850037[/C][/ROW]
[ROW][C]37[/C][C]0.0806902290686476[/C][C]0.161380458137295[/C][C]0.919309770931352[/C][/ROW]
[ROW][C]38[/C][C]0.0629420421117607[/C][C]0.125884084223521[/C][C]0.93705795788824[/C][/ROW]
[ROW][C]39[/C][C]0.05223643003701[/C][C]0.10447286007402[/C][C]0.94776356996299[/C][/ROW]
[ROW][C]40[/C][C]0.0406567171791443[/C][C]0.0813134343582886[/C][C]0.959343282820856[/C][/ROW]
[ROW][C]41[/C][C]0.0397345506940245[/C][C]0.079469101388049[/C][C]0.960265449305975[/C][/ROW]
[ROW][C]42[/C][C]0.0356404526412553[/C][C]0.0712809052825105[/C][C]0.964359547358745[/C][/ROW]
[ROW][C]43[/C][C]0.0264361083745335[/C][C]0.0528722167490671[/C][C]0.973563891625467[/C][/ROW]
[ROW][C]44[/C][C]0.042775056281484[/C][C]0.085550112562968[/C][C]0.957224943718516[/C][/ROW]
[ROW][C]45[/C][C]0.0478488503632959[/C][C]0.0956977007265918[/C][C]0.952151149636704[/C][/ROW]
[ROW][C]46[/C][C]0.0791049452706157[/C][C]0.158209890541231[/C][C]0.920895054729384[/C][/ROW]
[ROW][C]47[/C][C]0.400647410108575[/C][C]0.80129482021715[/C][C]0.599352589891425[/C][/ROW]
[ROW][C]48[/C][C]0.978744199808866[/C][C]0.0425116003822676[/C][C]0.0212558001911338[/C][/ROW]
[ROW][C]49[/C][C]0.968277731143217[/C][C]0.0634445377135652[/C][C]0.0317222688567826[/C][/ROW]
[ROW][C]50[/C][C]0.924029631194296[/C][C]0.151940737611407[/C][C]0.0759703688057037[/C][/ROW]
[ROW][C]51[/C][C]0.863687115509872[/C][C]0.272625768980256[/C][C]0.136312884490128[/C][/ROW]
[/TABLE]
Source: https://freestatistics.org/blog/index.php?pk=25776&T=5

Globally Unique Identifier (entire table): ba.freestatistics.org/blog/index.php?pk=25776&T=5

As an alternative you can also use a QR Code:  

The GUIDs for individual cells are displayed in the table below:

Goldfeld-Quandt test for Heteroskedasticity
p-valuesAlternative Hypothesis
breakpoint indexgreater2-sidedless
170.7897676678463440.4204646643073120.210232332153656
180.7418624911681640.5162750176636730.258137508831836
190.6838126520173270.6323746959653460.316187347982673
200.6853530089072930.6292939821854130.314646991092707
210.7169471422948060.5661057154103880.283052857705194
220.8104076090261440.3791847819477120.189592390973856
230.7916304663060990.4167390673878020.208369533693901
240.7619630269884980.4760739460230040.238036973011502
250.6875770995151170.6248458009697660.312422900484883
260.5980138453515790.8039723092968420.401986154648421
270.5041894427310660.9916211145378670.495810557268934
280.445051190086040.890102380172080.55494880991396
290.4127223987265760.8254447974531520.587277601273424
300.3530331629566140.7060663259132280.646966837043386
310.2976339371447520.5952678742895040.702366062855248
320.2445790598760040.4891581197520080.755420940123996
330.1897098054658980.3794196109317970.810290194534101
340.1559591102298560.3119182204597110.844040889770144
350.1224391026173110.2448782052346210.87756089738269
360.1057071014996300.2114142029992590.89429289850037
370.08069022906864760.1613804581372950.919309770931352
380.06294204211176070.1258840842235210.93705795788824
390.052236430037010.104472860074020.94776356996299
400.04065671717914430.08131343435828860.959343282820856
410.03973455069402450.0794691013880490.960265449305975
420.03564045264125530.07128090528251050.964359547358745
430.02643610837453350.05287221674906710.973563891625467
440.0427750562814840.0855501125629680.957224943718516
450.04784885036329590.09569770072659180.952151149636704
460.07910494527061570.1582098905412310.920895054729384
470.4006474101085750.801294820217150.599352589891425
480.9787441998088660.04251160038226760.0212558001911338
490.9682777311432170.06344453771356520.0317222688567826
500.9240296311942960.1519407376114070.0759703688057037
510.8636871155098720.2726257689802560.136312884490128


Meta Analysis of Goldfeld-Quandt test for Heteroskedasticity
Description# significant tests% significant testsOK/NOK
1% type I error level00OK
5% type I error level10.0285714285714286OK
10% type I error level80.228571428571429NOK

\begin{tabular}{lllllllll}
\hline
Meta Analysis of Goldfeld-Quandt test for Heteroskedasticity \tabularnewline
Description & # significant tests & % significant tests & OK/NOK \tabularnewline
1% type I error level & 0 & 0 & OK \tabularnewline
5% type I error level & 1 & 0.0285714285714286 & OK \tabularnewline
10% type I error level & 8 & 0.228571428571429 & NOK \tabularnewline
\hline
\end{tabular}
%Source: https://freestatistics.org/blog/index.php?pk=25776&T=6

[TABLE]
[ROW][C]Meta Analysis of Goldfeld-Quandt test for Heteroskedasticity[/C][/ROW]
[ROW][C]Description[/C][C]# significant tests[/C][C]% significant tests[/C][C]OK/NOK[/C][/ROW]
[ROW][C]1% type I error level[/C][C]0[/C][C]0[/C][C]OK[/C][/ROW]
[ROW][C]5% type I error level[/C][C]1[/C][C]0.0285714285714286[/C][C]OK[/C][/ROW]
[ROW][C]10% type I error level[/C][C]8[/C][C]0.228571428571429[/C][C]NOK[/C][/ROW]
[/TABLE]
Source: https://freestatistics.org/blog/index.php?pk=25776&T=6

Globally Unique Identifier (entire table): ba.freestatistics.org/blog/index.php?pk=25776&T=6

As an alternative you can also use a QR Code:  

The GUIDs for individual cells are displayed in the table below:

Meta Analysis of Goldfeld-Quandt test for Heteroskedasticity
Description# significant tests% significant testsOK/NOK
1% type I error level00OK
5% type I error level10.0285714285714286OK
10% type I error level80.228571428571429NOK


Parameters (Session):
par1 = 1 ; par2 = Include Monthly Dummies ; par3 = Linear Trend ;
Parameters (R input):
par1 = 1 ; par2 = Include Monthly Dummies ; par3 = Linear Trend ;
R code (references can be found in the software module):
library(lattice)
library(lmtest)
n25 <- 25 #minimum number of obs. for Goldfeld-Quandt test
par1 <- as.numeric(par1)
x <- t(y)
k <- length(x[1,])
n <- length(x[,1])
x1 <- cbind(x[,par1], x[,1:k!=par1])
mycolnames <- c(colnames(x)[par1], colnames(x)[1:k!=par1])
colnames(x1) <- mycolnames #colnames(x)[par1]
x <- x1
if (par3 == 'First Differences'){
x2 <- array(0, dim=c(n-1,k), dimnames=list(1:(n-1), paste('(1-B)',colnames(x),sep='')))
for (i in 1:n-1) {
for (j in 1:k) {
x2[i,j] <- x[i+1,j] - x[i,j]
}
}
x <- x2
}
if (par2 == 'Include Monthly Dummies'){
x2 <- array(0, dim=c(n,11), dimnames=list(1:n, paste('M', seq(1:11), sep ='')))
for (i in 1:11){
x2[seq(i,n,12),i] <- 1
}
x <- cbind(x, x2)
}
if (par2 == 'Include Quarterly Dummies'){
x2 <- array(0, dim=c(n,3), dimnames=list(1:n, paste('Q', seq(1:3), sep ='')))
for (i in 1:3){
x2[seq(i,n,4),i] <- 1
}
x <- cbind(x, x2)
}
k <- length(x[1,])
if (par3 == 'Linear Trend'){
x <- cbind(x, c(1:n))
colnames(x)[k+1] <- 't'
}
x
k <- length(x[1,])
df <- as.data.frame(x)
(mylm <- lm(df))
(mysum <- summary(mylm))
if (n > n25) {
kp3 <- k + 3
nmkm3 <- n - k - 3
gqarr <- array(NA, dim=c(nmkm3-kp3+1,3))
numgqtests <- 0
numsignificant1 <- 0
numsignificant5 <- 0
numsignificant10 <- 0
for (mypoint in kp3:nmkm3) {
j <- 0
numgqtests <- numgqtests + 1
for (myalt in c('greater', 'two.sided', 'less')) {
j <- j + 1
gqarr[mypoint-kp3+1,j] <- gqtest(mylm, point=mypoint, alternative=myalt)$p.value
}
if (gqarr[mypoint-kp3+1,2] < 0.01) numsignificant1 <- numsignificant1 + 1
if (gqarr[mypoint-kp3+1,2] < 0.05) numsignificant5 <- numsignificant5 + 1
if (gqarr[mypoint-kp3+1,2] < 0.10) numsignificant10 <- numsignificant10 + 1
}
gqarr
}
bitmap(file='test0.png')
plot(x[,1], type='l', main='Actuals and Interpolation', ylab='value of Actuals and Interpolation (dots)', xlab='time or index')
points(x[,1]-mysum$resid)
grid()
dev.off()
bitmap(file='test1.png')
plot(mysum$resid, type='b', pch=19, main='Residuals', ylab='value of Residuals', xlab='time or index')
grid()
dev.off()
bitmap(file='test2.png')
hist(mysum$resid, main='Residual Histogram', xlab='values of Residuals')
grid()
dev.off()
bitmap(file='test3.png')
densityplot(~mysum$resid,col='black',main='Residual Density Plot', xlab='values of Residuals')
dev.off()
bitmap(file='test4.png')
qqnorm(mysum$resid, main='Residual Normal Q-Q Plot')
qqline(mysum$resid)
grid()
dev.off()
(myerror <- as.ts(mysum$resid))
bitmap(file='test5.png')
dum <- cbind(lag(myerror,k=1),myerror)
dum
dum1 <- dum[2:length(myerror),]
dum1
z <- as.data.frame(dum1)
z
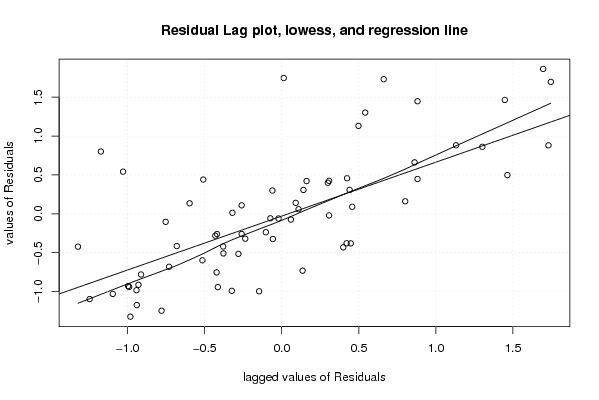
plot(z,main=paste('Residual Lag plot, lowess, and regression line'), ylab='values of Residuals', xlab='lagged values of Residuals')
lines(lowess(z))
abline(lm(z))
grid()
dev.off()
bitmap(file='test6.png')
acf(mysum$resid, lag.max=length(mysum$resid)/2, main='Residual Autocorrelation Function')
grid()
dev.off()
bitmap(file='test7.png')
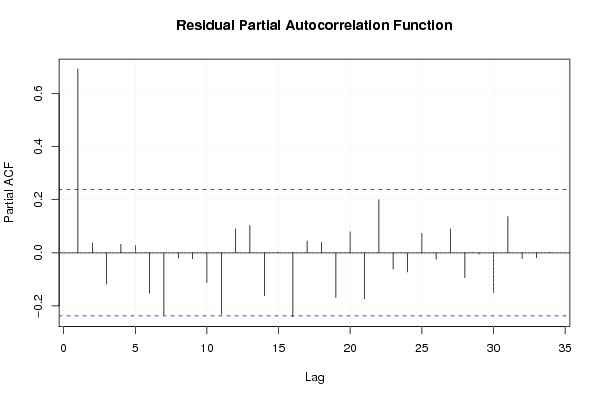
pacf(mysum$resid, lag.max=length(mysum$resid)/2, main='Residual Partial Autocorrelation Function')
grid()
dev.off()
bitmap(file='test8.png')
opar <- par(mfrow = c(2,2), oma = c(0, 0, 1.1, 0))
plot(mylm, las = 1, sub='Residual Diagnostics')
par(opar)
dev.off()
if (n > n25) {
bitmap(file='test9.png')
plot(kp3:nmkm3,gqarr[,2], main='Goldfeld-Quandt test',ylab='2-sided p-value',xlab='breakpoint')
grid()
dev.off()
}
load(file='createtable')
a<-table.start()
a<-table.row.start(a)
a<-table.element(a, 'Multiple Linear Regression - Estimated Regression Equation', 1, TRUE)
a<-table.row.end(a)
myeq <- colnames(x)[1]
myeq <- paste(myeq, '[t] = ', sep='')
for (i in 1:k){
if (mysum$coefficients[i,1] > 0) myeq <- paste(myeq, '+', '')
myeq <- paste(myeq, mysum$coefficients[i,1], sep=' ')
if (rownames(mysum$coefficients)[i] != '(Intercept)') {
myeq <- paste(myeq, rownames(mysum$coefficients)[i], sep='')
if (rownames(mysum$coefficients)[i] != 't') myeq <- paste(myeq, '[t]', sep='')
}
}
myeq <- paste(myeq, ' + e[t]')
a<-table.row.start(a)
a<-table.element(a, myeq)
a<-table.row.end(a)
a<-table.end(a)
table.save(a,file='mytable1.tab')
a<-table.start()
a<-table.row.start(a)
a<-table.element(a,hyperlink('ols1.htm','Multiple Linear Regression - Ordinary Least Squares',''), 6, TRUE)
a<-table.row.end(a)
a<-table.row.start(a)
a<-table.element(a,'Variable',header=TRUE)
a<-table.element(a,'Parameter',header=TRUE)
a<-table.element(a,'S.D.',header=TRUE)
a<-table.element(a,'T-STAT
H0: parameter = 0',header=TRUE)
a<-table.element(a,'2-tail p-value',header=TRUE)
a<-table.element(a,'1-tail p-value',header=TRUE)
a<-table.row.end(a)
for (i in 1:k){
a<-table.row.start(a)
a<-table.element(a,rownames(mysum$coefficients)[i],header=TRUE)
a<-table.element(a,mysum$coefficients[i,1])
a<-table.element(a, round(mysum$coefficients[i,2],6))
a<-table.element(a, round(mysum$coefficients[i,3],4))
a<-table.element(a, round(mysum$coefficients[i,4],6))
a<-table.element(a, round(mysum$coefficients[i,4]/2,6))
a<-table.row.end(a)
}
a<-table.end(a)
table.save(a,file='mytable2.tab')
a<-table.start()
a<-table.row.start(a)
a<-table.element(a, 'Multiple Linear Regression - Regression Statistics', 2, TRUE)
a<-table.row.end(a)
a<-table.row.start(a)
a<-table.element(a, 'Multiple R',1,TRUE)
a<-table.element(a, sqrt(mysum$r.squared))
a<-table.row.end(a)
a<-table.row.start(a)
a<-table.element(a, 'R-squared',1,TRUE)
a<-table.element(a, mysum$r.squared)
a<-table.row.end(a)
a<-table.row.start(a)
a<-table.element(a, 'Adjusted R-squared',1,TRUE)
a<-table.element(a, mysum$adj.r.squared)
a<-table.row.end(a)
a<-table.row.start(a)
a<-table.element(a, 'F-TEST (value)',1,TRUE)
a<-table.element(a, mysum$fstatistic[1])
a<-table.row.end(a)
a<-table.row.start(a)
a<-table.element(a, 'F-TEST (DF numerator)',1,TRUE)
a<-table.element(a, mysum$fstatistic[2])
a<-table.row.end(a)
a<-table.row.start(a)
a<-table.element(a, 'F-TEST (DF denominator)',1,TRUE)
a<-table.element(a, mysum$fstatistic[3])
a<-table.row.end(a)
a<-table.row.start(a)
a<-table.element(a, 'p-value',1,TRUE)
a<-table.element(a, 1-pf(mysum$fstatistic[1],mysum$fstatistic[2],mysum$fstatistic[3]))
a<-table.row.end(a)
a<-table.row.start(a)
a<-table.element(a, 'Multiple Linear Regression - Residual Statistics', 2, TRUE)
a<-table.row.end(a)
a<-table.row.start(a)
a<-table.element(a, 'Residual Standard Deviation',1,TRUE)
a<-table.element(a, mysum$sigma)
a<-table.row.end(a)
a<-table.row.start(a)
a<-table.element(a, 'Sum Squared Residuals',1,TRUE)
a<-table.element(a, sum(myerror*myerror))
a<-table.row.end(a)
a<-table.end(a)
table.save(a,file='mytable3.tab')
a<-table.start()
a<-table.row.start(a)
a<-table.element(a, 'Multiple Linear Regression - Actuals, Interpolation, and Residuals', 4, TRUE)
a<-table.row.end(a)
a<-table.row.start(a)
a<-table.element(a, 'Time or Index', 1, TRUE)
a<-table.element(a, 'Actuals', 1, TRUE)
a<-table.element(a, 'Interpolation
Forecast', 1, TRUE)
a<-table.element(a, 'Residuals
Prediction Error', 1, TRUE)
a<-table.row.end(a)
for (i in 1:n) {
a<-table.row.start(a)
a<-table.element(a,i, 1, TRUE)
a<-table.element(a,x[i])
a<-table.element(a,x[i]-mysum$resid[i])
a<-table.element(a,mysum$resid[i])
a<-table.row.end(a)
}
a<-table.end(a)
table.save(a,file='mytable4.tab')
if (n > n25) {
a<-table.start()
a<-table.row.start(a)
a<-table.element(a,'Goldfeld-Quandt test for Heteroskedasticity',4,TRUE)
a<-table.row.end(a)
a<-table.row.start(a)
a<-table.element(a,'p-values',header=TRUE)
a<-table.element(a,'Alternative Hypothesis',3,header=TRUE)
a<-table.row.end(a)
a<-table.row.start(a)
a<-table.element(a,'breakpoint index',header=TRUE)
a<-table.element(a,'greater',header=TRUE)
a<-table.element(a,'2-sided',header=TRUE)
a<-table.element(a,'less',header=TRUE)
a<-table.row.end(a)
for (mypoint in kp3:nmkm3) {
a<-table.row.start(a)
a<-table.element(a,mypoint,header=TRUE)
a<-table.element(a,gqarr[mypoint-kp3+1,1])
a<-table.element(a,gqarr[mypoint-kp3+1,2])
a<-table.element(a,gqarr[mypoint-kp3+1,3])
a<-table.row.end(a)
}
a<-table.end(a)
table.save(a,file='mytable5.tab')
a<-table.start()
a<-table.row.start(a)
a<-table.element(a,'Meta Analysis of Goldfeld-Quandt test for Heteroskedasticity',4,TRUE)
a<-table.row.end(a)
a<-table.row.start(a)
a<-table.element(a,'Description',header=TRUE)
a<-table.element(a,'# significant tests',header=TRUE)
a<-table.element(a,'% significant tests',header=TRUE)
a<-table.element(a,'OK/NOK',header=TRUE)
a<-table.row.end(a)
a<-table.row.start(a)
a<-table.element(a,'1% type I error level',header=TRUE)
a<-table.element(a,numsignificant1)
a<-table.element(a,numsignificant1/numgqtests)
if (numsignificant1/numgqtests < 0.01) dum <- 'OK' else dum <- 'NOK'
a<-table.element(a,dum)
a<-table.row.end(a)
a<-table.row.start(a)
a<-table.element(a,'5% type I error level',header=TRUE)
a<-table.element(a,numsignificant5)
a<-table.element(a,numsignificant5/numgqtests)
if (numsignificant5/numgqtests < 0.05) dum <- 'OK' else dum <- 'NOK'
a<-table.element(a,dum)
a<-table.row.end(a)
a<-table.row.start(a)
a<-table.element(a,'10% type I error level',header=TRUE)
a<-table.element(a,numsignificant10)
a<-table.element(a,numsignificant10/numgqtests)
if (numsignificant10/numgqtests < 0.1) dum <- 'OK' else dum <- 'NOK'
a<-table.element(a,dum)
a<-table.row.end(a)
a<-table.end(a)
table.save(a,file='mytable6.tab')
}