Free Statistics

of Irreproducible Research!

Author's title

Author*The author of this computation has been verified*
R Software Modulerwasp_multipleregression.wasp
Title produced by softwareMultiple Regression
Date of computationThu, 27 Nov 2008 05:14:47 -0700
Cite this page as followsStatistical Computations at FreeStatistics.org, Office for Research Development and Education, URL https://freestatistics.org/blog/index.php?v=date/2008/Nov/27/t1227788183pf4azlvi6u109ut.htm/, Retrieved Mon, 20 May 2024 12:25:59 +0000
Statistical Computations at FreeStatistics.org, Office for Research Development and Education, URL https://freestatistics.org/blog/index.php?pk=25770, Retrieved Mon, 20 May 2024 12:25:59 +0000
QR Codes:

Original text written by user:
IsPrivate?No (this computation is public)
User-defined keywordsno seasonal dummies no trendline
Estimated Impact183
Family? (F = Feedback message, R = changed R code, M = changed R Module, P = changed Parameters, D = changed Data)
-     [Multiple Regression] [Case: the Seatbel...] [2008-11-26 16:42:24] [b6c777429d07a05453509ef079833861]
- R  D    [Multiple Regression] [Case Seatbelt Q3 A] [2008-11-27 12:14:47] [c5d6d05aee6be5527ac4a30a8c3b8fe5] [Current]
Feedback Forum

Post a new message
Dataseries X:
239,4	192
321,9	231,2
362,7	250,8
413,6	268,4
407,1	266,9
383,2	268,5
347,7	268,2
333,8	265,3
312,3	253,8
295,4	243,4
283,3	213,6
287,6	221
265,7	227,3
250,2	221,6
234,7	222,1
244	232,2
231,2	229,6
223,8	238,9
223,5	238,2
210,5	223,9
201,6	215
190,7	211,1
207,5	210,6
198,8	206,6
196,6	207
204,2	201,7
227,4	204,5
229,7	204,5
217,9	195,1
221,4	205,5
216,3	187,5
197	173,5
193,8	172,3
196,8	167,5
180,5	157,5
174,8	151,1
181,6	148,5
190	147,9
190,6	145,6
179	139,8
174,1	138,9
161,1	141,4
168,6	148,7
169,4	150,9
152,2	147,3
148,3	144,5
137,7	134
145	135,1
153,4	131,4
141,7	128,4
142,7	127,6
135,9	127,4
131,8	124
134,6	123,5
127,5	128
126,5	129,9
118,7	127,6
117,1	121,8
110,7	114,1
107,1	111,4
105,4	109,1


Summary of computational transaction
Raw Inputview raw input (R code)
Raw Outputview raw output of R engine
Computing time4 seconds
R Server'Gwilym Jenkins' @ 72.249.127.135

\begin{tabular}{lllllllll}
\hline
Summary of computational transaction \tabularnewline
Raw Input & view raw input (R code)  \tabularnewline
Raw Output & view raw output of R engine  \tabularnewline
Computing time & 4 seconds \tabularnewline
R Server & 'Gwilym Jenkins' @ 72.249.127.135 \tabularnewline
\hline
\end{tabular}
%Source: https://freestatistics.org/blog/index.php?pk=25770&T=0

[TABLE]
[ROW][C]Summary of computational transaction[/C][/ROW]
[ROW][C]Raw Input[/C][C]view raw input (R code) [/C][/ROW]
[ROW][C]Raw Output[/C][C]view raw output of R engine [/C][/ROW]
[ROW][C]Computing time[/C][C]4 seconds[/C][/ROW]
[ROW][C]R Server[/C][C]'Gwilym Jenkins' @ 72.249.127.135[/C][/ROW]
[/TABLE]
Source: https://freestatistics.org/blog/index.php?pk=25770&T=0

Globally Unique Identifier (entire table): ba.freestatistics.org/blog/index.php?pk=25770&T=0

As an alternative you can also use a QR Code:  

The GUIDs for individual cells are displayed in the table below:

Summary of computational transaction
Raw Inputview raw input (R code)
Raw Outputview raw output of R engine
Computing time4 seconds
R Server'Gwilym Jenkins' @ 72.249.127.135


Multiple Linear Regression - Estimated Regression Equation
alg_indexcijfer_grondstoffen[t] = -46.0196124318759 + 1.39462324342885indexcijfer_industr_grondstoffen[t] + e[t]

\begin{tabular}{lllllllll}
\hline
Multiple Linear Regression - Estimated Regression Equation \tabularnewline
alg_indexcijfer_grondstoffen[t] =  -46.0196124318759 +  1.39462324342885indexcijfer_industr_grondstoffen[t]  + e[t] \tabularnewline
\hline
\end{tabular}
%Source: https://freestatistics.org/blog/index.php?pk=25770&T=1

[TABLE]
[ROW][C]Multiple Linear Regression - Estimated Regression Equation[/C][/ROW]
[ROW][C]alg_indexcijfer_grondstoffen[t] =  -46.0196124318759 +  1.39462324342885indexcijfer_industr_grondstoffen[t]  + e[t][/C][/ROW]
[/TABLE]
Source: https://freestatistics.org/blog/index.php?pk=25770&T=1

Globally Unique Identifier (entire table): ba.freestatistics.org/blog/index.php?pk=25770&T=1

As an alternative you can also use a QR Code:  

The GUIDs for individual cells are displayed in the table below:

Multiple Linear Regression - Estimated Regression Equation
alg_indexcijfer_grondstoffen[t] = -46.0196124318759 + 1.39462324342885indexcijfer_industr_grondstoffen[t] + e[t]


Multiple Linear Regression - Ordinary Least Squares
VariableParameterS.D.T-STATH0: parameter = 02-tail p-value1-tail p-value
(Intercept)-46.019612431875915.708824-2.92950.004820.00241
indexcijfer_industr_grondstoffen1.394623243428850.08287116.828800

\begin{tabular}{lllllllll}
\hline
Multiple Linear Regression - Ordinary Least Squares \tabularnewline
Variable & Parameter & S.D. & T-STATH0: parameter = 0 & 2-tail p-value & 1-tail p-value \tabularnewline
(Intercept) & -46.0196124318759 & 15.708824 & -2.9295 & 0.00482 & 0.00241 \tabularnewline
indexcijfer_industr_grondstoffen & 1.39462324342885 & 0.082871 & 16.8288 & 0 & 0 \tabularnewline
\hline
\end{tabular}
%Source: https://freestatistics.org/blog/index.php?pk=25770&T=2

[TABLE]
[ROW][C]Multiple Linear Regression - Ordinary Least Squares[/C][/ROW]
[ROW][C]Variable[/C][C]Parameter[/C][C]S.D.[/C][C]T-STATH0: parameter = 0[/C][C]2-tail p-value[/C][C]1-tail p-value[/C][/ROW]
[ROW][C](Intercept)[/C][C]-46.0196124318759[/C][C]15.708824[/C][C]-2.9295[/C][C]0.00482[/C][C]0.00241[/C][/ROW]
[ROW][C]indexcijfer_industr_grondstoffen[/C][C]1.39462324342885[/C][C]0.082871[/C][C]16.8288[/C][C]0[/C][C]0[/C][/ROW]
[/TABLE]
Source: https://freestatistics.org/blog/index.php?pk=25770&T=2

Globally Unique Identifier (entire table): ba.freestatistics.org/blog/index.php?pk=25770&T=2

As an alternative you can also use a QR Code:  

The GUIDs for individual cells are displayed in the table below:

Multiple Linear Regression - Ordinary Least Squares
VariableParameterS.D.T-STATH0: parameter = 02-tail p-value1-tail p-value
(Intercept)-46.019612431875915.708824-2.92950.004820.00241
indexcijfer_industr_grondstoffen1.394623243428850.08287116.828800


Multiple Linear Regression - Regression Statistics
Multiple R0.90972043899777
R-squared0.827591277130294
Adjusted R-squared0.82466909538674
F-TEST (value)283.210063493064
F-TEST (DF numerator)1
F-TEST (DF denominator)59
p-value0
Multiple Linear Regression - Residual Statistics
Residual Standard Deviation31.5283252453648
Sum Squared Residuals58648.082273873

\begin{tabular}{lllllllll}
\hline
Multiple Linear Regression - Regression Statistics \tabularnewline
Multiple R & 0.90972043899777 \tabularnewline
R-squared & 0.827591277130294 \tabularnewline
Adjusted R-squared & 0.82466909538674 \tabularnewline
F-TEST (value) & 283.210063493064 \tabularnewline
F-TEST (DF numerator) & 1 \tabularnewline
F-TEST (DF denominator) & 59 \tabularnewline
p-value & 0 \tabularnewline
Multiple Linear Regression - Residual Statistics \tabularnewline
Residual Standard Deviation & 31.5283252453648 \tabularnewline
Sum Squared Residuals & 58648.082273873 \tabularnewline
\hline
\end{tabular}
%Source: https://freestatistics.org/blog/index.php?pk=25770&T=3

[TABLE]
[ROW][C]Multiple Linear Regression - Regression Statistics[/C][/ROW]
[ROW][C]Multiple R[/C][C]0.90972043899777[/C][/ROW]
[ROW][C]R-squared[/C][C]0.827591277130294[/C][/ROW]
[ROW][C]Adjusted R-squared[/C][C]0.82466909538674[/C][/ROW]
[ROW][C]F-TEST (value)[/C][C]283.210063493064[/C][/ROW]
[ROW][C]F-TEST (DF numerator)[/C][C]1[/C][/ROW]
[ROW][C]F-TEST (DF denominator)[/C][C]59[/C][/ROW]
[ROW][C]p-value[/C][C]0[/C][/ROW]
[ROW][C]Multiple Linear Regression - Residual Statistics[/C][/ROW]
[ROW][C]Residual Standard Deviation[/C][C]31.5283252453648[/C][/ROW]
[ROW][C]Sum Squared Residuals[/C][C]58648.082273873[/C][/ROW]
[/TABLE]
Source: https://freestatistics.org/blog/index.php?pk=25770&T=3

Globally Unique Identifier (entire table): ba.freestatistics.org/blog/index.php?pk=25770&T=3

As an alternative you can also use a QR Code:  

The GUIDs for individual cells are displayed in the table below:

Multiple Linear Regression - Regression Statistics
Multiple R0.90972043899777
R-squared0.827591277130294
Adjusted R-squared0.82466909538674
F-TEST (value)283.210063493064
F-TEST (DF numerator)1
F-TEST (DF denominator)59
p-value0
Multiple Linear Regression - Residual Statistics
Residual Standard Deviation31.5283252453648
Sum Squared Residuals58648.082273873


Multiple Linear Regression - Actuals, Interpolation, and Residuals
Time or IndexActualsInterpolationForecastResidualsPrediction Error
1239.4221.74805030646517.651949693535
2321.9276.41728144887645.4827185511244
3362.7303.75189702008158.948102979919
4413.6328.29726610442985.3027338955712
5407.1326.20533123928580.8946687607145
6383.2328.43672842877254.7632715712283
7347.7328.01834145574319.6816585442570
8333.8323.9739340497999.82606595020062
9312.3307.9357667503684.36423324963245
10295.4293.4316850187071.96831498129252
11283.3251.87191236452831.4280876354724
12287.6262.19212436590125.4078756340989
13265.7270.978250799503-5.27825079950291
14250.2263.028898311958-12.8288983119584
15234.7263.726209933673-29.0262099336728
16244277.811904692304-33.8119046923043
17231.2274.185884259389-42.9858842593893
18223.8287.155880423278-63.3558804232776
19223.5286.179644152877-62.6796441528774
20210.5266.236531771845-55.7365317718448
21201.6253.824384905328-52.224384905328
22190.7248.385354255955-57.6853542559554
23207.5247.688042634241-40.188042634241
24198.8242.109549660526-43.3095496605256
25196.6242.667398957897-46.0673989578971
26204.2235.275895767724-31.0758957677242
27227.4239.180840849325-11.780840849325
28229.7239.180840849325-9.480840849325
29217.9226.071382361094-8.17138236109375
30221.4240.575464092754-19.1754640927538
31216.3215.4722457110340.827754288965548
32197195.9475203030311.05247969696950
33193.8194.273972410916-0.473972410915874
34196.8187.5797808424579.22021915754265
35180.5173.6335484081696.86645159183118
36174.8164.70795965022410.0920403497759
37181.6161.08193921730920.5180607826909
38190160.24516527125229.7548347287482
39190.6157.03753181136533.5624681886346
40179148.94871699947830.0512830005219
41174.1147.69355608039226.4064439196079
42161.1151.1801141889649.91988581103574
43168.6161.3608638659957.23913613400512
44169.4164.4290350015384.97096499846163
45152.2159.408391325195-7.20839132519452
46148.3155.503446243594-7.2034462435937
47137.7140.859902187591-3.15990218759073
48145142.3939877553622.60601224463754
49153.4137.23388175467616.1661182453243
50141.7133.0500120243898.64998797561084
51142.7131.93431342964610.7656865703539
52135.9131.6553887809604.24461121903972
53131.8126.9136697533024.88633024669783
54134.6126.2163581315888.38364186841225
55127.5132.492162727018-4.9921627270176
56126.5135.141946889532-8.64194688953242
57118.7131.934313429646-13.2343134296460
58117.1123.845498617759-6.74549861775869
59110.7113.106899643356-2.4068996433565
60107.1109.341416886099-2.24141688609862
61105.4106.133783426212-0.733783426212228

\begin{tabular}{lllllllll}
\hline
Multiple Linear Regression - Actuals, Interpolation, and Residuals \tabularnewline
Time or Index & Actuals & InterpolationForecast & ResidualsPrediction Error \tabularnewline
1 & 239.4 & 221.748050306465 & 17.651949693535 \tabularnewline
2 & 321.9 & 276.417281448876 & 45.4827185511244 \tabularnewline
3 & 362.7 & 303.751897020081 & 58.948102979919 \tabularnewline
4 & 413.6 & 328.297266104429 & 85.3027338955712 \tabularnewline
5 & 407.1 & 326.205331239285 & 80.8946687607145 \tabularnewline
6 & 383.2 & 328.436728428772 & 54.7632715712283 \tabularnewline
7 & 347.7 & 328.018341455743 & 19.6816585442570 \tabularnewline
8 & 333.8 & 323.973934049799 & 9.82606595020062 \tabularnewline
9 & 312.3 & 307.935766750368 & 4.36423324963245 \tabularnewline
10 & 295.4 & 293.431685018707 & 1.96831498129252 \tabularnewline
11 & 283.3 & 251.871912364528 & 31.4280876354724 \tabularnewline
12 & 287.6 & 262.192124365901 & 25.4078756340989 \tabularnewline
13 & 265.7 & 270.978250799503 & -5.27825079950291 \tabularnewline
14 & 250.2 & 263.028898311958 & -12.8288983119584 \tabularnewline
15 & 234.7 & 263.726209933673 & -29.0262099336728 \tabularnewline
16 & 244 & 277.811904692304 & -33.8119046923043 \tabularnewline
17 & 231.2 & 274.185884259389 & -42.9858842593893 \tabularnewline
18 & 223.8 & 287.155880423278 & -63.3558804232776 \tabularnewline
19 & 223.5 & 286.179644152877 & -62.6796441528774 \tabularnewline
20 & 210.5 & 266.236531771845 & -55.7365317718448 \tabularnewline
21 & 201.6 & 253.824384905328 & -52.224384905328 \tabularnewline
22 & 190.7 & 248.385354255955 & -57.6853542559554 \tabularnewline
23 & 207.5 & 247.688042634241 & -40.188042634241 \tabularnewline
24 & 198.8 & 242.109549660526 & -43.3095496605256 \tabularnewline
25 & 196.6 & 242.667398957897 & -46.0673989578971 \tabularnewline
26 & 204.2 & 235.275895767724 & -31.0758957677242 \tabularnewline
27 & 227.4 & 239.180840849325 & -11.780840849325 \tabularnewline
28 & 229.7 & 239.180840849325 & -9.480840849325 \tabularnewline
29 & 217.9 & 226.071382361094 & -8.17138236109375 \tabularnewline
30 & 221.4 & 240.575464092754 & -19.1754640927538 \tabularnewline
31 & 216.3 & 215.472245711034 & 0.827754288965548 \tabularnewline
32 & 197 & 195.947520303031 & 1.05247969696950 \tabularnewline
33 & 193.8 & 194.273972410916 & -0.473972410915874 \tabularnewline
34 & 196.8 & 187.579780842457 & 9.22021915754265 \tabularnewline
35 & 180.5 & 173.633548408169 & 6.86645159183118 \tabularnewline
36 & 174.8 & 164.707959650224 & 10.0920403497759 \tabularnewline
37 & 181.6 & 161.081939217309 & 20.5180607826909 \tabularnewline
38 & 190 & 160.245165271252 & 29.7548347287482 \tabularnewline
39 & 190.6 & 157.037531811365 & 33.5624681886346 \tabularnewline
40 & 179 & 148.948716999478 & 30.0512830005219 \tabularnewline
41 & 174.1 & 147.693556080392 & 26.4064439196079 \tabularnewline
42 & 161.1 & 151.180114188964 & 9.91988581103574 \tabularnewline
43 & 168.6 & 161.360863865995 & 7.23913613400512 \tabularnewline
44 & 169.4 & 164.429035001538 & 4.97096499846163 \tabularnewline
45 & 152.2 & 159.408391325195 & -7.20839132519452 \tabularnewline
46 & 148.3 & 155.503446243594 & -7.2034462435937 \tabularnewline
47 & 137.7 & 140.859902187591 & -3.15990218759073 \tabularnewline
48 & 145 & 142.393987755362 & 2.60601224463754 \tabularnewline
49 & 153.4 & 137.233881754676 & 16.1661182453243 \tabularnewline
50 & 141.7 & 133.050012024389 & 8.64998797561084 \tabularnewline
51 & 142.7 & 131.934313429646 & 10.7656865703539 \tabularnewline
52 & 135.9 & 131.655388780960 & 4.24461121903972 \tabularnewline
53 & 131.8 & 126.913669753302 & 4.88633024669783 \tabularnewline
54 & 134.6 & 126.216358131588 & 8.38364186841225 \tabularnewline
55 & 127.5 & 132.492162727018 & -4.9921627270176 \tabularnewline
56 & 126.5 & 135.141946889532 & -8.64194688953242 \tabularnewline
57 & 118.7 & 131.934313429646 & -13.2343134296460 \tabularnewline
58 & 117.1 & 123.845498617759 & -6.74549861775869 \tabularnewline
59 & 110.7 & 113.106899643356 & -2.4068996433565 \tabularnewline
60 & 107.1 & 109.341416886099 & -2.24141688609862 \tabularnewline
61 & 105.4 & 106.133783426212 & -0.733783426212228 \tabularnewline
\hline
\end{tabular}
%Source: https://freestatistics.org/blog/index.php?pk=25770&T=4

[TABLE]
[ROW][C]Multiple Linear Regression - Actuals, Interpolation, and Residuals[/C][/ROW]
[ROW][C]Time or Index[/C][C]Actuals[/C][C]InterpolationForecast[/C][C]ResidualsPrediction Error[/C][/ROW]
[ROW][C]1[/C][C]239.4[/C][C]221.748050306465[/C][C]17.651949693535[/C][/ROW]
[ROW][C]2[/C][C]321.9[/C][C]276.417281448876[/C][C]45.4827185511244[/C][/ROW]
[ROW][C]3[/C][C]362.7[/C][C]303.751897020081[/C][C]58.948102979919[/C][/ROW]
[ROW][C]4[/C][C]413.6[/C][C]328.297266104429[/C][C]85.3027338955712[/C][/ROW]
[ROW][C]5[/C][C]407.1[/C][C]326.205331239285[/C][C]80.8946687607145[/C][/ROW]
[ROW][C]6[/C][C]383.2[/C][C]328.436728428772[/C][C]54.7632715712283[/C][/ROW]
[ROW][C]7[/C][C]347.7[/C][C]328.018341455743[/C][C]19.6816585442570[/C][/ROW]
[ROW][C]8[/C][C]333.8[/C][C]323.973934049799[/C][C]9.82606595020062[/C][/ROW]
[ROW][C]9[/C][C]312.3[/C][C]307.935766750368[/C][C]4.36423324963245[/C][/ROW]
[ROW][C]10[/C][C]295.4[/C][C]293.431685018707[/C][C]1.96831498129252[/C][/ROW]
[ROW][C]11[/C][C]283.3[/C][C]251.871912364528[/C][C]31.4280876354724[/C][/ROW]
[ROW][C]12[/C][C]287.6[/C][C]262.192124365901[/C][C]25.4078756340989[/C][/ROW]
[ROW][C]13[/C][C]265.7[/C][C]270.978250799503[/C][C]-5.27825079950291[/C][/ROW]
[ROW][C]14[/C][C]250.2[/C][C]263.028898311958[/C][C]-12.8288983119584[/C][/ROW]
[ROW][C]15[/C][C]234.7[/C][C]263.726209933673[/C][C]-29.0262099336728[/C][/ROW]
[ROW][C]16[/C][C]244[/C][C]277.811904692304[/C][C]-33.8119046923043[/C][/ROW]
[ROW][C]17[/C][C]231.2[/C][C]274.185884259389[/C][C]-42.9858842593893[/C][/ROW]
[ROW][C]18[/C][C]223.8[/C][C]287.155880423278[/C][C]-63.3558804232776[/C][/ROW]
[ROW][C]19[/C][C]223.5[/C][C]286.179644152877[/C][C]-62.6796441528774[/C][/ROW]
[ROW][C]20[/C][C]210.5[/C][C]266.236531771845[/C][C]-55.7365317718448[/C][/ROW]
[ROW][C]21[/C][C]201.6[/C][C]253.824384905328[/C][C]-52.224384905328[/C][/ROW]
[ROW][C]22[/C][C]190.7[/C][C]248.385354255955[/C][C]-57.6853542559554[/C][/ROW]
[ROW][C]23[/C][C]207.5[/C][C]247.688042634241[/C][C]-40.188042634241[/C][/ROW]
[ROW][C]24[/C][C]198.8[/C][C]242.109549660526[/C][C]-43.3095496605256[/C][/ROW]
[ROW][C]25[/C][C]196.6[/C][C]242.667398957897[/C][C]-46.0673989578971[/C][/ROW]
[ROW][C]26[/C][C]204.2[/C][C]235.275895767724[/C][C]-31.0758957677242[/C][/ROW]
[ROW][C]27[/C][C]227.4[/C][C]239.180840849325[/C][C]-11.780840849325[/C][/ROW]
[ROW][C]28[/C][C]229.7[/C][C]239.180840849325[/C][C]-9.480840849325[/C][/ROW]
[ROW][C]29[/C][C]217.9[/C][C]226.071382361094[/C][C]-8.17138236109375[/C][/ROW]
[ROW][C]30[/C][C]221.4[/C][C]240.575464092754[/C][C]-19.1754640927538[/C][/ROW]
[ROW][C]31[/C][C]216.3[/C][C]215.472245711034[/C][C]0.827754288965548[/C][/ROW]
[ROW][C]32[/C][C]197[/C][C]195.947520303031[/C][C]1.05247969696950[/C][/ROW]
[ROW][C]33[/C][C]193.8[/C][C]194.273972410916[/C][C]-0.473972410915874[/C][/ROW]
[ROW][C]34[/C][C]196.8[/C][C]187.579780842457[/C][C]9.22021915754265[/C][/ROW]
[ROW][C]35[/C][C]180.5[/C][C]173.633548408169[/C][C]6.86645159183118[/C][/ROW]
[ROW][C]36[/C][C]174.8[/C][C]164.707959650224[/C][C]10.0920403497759[/C][/ROW]
[ROW][C]37[/C][C]181.6[/C][C]161.081939217309[/C][C]20.5180607826909[/C][/ROW]
[ROW][C]38[/C][C]190[/C][C]160.245165271252[/C][C]29.7548347287482[/C][/ROW]
[ROW][C]39[/C][C]190.6[/C][C]157.037531811365[/C][C]33.5624681886346[/C][/ROW]
[ROW][C]40[/C][C]179[/C][C]148.948716999478[/C][C]30.0512830005219[/C][/ROW]
[ROW][C]41[/C][C]174.1[/C][C]147.693556080392[/C][C]26.4064439196079[/C][/ROW]
[ROW][C]42[/C][C]161.1[/C][C]151.180114188964[/C][C]9.91988581103574[/C][/ROW]
[ROW][C]43[/C][C]168.6[/C][C]161.360863865995[/C][C]7.23913613400512[/C][/ROW]
[ROW][C]44[/C][C]169.4[/C][C]164.429035001538[/C][C]4.97096499846163[/C][/ROW]
[ROW][C]45[/C][C]152.2[/C][C]159.408391325195[/C][C]-7.20839132519452[/C][/ROW]
[ROW][C]46[/C][C]148.3[/C][C]155.503446243594[/C][C]-7.2034462435937[/C][/ROW]
[ROW][C]47[/C][C]137.7[/C][C]140.859902187591[/C][C]-3.15990218759073[/C][/ROW]
[ROW][C]48[/C][C]145[/C][C]142.393987755362[/C][C]2.60601224463754[/C][/ROW]
[ROW][C]49[/C][C]153.4[/C][C]137.233881754676[/C][C]16.1661182453243[/C][/ROW]
[ROW][C]50[/C][C]141.7[/C][C]133.050012024389[/C][C]8.64998797561084[/C][/ROW]
[ROW][C]51[/C][C]142.7[/C][C]131.934313429646[/C][C]10.7656865703539[/C][/ROW]
[ROW][C]52[/C][C]135.9[/C][C]131.655388780960[/C][C]4.24461121903972[/C][/ROW]
[ROW][C]53[/C][C]131.8[/C][C]126.913669753302[/C][C]4.88633024669783[/C][/ROW]
[ROW][C]54[/C][C]134.6[/C][C]126.216358131588[/C][C]8.38364186841225[/C][/ROW]
[ROW][C]55[/C][C]127.5[/C][C]132.492162727018[/C][C]-4.9921627270176[/C][/ROW]
[ROW][C]56[/C][C]126.5[/C][C]135.141946889532[/C][C]-8.64194688953242[/C][/ROW]
[ROW][C]57[/C][C]118.7[/C][C]131.934313429646[/C][C]-13.2343134296460[/C][/ROW]
[ROW][C]58[/C][C]117.1[/C][C]123.845498617759[/C][C]-6.74549861775869[/C][/ROW]
[ROW][C]59[/C][C]110.7[/C][C]113.106899643356[/C][C]-2.4068996433565[/C][/ROW]
[ROW][C]60[/C][C]107.1[/C][C]109.341416886099[/C][C]-2.24141688609862[/C][/ROW]
[ROW][C]61[/C][C]105.4[/C][C]106.133783426212[/C][C]-0.733783426212228[/C][/ROW]
[/TABLE]
Source: https://freestatistics.org/blog/index.php?pk=25770&T=4

Globally Unique Identifier (entire table): ba.freestatistics.org/blog/index.php?pk=25770&T=4

As an alternative you can also use a QR Code:  

The GUIDs for individual cells are displayed in the table below:

Multiple Linear Regression - Actuals, Interpolation, and Residuals
Time or IndexActualsInterpolationForecastResidualsPrediction Error
1239.4221.74805030646517.651949693535
2321.9276.41728144887645.4827185511244
3362.7303.75189702008158.948102979919
4413.6328.29726610442985.3027338955712
5407.1326.20533123928580.8946687607145
6383.2328.43672842877254.7632715712283
7347.7328.01834145574319.6816585442570
8333.8323.9739340497999.82606595020062
9312.3307.9357667503684.36423324963245
10295.4293.4316850187071.96831498129252
11283.3251.87191236452831.4280876354724
12287.6262.19212436590125.4078756340989
13265.7270.978250799503-5.27825079950291
14250.2263.028898311958-12.8288983119584
15234.7263.726209933673-29.0262099336728
16244277.811904692304-33.8119046923043
17231.2274.185884259389-42.9858842593893
18223.8287.155880423278-63.3558804232776
19223.5286.179644152877-62.6796441528774
20210.5266.236531771845-55.7365317718448
21201.6253.824384905328-52.224384905328
22190.7248.385354255955-57.6853542559554
23207.5247.688042634241-40.188042634241
24198.8242.109549660526-43.3095496605256
25196.6242.667398957897-46.0673989578971
26204.2235.275895767724-31.0758957677242
27227.4239.180840849325-11.780840849325
28229.7239.180840849325-9.480840849325
29217.9226.071382361094-8.17138236109375
30221.4240.575464092754-19.1754640927538
31216.3215.4722457110340.827754288965548
32197195.9475203030311.05247969696950
33193.8194.273972410916-0.473972410915874
34196.8187.5797808424579.22021915754265
35180.5173.6335484081696.86645159183118
36174.8164.70795965022410.0920403497759
37181.6161.08193921730920.5180607826909
38190160.24516527125229.7548347287482
39190.6157.03753181136533.5624681886346
40179148.94871699947830.0512830005219
41174.1147.69355608039226.4064439196079
42161.1151.1801141889649.91988581103574
43168.6161.3608638659957.23913613400512
44169.4164.4290350015384.97096499846163
45152.2159.408391325195-7.20839132519452
46148.3155.503446243594-7.2034462435937
47137.7140.859902187591-3.15990218759073
48145142.3939877553622.60601224463754
49153.4137.23388175467616.1661182453243
50141.7133.0500120243898.64998797561084
51142.7131.93431342964610.7656865703539
52135.9131.6553887809604.24461121903972
53131.8126.9136697533024.88633024669783
54134.6126.2163581315888.38364186841225
55127.5132.492162727018-4.9921627270176
56126.5135.141946889532-8.64194688953242
57118.7131.934313429646-13.2343134296460
58117.1123.845498617759-6.74549861775869
59110.7113.106899643356-2.4068996433565
60107.1109.341416886099-2.24141688609862
61105.4106.133783426212-0.733783426212228


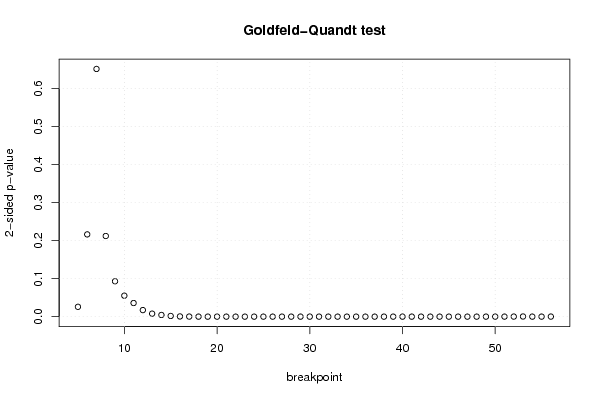
Goldfeld-Quandt test for Heteroskedasticity
p-valuesAlternative Hypothesis
breakpoint indexgreater2-sidedless
50.01291987678136360.02583975356272710.987080123218636
60.1081996187989810.2163992375979630.891800381201019
70.674249433590470.6515011328190590.325750566409529
80.8939534605874680.2120930788250640.106046539412532
90.9534647748424860.09307045031502870.0465352251575143
100.9724329371052380.05513412578952290.0275670628947615
110.9820908729458510.03581825410829770.0179091270541488
120.9913399360106380.01732012797872360.00866006398936182
130.9960412104040690.007917579191862630.00395878959593131
140.9977619880094120.004476023981175050.00223801199058752
150.9990734938958450.001853012208309970.000926506104154985
160.9997177990076140.000564401984771310.000282200992385655
170.9999067989990270.0001864020019453479.32010009726733e-05
180.9999941622532211.16754935576711e-055.83774677883556e-06
190.9999991875661061.62486778891266e-068.12433894456331e-07
200.9999995893522728.21295455417018e-074.10647727708509e-07
210.9999996980020586.03995884540951e-073.01997942270475e-07
220.9999999093999291.81200142808071e-079.06000714040357e-08
230.999999883248822.33502360483392e-071.16751180241696e-07
240.999999922760411.54479181919758e-077.7239590959879e-08
250.9999999835689733.28620543906194e-081.64310271953097e-08
260.99999999047321.90535996007255e-089.52679980036274e-09
270.9999999806400963.87198085563219e-081.93599042781610e-08
280.9999999602472847.95054320352092e-083.97527160176046e-08
290.9999999347876371.30424725685775e-076.52123628428877e-08
300.9999999704601855.90796309143401e-082.95398154571701e-08
310.9999999651211626.97576761169482e-083.48788380584741e-08
320.9999999634939497.30121025950621e-083.65060512975311e-08
330.9999999679274966.41450076204281e-083.20725038102141e-08
340.9999999519169749.6166050981359e-084.80830254906795e-08
350.9999999198401581.60319683303637e-078.01598416518187e-08
360.9999998271586893.45682623043297e-071.72841311521649e-07
370.9999996751534826.49693035417102e-073.24846517708551e-07
380.9999997290338155.41932369698445e-072.70966184849223e-07
390.9999999223311661.55337668964367e-077.76688344821837e-08
400.9999999855770122.88459768668763e-081.44229884334382e-08
410.9999999981559523.68809647131264e-091.84404823565632e-09
420.9999999946775971.06448061286088e-085.32240306430439e-09
430.9999999811608173.7678366375751e-081.88391831878755e-08
440.999999930570611.38858780989518e-076.94293904947592e-08
450.9999997557043734.8859125421659e-072.44295627108295e-07
460.999999386713941.22657212158557e-066.13286060792784e-07
470.9999978369517734.32609645433198e-062.16304822716599e-06
480.99999055884431.88823114019959e-059.44115570099796e-06
490.999989508293972.09834120581331e-051.04917060290665e-05
500.9999735540202815.28919594371539e-052.64459797185769e-05
510.999968716262556.25674749007064e-053.12837374503532e-05
520.9999121715489180.0001756569021642328.7828451082116e-05
530.9998060630537820.0003878738924366990.000193936946218349
540.999988538347722.29233045593849e-051.14616522796924e-05
550.9999665922611876.68154776252294e-053.34077388126147e-05
560.9999020633350990.0001958733298029979.79366649014987e-05

\begin{tabular}{lllllllll}
\hline
Goldfeld-Quandt test for Heteroskedasticity \tabularnewline
p-values & Alternative Hypothesis \tabularnewline
breakpoint index & greater & 2-sided & less \tabularnewline
5 & 0.0129198767813636 & 0.0258397535627271 & 0.987080123218636 \tabularnewline
6 & 0.108199618798981 & 0.216399237597963 & 0.891800381201019 \tabularnewline
7 & 0.67424943359047 & 0.651501132819059 & 0.325750566409529 \tabularnewline
8 & 0.893953460587468 & 0.212093078825064 & 0.106046539412532 \tabularnewline
9 & 0.953464774842486 & 0.0930704503150287 & 0.0465352251575143 \tabularnewline
10 & 0.972432937105238 & 0.0551341257895229 & 0.0275670628947615 \tabularnewline
11 & 0.982090872945851 & 0.0358182541082977 & 0.0179091270541488 \tabularnewline
12 & 0.991339936010638 & 0.0173201279787236 & 0.00866006398936182 \tabularnewline
13 & 0.996041210404069 & 0.00791757919186263 & 0.00395878959593131 \tabularnewline
14 & 0.997761988009412 & 0.00447602398117505 & 0.00223801199058752 \tabularnewline
15 & 0.999073493895845 & 0.00185301220830997 & 0.000926506104154985 \tabularnewline
16 & 0.999717799007614 & 0.00056440198477131 & 0.000282200992385655 \tabularnewline
17 & 0.999906798999027 & 0.000186402001945347 & 9.32010009726733e-05 \tabularnewline
18 & 0.999994162253221 & 1.16754935576711e-05 & 5.83774677883556e-06 \tabularnewline
19 & 0.999999187566106 & 1.62486778891266e-06 & 8.12433894456331e-07 \tabularnewline
20 & 0.999999589352272 & 8.21295455417018e-07 & 4.10647727708509e-07 \tabularnewline
21 & 0.999999698002058 & 6.03995884540951e-07 & 3.01997942270475e-07 \tabularnewline
22 & 0.999999909399929 & 1.81200142808071e-07 & 9.06000714040357e-08 \tabularnewline
23 & 0.99999988324882 & 2.33502360483392e-07 & 1.16751180241696e-07 \tabularnewline
24 & 0.99999992276041 & 1.54479181919758e-07 & 7.7239590959879e-08 \tabularnewline
25 & 0.999999983568973 & 3.28620543906194e-08 & 1.64310271953097e-08 \tabularnewline
26 & 0.9999999904732 & 1.90535996007255e-08 & 9.52679980036274e-09 \tabularnewline
27 & 0.999999980640096 & 3.87198085563219e-08 & 1.93599042781610e-08 \tabularnewline
28 & 0.999999960247284 & 7.95054320352092e-08 & 3.97527160176046e-08 \tabularnewline
29 & 0.999999934787637 & 1.30424725685775e-07 & 6.52123628428877e-08 \tabularnewline
30 & 0.999999970460185 & 5.90796309143401e-08 & 2.95398154571701e-08 \tabularnewline
31 & 0.999999965121162 & 6.97576761169482e-08 & 3.48788380584741e-08 \tabularnewline
32 & 0.999999963493949 & 7.30121025950621e-08 & 3.65060512975311e-08 \tabularnewline
33 & 0.999999967927496 & 6.41450076204281e-08 & 3.20725038102141e-08 \tabularnewline
34 & 0.999999951916974 & 9.6166050981359e-08 & 4.80830254906795e-08 \tabularnewline
35 & 0.999999919840158 & 1.60319683303637e-07 & 8.01598416518187e-08 \tabularnewline
36 & 0.999999827158689 & 3.45682623043297e-07 & 1.72841311521649e-07 \tabularnewline
37 & 0.999999675153482 & 6.49693035417102e-07 & 3.24846517708551e-07 \tabularnewline
38 & 0.999999729033815 & 5.41932369698445e-07 & 2.70966184849223e-07 \tabularnewline
39 & 0.999999922331166 & 1.55337668964367e-07 & 7.76688344821837e-08 \tabularnewline
40 & 0.999999985577012 & 2.88459768668763e-08 & 1.44229884334382e-08 \tabularnewline
41 & 0.999999998155952 & 3.68809647131264e-09 & 1.84404823565632e-09 \tabularnewline
42 & 0.999999994677597 & 1.06448061286088e-08 & 5.32240306430439e-09 \tabularnewline
43 & 0.999999981160817 & 3.7678366375751e-08 & 1.88391831878755e-08 \tabularnewline
44 & 0.99999993057061 & 1.38858780989518e-07 & 6.94293904947592e-08 \tabularnewline
45 & 0.999999755704373 & 4.8859125421659e-07 & 2.44295627108295e-07 \tabularnewline
46 & 0.99999938671394 & 1.22657212158557e-06 & 6.13286060792784e-07 \tabularnewline
47 & 0.999997836951773 & 4.32609645433198e-06 & 2.16304822716599e-06 \tabularnewline
48 & 0.9999905588443 & 1.88823114019959e-05 & 9.44115570099796e-06 \tabularnewline
49 & 0.99998950829397 & 2.09834120581331e-05 & 1.04917060290665e-05 \tabularnewline
50 & 0.999973554020281 & 5.28919594371539e-05 & 2.64459797185769e-05 \tabularnewline
51 & 0.99996871626255 & 6.25674749007064e-05 & 3.12837374503532e-05 \tabularnewline
52 & 0.999912171548918 & 0.000175656902164232 & 8.7828451082116e-05 \tabularnewline
53 & 0.999806063053782 & 0.000387873892436699 & 0.000193936946218349 \tabularnewline
54 & 0.99998853834772 & 2.29233045593849e-05 & 1.14616522796924e-05 \tabularnewline
55 & 0.999966592261187 & 6.68154776252294e-05 & 3.34077388126147e-05 \tabularnewline
56 & 0.999902063335099 & 0.000195873329802997 & 9.79366649014987e-05 \tabularnewline
\hline
\end{tabular}
%Source: https://freestatistics.org/blog/index.php?pk=25770&T=5

[TABLE]
[ROW][C]Goldfeld-Quandt test for Heteroskedasticity[/C][/ROW]
[ROW][C]p-values[/C][C]Alternative Hypothesis[/C][/ROW]
[ROW][C]breakpoint index[/C][C]greater[/C][C]2-sided[/C][C]less[/C][/ROW]
[ROW][C]5[/C][C]0.0129198767813636[/C][C]0.0258397535627271[/C][C]0.987080123218636[/C][/ROW]
[ROW][C]6[/C][C]0.108199618798981[/C][C]0.216399237597963[/C][C]0.891800381201019[/C][/ROW]
[ROW][C]7[/C][C]0.67424943359047[/C][C]0.651501132819059[/C][C]0.325750566409529[/C][/ROW]
[ROW][C]8[/C][C]0.893953460587468[/C][C]0.212093078825064[/C][C]0.106046539412532[/C][/ROW]
[ROW][C]9[/C][C]0.953464774842486[/C][C]0.0930704503150287[/C][C]0.0465352251575143[/C][/ROW]
[ROW][C]10[/C][C]0.972432937105238[/C][C]0.0551341257895229[/C][C]0.0275670628947615[/C][/ROW]
[ROW][C]11[/C][C]0.982090872945851[/C][C]0.0358182541082977[/C][C]0.0179091270541488[/C][/ROW]
[ROW][C]12[/C][C]0.991339936010638[/C][C]0.0173201279787236[/C][C]0.00866006398936182[/C][/ROW]
[ROW][C]13[/C][C]0.996041210404069[/C][C]0.00791757919186263[/C][C]0.00395878959593131[/C][/ROW]
[ROW][C]14[/C][C]0.997761988009412[/C][C]0.00447602398117505[/C][C]0.00223801199058752[/C][/ROW]
[ROW][C]15[/C][C]0.999073493895845[/C][C]0.00185301220830997[/C][C]0.000926506104154985[/C][/ROW]
[ROW][C]16[/C][C]0.999717799007614[/C][C]0.00056440198477131[/C][C]0.000282200992385655[/C][/ROW]
[ROW][C]17[/C][C]0.999906798999027[/C][C]0.000186402001945347[/C][C]9.32010009726733e-05[/C][/ROW]
[ROW][C]18[/C][C]0.999994162253221[/C][C]1.16754935576711e-05[/C][C]5.83774677883556e-06[/C][/ROW]
[ROW][C]19[/C][C]0.999999187566106[/C][C]1.62486778891266e-06[/C][C]8.12433894456331e-07[/C][/ROW]
[ROW][C]20[/C][C]0.999999589352272[/C][C]8.21295455417018e-07[/C][C]4.10647727708509e-07[/C][/ROW]
[ROW][C]21[/C][C]0.999999698002058[/C][C]6.03995884540951e-07[/C][C]3.01997942270475e-07[/C][/ROW]
[ROW][C]22[/C][C]0.999999909399929[/C][C]1.81200142808071e-07[/C][C]9.06000714040357e-08[/C][/ROW]
[ROW][C]23[/C][C]0.99999988324882[/C][C]2.33502360483392e-07[/C][C]1.16751180241696e-07[/C][/ROW]
[ROW][C]24[/C][C]0.99999992276041[/C][C]1.54479181919758e-07[/C][C]7.7239590959879e-08[/C][/ROW]
[ROW][C]25[/C][C]0.999999983568973[/C][C]3.28620543906194e-08[/C][C]1.64310271953097e-08[/C][/ROW]
[ROW][C]26[/C][C]0.9999999904732[/C][C]1.90535996007255e-08[/C][C]9.52679980036274e-09[/C][/ROW]
[ROW][C]27[/C][C]0.999999980640096[/C][C]3.87198085563219e-08[/C][C]1.93599042781610e-08[/C][/ROW]
[ROW][C]28[/C][C]0.999999960247284[/C][C]7.95054320352092e-08[/C][C]3.97527160176046e-08[/C][/ROW]
[ROW][C]29[/C][C]0.999999934787637[/C][C]1.30424725685775e-07[/C][C]6.52123628428877e-08[/C][/ROW]
[ROW][C]30[/C][C]0.999999970460185[/C][C]5.90796309143401e-08[/C][C]2.95398154571701e-08[/C][/ROW]
[ROW][C]31[/C][C]0.999999965121162[/C][C]6.97576761169482e-08[/C][C]3.48788380584741e-08[/C][/ROW]
[ROW][C]32[/C][C]0.999999963493949[/C][C]7.30121025950621e-08[/C][C]3.65060512975311e-08[/C][/ROW]
[ROW][C]33[/C][C]0.999999967927496[/C][C]6.41450076204281e-08[/C][C]3.20725038102141e-08[/C][/ROW]
[ROW][C]34[/C][C]0.999999951916974[/C][C]9.6166050981359e-08[/C][C]4.80830254906795e-08[/C][/ROW]
[ROW][C]35[/C][C]0.999999919840158[/C][C]1.60319683303637e-07[/C][C]8.01598416518187e-08[/C][/ROW]
[ROW][C]36[/C][C]0.999999827158689[/C][C]3.45682623043297e-07[/C][C]1.72841311521649e-07[/C][/ROW]
[ROW][C]37[/C][C]0.999999675153482[/C][C]6.49693035417102e-07[/C][C]3.24846517708551e-07[/C][/ROW]
[ROW][C]38[/C][C]0.999999729033815[/C][C]5.41932369698445e-07[/C][C]2.70966184849223e-07[/C][/ROW]
[ROW][C]39[/C][C]0.999999922331166[/C][C]1.55337668964367e-07[/C][C]7.76688344821837e-08[/C][/ROW]
[ROW][C]40[/C][C]0.999999985577012[/C][C]2.88459768668763e-08[/C][C]1.44229884334382e-08[/C][/ROW]
[ROW][C]41[/C][C]0.999999998155952[/C][C]3.68809647131264e-09[/C][C]1.84404823565632e-09[/C][/ROW]
[ROW][C]42[/C][C]0.999999994677597[/C][C]1.06448061286088e-08[/C][C]5.32240306430439e-09[/C][/ROW]
[ROW][C]43[/C][C]0.999999981160817[/C][C]3.7678366375751e-08[/C][C]1.88391831878755e-08[/C][/ROW]
[ROW][C]44[/C][C]0.99999993057061[/C][C]1.38858780989518e-07[/C][C]6.94293904947592e-08[/C][/ROW]
[ROW][C]45[/C][C]0.999999755704373[/C][C]4.8859125421659e-07[/C][C]2.44295627108295e-07[/C][/ROW]
[ROW][C]46[/C][C]0.99999938671394[/C][C]1.22657212158557e-06[/C][C]6.13286060792784e-07[/C][/ROW]
[ROW][C]47[/C][C]0.999997836951773[/C][C]4.32609645433198e-06[/C][C]2.16304822716599e-06[/C][/ROW]
[ROW][C]48[/C][C]0.9999905588443[/C][C]1.88823114019959e-05[/C][C]9.44115570099796e-06[/C][/ROW]
[ROW][C]49[/C][C]0.99998950829397[/C][C]2.09834120581331e-05[/C][C]1.04917060290665e-05[/C][/ROW]
[ROW][C]50[/C][C]0.999973554020281[/C][C]5.28919594371539e-05[/C][C]2.64459797185769e-05[/C][/ROW]
[ROW][C]51[/C][C]0.99996871626255[/C][C]6.25674749007064e-05[/C][C]3.12837374503532e-05[/C][/ROW]
[ROW][C]52[/C][C]0.999912171548918[/C][C]0.000175656902164232[/C][C]8.7828451082116e-05[/C][/ROW]
[ROW][C]53[/C][C]0.999806063053782[/C][C]0.000387873892436699[/C][C]0.000193936946218349[/C][/ROW]
[ROW][C]54[/C][C]0.99998853834772[/C][C]2.29233045593849e-05[/C][C]1.14616522796924e-05[/C][/ROW]
[ROW][C]55[/C][C]0.999966592261187[/C][C]6.68154776252294e-05[/C][C]3.34077388126147e-05[/C][/ROW]
[ROW][C]56[/C][C]0.999902063335099[/C][C]0.000195873329802997[/C][C]9.79366649014987e-05[/C][/ROW]
[/TABLE]
Source: https://freestatistics.org/blog/index.php?pk=25770&T=5

Globally Unique Identifier (entire table): ba.freestatistics.org/blog/index.php?pk=25770&T=5

As an alternative you can also use a QR Code:  

The GUIDs for individual cells are displayed in the table below:

Goldfeld-Quandt test for Heteroskedasticity
p-valuesAlternative Hypothesis
breakpoint indexgreater2-sidedless
50.01291987678136360.02583975356272710.987080123218636
60.1081996187989810.2163992375979630.891800381201019
70.674249433590470.6515011328190590.325750566409529
80.8939534605874680.2120930788250640.106046539412532
90.9534647748424860.09307045031502870.0465352251575143
100.9724329371052380.05513412578952290.0275670628947615
110.9820908729458510.03581825410829770.0179091270541488
120.9913399360106380.01732012797872360.00866006398936182
130.9960412104040690.007917579191862630.00395878959593131
140.9977619880094120.004476023981175050.00223801199058752
150.9990734938958450.001853012208309970.000926506104154985
160.9997177990076140.000564401984771310.000282200992385655
170.9999067989990270.0001864020019453479.32010009726733e-05
180.9999941622532211.16754935576711e-055.83774677883556e-06
190.9999991875661061.62486778891266e-068.12433894456331e-07
200.9999995893522728.21295455417018e-074.10647727708509e-07
210.9999996980020586.03995884540951e-073.01997942270475e-07
220.9999999093999291.81200142808071e-079.06000714040357e-08
230.999999883248822.33502360483392e-071.16751180241696e-07
240.999999922760411.54479181919758e-077.7239590959879e-08
250.9999999835689733.28620543906194e-081.64310271953097e-08
260.99999999047321.90535996007255e-089.52679980036274e-09
270.9999999806400963.87198085563219e-081.93599042781610e-08
280.9999999602472847.95054320352092e-083.97527160176046e-08
290.9999999347876371.30424725685775e-076.52123628428877e-08
300.9999999704601855.90796309143401e-082.95398154571701e-08
310.9999999651211626.97576761169482e-083.48788380584741e-08
320.9999999634939497.30121025950621e-083.65060512975311e-08
330.9999999679274966.41450076204281e-083.20725038102141e-08
340.9999999519169749.6166050981359e-084.80830254906795e-08
350.9999999198401581.60319683303637e-078.01598416518187e-08
360.9999998271586893.45682623043297e-071.72841311521649e-07
370.9999996751534826.49693035417102e-073.24846517708551e-07
380.9999997290338155.41932369698445e-072.70966184849223e-07
390.9999999223311661.55337668964367e-077.76688344821837e-08
400.9999999855770122.88459768668763e-081.44229884334382e-08
410.9999999981559523.68809647131264e-091.84404823565632e-09
420.9999999946775971.06448061286088e-085.32240306430439e-09
430.9999999811608173.7678366375751e-081.88391831878755e-08
440.999999930570611.38858780989518e-076.94293904947592e-08
450.9999997557043734.8859125421659e-072.44295627108295e-07
460.999999386713941.22657212158557e-066.13286060792784e-07
470.9999978369517734.32609645433198e-062.16304822716599e-06
480.99999055884431.88823114019959e-059.44115570099796e-06
490.999989508293972.09834120581331e-051.04917060290665e-05
500.9999735540202815.28919594371539e-052.64459797185769e-05
510.999968716262556.25674749007064e-053.12837374503532e-05
520.9999121715489180.0001756569021642328.7828451082116e-05
530.9998060630537820.0003878738924366990.000193936946218349
540.999988538347722.29233045593849e-051.14616522796924e-05
550.9999665922611876.68154776252294e-053.34077388126147e-05
560.9999020633350990.0001958733298029979.79366649014987e-05


Meta Analysis of Goldfeld-Quandt test for Heteroskedasticity
Description# significant tests% significant testsOK/NOK
1% type I error level440.846153846153846NOK
5% type I error level470.903846153846154NOK
10% type I error level490.942307692307692NOK

\begin{tabular}{lllllllll}
\hline
Meta Analysis of Goldfeld-Quandt test for Heteroskedasticity \tabularnewline
Description & # significant tests & % significant tests & OK/NOK \tabularnewline
1% type I error level & 44 & 0.846153846153846 & NOK \tabularnewline
5% type I error level & 47 & 0.903846153846154 & NOK \tabularnewline
10% type I error level & 49 & 0.942307692307692 & NOK \tabularnewline
\hline
\end{tabular}
%Source: https://freestatistics.org/blog/index.php?pk=25770&T=6

[TABLE]
[ROW][C]Meta Analysis of Goldfeld-Quandt test for Heteroskedasticity[/C][/ROW]
[ROW][C]Description[/C][C]# significant tests[/C][C]% significant tests[/C][C]OK/NOK[/C][/ROW]
[ROW][C]1% type I error level[/C][C]44[/C][C]0.846153846153846[/C][C]NOK[/C][/ROW]
[ROW][C]5% type I error level[/C][C]47[/C][C]0.903846153846154[/C][C]NOK[/C][/ROW]
[ROW][C]10% type I error level[/C][C]49[/C][C]0.942307692307692[/C][C]NOK[/C][/ROW]
[/TABLE]
Source: https://freestatistics.org/blog/index.php?pk=25770&T=6

Globally Unique Identifier (entire table): ba.freestatistics.org/blog/index.php?pk=25770&T=6

As an alternative you can also use a QR Code:  

The GUIDs for individual cells are displayed in the table below:

Meta Analysis of Goldfeld-Quandt test for Heteroskedasticity
Description# significant tests% significant testsOK/NOK
1% type I error level440.846153846153846NOK
5% type I error level470.903846153846154NOK
10% type I error level490.942307692307692NOK


Parameters (Session):
par1 = 1 ; par2 = Do not include Seasonal Dummies ; par3 = No Linear Trend ;
Parameters (R input):
par1 = 1 ; par2 = Do not include Seasonal Dummies ; par3 = No Linear Trend ;
R code (references can be found in the software module):
library(lattice)
library(lmtest)
n25 <- 25 #minimum number of obs. for Goldfeld-Quandt test
par1 <- as.numeric(par1)
x <- t(y)
k <- length(x[1,])
n <- length(x[,1])
x1 <- cbind(x[,par1], x[,1:k!=par1])
mycolnames <- c(colnames(x)[par1], colnames(x)[1:k!=par1])
colnames(x1) <- mycolnames #colnames(x)[par1]
x <- x1
if (par3 == 'First Differences'){
x2 <- array(0, dim=c(n-1,k), dimnames=list(1:(n-1), paste('(1-B)',colnames(x),sep='')))
for (i in 1:n-1) {
for (j in 1:k) {
x2[i,j] <- x[i+1,j] - x[i,j]
}
}
x <- x2
}
if (par2 == 'Include Monthly Dummies'){
x2 <- array(0, dim=c(n,11), dimnames=list(1:n, paste('M', seq(1:11), sep ='')))
for (i in 1:11){
x2[seq(i,n,12),i] <- 1
}
x <- cbind(x, x2)
}
if (par2 == 'Include Quarterly Dummies'){
x2 <- array(0, dim=c(n,3), dimnames=list(1:n, paste('Q', seq(1:3), sep ='')))
for (i in 1:3){
x2[seq(i,n,4),i] <- 1
}
x <- cbind(x, x2)
}
k <- length(x[1,])
if (par3 == 'Linear Trend'){
x <- cbind(x, c(1:n))
colnames(x)[k+1] <- 't'
}
x
k <- length(x[1,])
df <- as.data.frame(x)
(mylm <- lm(df))
(mysum <- summary(mylm))
if (n > n25) {
kp3 <- k + 3
nmkm3 <- n - k - 3
gqarr <- array(NA, dim=c(nmkm3-kp3+1,3))
numgqtests <- 0
numsignificant1 <- 0
numsignificant5 <- 0
numsignificant10 <- 0
for (mypoint in kp3:nmkm3) {
j <- 0
numgqtests <- numgqtests + 1
for (myalt in c('greater', 'two.sided', 'less')) {
j <- j + 1
gqarr[mypoint-kp3+1,j] <- gqtest(mylm, point=mypoint, alternative=myalt)$p.value
}
if (gqarr[mypoint-kp3+1,2] < 0.01) numsignificant1 <- numsignificant1 + 1
if (gqarr[mypoint-kp3+1,2] < 0.05) numsignificant5 <- numsignificant5 + 1
if (gqarr[mypoint-kp3+1,2] < 0.10) numsignificant10 <- numsignificant10 + 1
}
gqarr
}
bitmap(file='test0.png')
plot(x[,1], type='l', main='Actuals and Interpolation', ylab='value of Actuals and Interpolation (dots)', xlab='time or index')
points(x[,1]-mysum$resid)
grid()
dev.off()
bitmap(file='test1.png')
plot(mysum$resid, type='b', pch=19, main='Residuals', ylab='value of Residuals', xlab='time or index')
grid()
dev.off()
bitmap(file='test2.png')
hist(mysum$resid, main='Residual Histogram', xlab='values of Residuals')
grid()
dev.off()
bitmap(file='test3.png')
densityplot(~mysum$resid,col='black',main='Residual Density Plot', xlab='values of Residuals')
dev.off()
bitmap(file='test4.png')
qqnorm(mysum$resid, main='Residual Normal Q-Q Plot')
qqline(mysum$resid)
grid()
dev.off()
(myerror <- as.ts(mysum$resid))
bitmap(file='test5.png')
dum <- cbind(lag(myerror,k=1),myerror)
dum
dum1 <- dum[2:length(myerror),]
dum1
z <- as.data.frame(dum1)
z
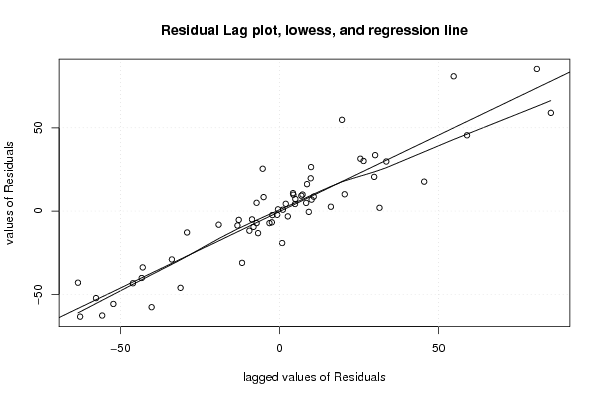
plot(z,main=paste('Residual Lag plot, lowess, and regression line'), ylab='values of Residuals', xlab='lagged values of Residuals')
lines(lowess(z))
abline(lm(z))
grid()
dev.off()
bitmap(file='test6.png')
acf(mysum$resid, lag.max=length(mysum$resid)/2, main='Residual Autocorrelation Function')
grid()
dev.off()
bitmap(file='test7.png')
pacf(mysum$resid, lag.max=length(mysum$resid)/2, main='Residual Partial Autocorrelation Function')
grid()
dev.off()
bitmap(file='test8.png')
opar <- par(mfrow = c(2,2), oma = c(0, 0, 1.1, 0))
plot(mylm, las = 1, sub='Residual Diagnostics')
par(opar)
dev.off()
if (n > n25) {
bitmap(file='test9.png')
plot(kp3:nmkm3,gqarr[,2], main='Goldfeld-Quandt test',ylab='2-sided p-value',xlab='breakpoint')
grid()
dev.off()
}
load(file='createtable')
a<-table.start()
a<-table.row.start(a)
a<-table.element(a, 'Multiple Linear Regression - Estimated Regression Equation', 1, TRUE)
a<-table.row.end(a)
myeq <- colnames(x)[1]
myeq <- paste(myeq, '[t] = ', sep='')
for (i in 1:k){
if (mysum$coefficients[i,1] > 0) myeq <- paste(myeq, '+', '')
myeq <- paste(myeq, mysum$coefficients[i,1], sep=' ')
if (rownames(mysum$coefficients)[i] != '(Intercept)') {
myeq <- paste(myeq, rownames(mysum$coefficients)[i], sep='')
if (rownames(mysum$coefficients)[i] != 't') myeq <- paste(myeq, '[t]', sep='')
}
}
myeq <- paste(myeq, ' + e[t]')
a<-table.row.start(a)
a<-table.element(a, myeq)
a<-table.row.end(a)
a<-table.end(a)
table.save(a,file='mytable1.tab')
a<-table.start()
a<-table.row.start(a)
a<-table.element(a,hyperlink('ols1.htm','Multiple Linear Regression - Ordinary Least Squares',''), 6, TRUE)
a<-table.row.end(a)
a<-table.row.start(a)
a<-table.element(a,'Variable',header=TRUE)
a<-table.element(a,'Parameter',header=TRUE)
a<-table.element(a,'S.D.',header=TRUE)
a<-table.element(a,'T-STAT
H0: parameter = 0',header=TRUE)
a<-table.element(a,'2-tail p-value',header=TRUE)
a<-table.element(a,'1-tail p-value',header=TRUE)
a<-table.row.end(a)
for (i in 1:k){
a<-table.row.start(a)
a<-table.element(a,rownames(mysum$coefficients)[i],header=TRUE)
a<-table.element(a,mysum$coefficients[i,1])
a<-table.element(a, round(mysum$coefficients[i,2],6))
a<-table.element(a, round(mysum$coefficients[i,3],4))
a<-table.element(a, round(mysum$coefficients[i,4],6))
a<-table.element(a, round(mysum$coefficients[i,4]/2,6))
a<-table.row.end(a)
}
a<-table.end(a)
table.save(a,file='mytable2.tab')
a<-table.start()
a<-table.row.start(a)
a<-table.element(a, 'Multiple Linear Regression - Regression Statistics', 2, TRUE)
a<-table.row.end(a)
a<-table.row.start(a)
a<-table.element(a, 'Multiple R',1,TRUE)
a<-table.element(a, sqrt(mysum$r.squared))
a<-table.row.end(a)
a<-table.row.start(a)
a<-table.element(a, 'R-squared',1,TRUE)
a<-table.element(a, mysum$r.squared)
a<-table.row.end(a)
a<-table.row.start(a)
a<-table.element(a, 'Adjusted R-squared',1,TRUE)
a<-table.element(a, mysum$adj.r.squared)
a<-table.row.end(a)
a<-table.row.start(a)
a<-table.element(a, 'F-TEST (value)',1,TRUE)
a<-table.element(a, mysum$fstatistic[1])
a<-table.row.end(a)
a<-table.row.start(a)
a<-table.element(a, 'F-TEST (DF numerator)',1,TRUE)
a<-table.element(a, mysum$fstatistic[2])
a<-table.row.end(a)
a<-table.row.start(a)
a<-table.element(a, 'F-TEST (DF denominator)',1,TRUE)
a<-table.element(a, mysum$fstatistic[3])
a<-table.row.end(a)
a<-table.row.start(a)
a<-table.element(a, 'p-value',1,TRUE)
a<-table.element(a, 1-pf(mysum$fstatistic[1],mysum$fstatistic[2],mysum$fstatistic[3]))
a<-table.row.end(a)
a<-table.row.start(a)
a<-table.element(a, 'Multiple Linear Regression - Residual Statistics', 2, TRUE)
a<-table.row.end(a)
a<-table.row.start(a)
a<-table.element(a, 'Residual Standard Deviation',1,TRUE)
a<-table.element(a, mysum$sigma)
a<-table.row.end(a)
a<-table.row.start(a)
a<-table.element(a, 'Sum Squared Residuals',1,TRUE)
a<-table.element(a, sum(myerror*myerror))
a<-table.row.end(a)
a<-table.end(a)
table.save(a,file='mytable3.tab')
a<-table.start()
a<-table.row.start(a)
a<-table.element(a, 'Multiple Linear Regression - Actuals, Interpolation, and Residuals', 4, TRUE)
a<-table.row.end(a)
a<-table.row.start(a)
a<-table.element(a, 'Time or Index', 1, TRUE)
a<-table.element(a, 'Actuals', 1, TRUE)
a<-table.element(a, 'Interpolation
Forecast', 1, TRUE)
a<-table.element(a, 'Residuals
Prediction Error', 1, TRUE)
a<-table.row.end(a)
for (i in 1:n) {
a<-table.row.start(a)
a<-table.element(a,i, 1, TRUE)
a<-table.element(a,x[i])
a<-table.element(a,x[i]-mysum$resid[i])
a<-table.element(a,mysum$resid[i])
a<-table.row.end(a)
}
a<-table.end(a)
table.save(a,file='mytable4.tab')
if (n > n25) {
a<-table.start()
a<-table.row.start(a)
a<-table.element(a,'Goldfeld-Quandt test for Heteroskedasticity',4,TRUE)
a<-table.row.end(a)
a<-table.row.start(a)
a<-table.element(a,'p-values',header=TRUE)
a<-table.element(a,'Alternative Hypothesis',3,header=TRUE)
a<-table.row.end(a)
a<-table.row.start(a)
a<-table.element(a,'breakpoint index',header=TRUE)
a<-table.element(a,'greater',header=TRUE)
a<-table.element(a,'2-sided',header=TRUE)
a<-table.element(a,'less',header=TRUE)
a<-table.row.end(a)
for (mypoint in kp3:nmkm3) {
a<-table.row.start(a)
a<-table.element(a,mypoint,header=TRUE)
a<-table.element(a,gqarr[mypoint-kp3+1,1])
a<-table.element(a,gqarr[mypoint-kp3+1,2])
a<-table.element(a,gqarr[mypoint-kp3+1,3])
a<-table.row.end(a)
}
a<-table.end(a)
table.save(a,file='mytable5.tab')
a<-table.start()
a<-table.row.start(a)
a<-table.element(a,'Meta Analysis of Goldfeld-Quandt test for Heteroskedasticity',4,TRUE)
a<-table.row.end(a)
a<-table.row.start(a)
a<-table.element(a,'Description',header=TRUE)
a<-table.element(a,'# significant tests',header=TRUE)
a<-table.element(a,'% significant tests',header=TRUE)
a<-table.element(a,'OK/NOK',header=TRUE)
a<-table.row.end(a)
a<-table.row.start(a)
a<-table.element(a,'1% type I error level',header=TRUE)
a<-table.element(a,numsignificant1)
a<-table.element(a,numsignificant1/numgqtests)
if (numsignificant1/numgqtests < 0.01) dum <- 'OK' else dum <- 'NOK'
a<-table.element(a,dum)
a<-table.row.end(a)
a<-table.row.start(a)
a<-table.element(a,'5% type I error level',header=TRUE)
a<-table.element(a,numsignificant5)
a<-table.element(a,numsignificant5/numgqtests)
if (numsignificant5/numgqtests < 0.05) dum <- 'OK' else dum <- 'NOK'
a<-table.element(a,dum)
a<-table.row.end(a)
a<-table.row.start(a)
a<-table.element(a,'10% type I error level',header=TRUE)
a<-table.element(a,numsignificant10)
a<-table.element(a,numsignificant10/numgqtests)
if (numsignificant10/numgqtests < 0.1) dum <- 'OK' else dum <- 'NOK'
a<-table.element(a,dum)
a<-table.row.end(a)
a<-table.end(a)
table.save(a,file='mytable6.tab')
}