Free Statistics

of Irreproducible Research!

Author's title

Author*The author of this computation has been verified*
R Software Modulerwasp_multipleregression.wasp
Title produced by softwareMultiple Regression
Date of computationWed, 26 Nov 2008 11:03:43 -0700
Cite this page as followsStatistical Computations at FreeStatistics.org, Office for Research Development and Education, URL https://freestatistics.org/blog/index.php?v=date/2008/Nov/26/t1227722712amwjuh4466bdntb.htm/, Retrieved Mon, 20 May 2024 09:17:09 +0000
Statistical Computations at FreeStatistics.org, Office for Research Development and Education, URL https://freestatistics.org/blog/index.php?pk=25683, Retrieved Mon, 20 May 2024 09:17:09 +0000
QR Codes:

Original text written by user:
IsPrivate?No (this computation is public)
User-defined keywords
Estimated Impact173
Family? (F = Feedback message, R = changed R code, M = changed R Module, P = changed Parameters, D = changed Data)
-     [Multiple Regression] [Seatbelt law_Q3] [2008-11-26 17:53:01] [9f5bfe3b95f9ec3d2ed4c0a560a9648a]
F    D    [Multiple Regression] [] [2008-11-26 18:03:43] [a9e6d7cd6e144e8b311d9f96a24c5a25] [Current]
Feedback Forum
2008-11-29 15:36:05 [Ken Wright] [reply
De waarden bij M1,M2 geven de seizoenaliteit weer, dus bij jouw tijdreeks kan men besluiten dat er sprake is van seizoenaliteit, want de p-values zijn altijd groter als 0.05 (behalve januarie) en de absolute waarde van de t verdeling groter als 2, Dus seizoenaliteit is niet aan het toeval te wijten.
2008-11-30 14:40:28 [Natalie De Wilde] [reply
Redelijk goed uitgewerkt.
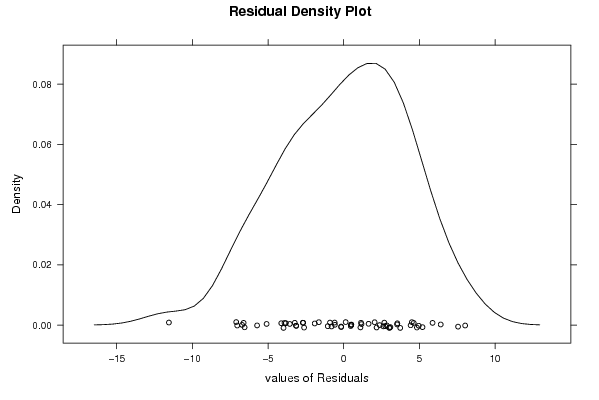
Het residuals histogram heeft geen normaalverdeling, is eerder linksscheef. Zoals je zegt is de actuals en interpolation niet echt goed, er is nog werk aan het model.
2008-12-01 14:52:38 [Ellen Van den Broeck] [reply
Goed uitgewerkt.
2008-12-01 20:50:16 [Peter Van Doninck] [reply
Zeer goede omschrijving van de gebruikte variabelen. Goed ingeleid voorbeeld. Ook heeft de studente duidelijk vermeld waarom een 2 zijdige p-waarde gebruikt wordt. Het histogram heeft, vind ik persoonlijk, niet echt een normaalverdeling. Bij de normal Q Q plot valt het op dat er een afwijking is aan beide uiteinden.De student heeft een grondige analyse van haar voorbeeld gemaakt.

Post a new message
Dataseries X:
82,7	0
88,9	0
105,9	0
100,8	0
94	0
105	0
58,5	0
87,6	0
113,1	0
112,5	0
89,6	0
74,5	0
82,7	0
90,1	0
109,4	0
96	0
89,2	0
109,1	0
49,1	0
92,9	0
107,7	0
103,5	0
91,1	0
79,8	0
71,9	0
82,9	0
90,1	0
100,7	0
90,7	0
108,8	0
44,1	0
93,6	0
107,4	0
96,5	0
93,6	0
76,5	0
76,7	0
84	0
103,3	0
88,5	0
99	1
105,9	1
44,7	1
94	1
107,1	1
104,8	1
102,5	1
77,7	1
85,2	1
91,3	1
106,5	1
92,4	1
97,5	1
107	1
51,1	1
98,6	1
102,2	1
114,3	1
99,4	1
72,5	1


Summary of computational transaction
Raw Inputview raw input (R code)
Raw Outputview raw output of R engine
Computing time9 seconds
R Server'Herman Ole Andreas Wold' @ 193.190.124.10:1001

\begin{tabular}{lllllllll}
\hline
Summary of computational transaction \tabularnewline
Raw Input & view raw input (R code)  \tabularnewline
Raw Output & view raw output of R engine  \tabularnewline
Computing time & 9 seconds \tabularnewline
R Server & 'Herman Ole Andreas Wold' @ 193.190.124.10:1001 \tabularnewline
\hline
\end{tabular}
%Source: https://freestatistics.org/blog/index.php?pk=25683&T=0

[TABLE]
[ROW][C]Summary of computational transaction[/C][/ROW]
[ROW][C]Raw Input[/C][C]view raw input (R code) [/C][/ROW]
[ROW][C]Raw Output[/C][C]view raw output of R engine [/C][/ROW]
[ROW][C]Computing time[/C][C]9 seconds[/C][/ROW]
[ROW][C]R Server[/C][C]'Herman Ole Andreas Wold' @ 193.190.124.10:1001[/C][/ROW]
[/TABLE]
Source: https://freestatistics.org/blog/index.php?pk=25683&T=0

Globally Unique Identifier (entire table): ba.freestatistics.org/blog/index.php?pk=25683&T=0

As an alternative you can also use a QR Code:  

The GUIDs for individual cells are displayed in the table below:

Summary of computational transaction
Raw Inputview raw input (R code)
Raw Outputview raw output of R engine
Computing time9 seconds
R Server'Herman Ole Andreas Wold' @ 193.190.124.10:1001


Multiple Linear Regression - Estimated Regression Equation
Y[t] = + 79.050625 + 6.9640625X[t] + 3.31062499999999M1[t] + 11.0671875M2[t] + 26.82375M3[t] + 19.6203125M4[t] + 16.7840625M5[t] + 30.020625M6[t] -27.4828125M7[t] + 16.51375M8[t] + 30.8303125M9[t] + 29.806875M10[t] + 18.8834375M11[t] -0.1565625t + e[t]

\begin{tabular}{lllllllll}
\hline
Multiple Linear Regression - Estimated Regression Equation \tabularnewline
Y[t] =  +  79.050625 +  6.9640625X[t] +  3.31062499999999M1[t] +  11.0671875M2[t] +  26.82375M3[t] +  19.6203125M4[t] +  16.7840625M5[t] +  30.020625M6[t] -27.4828125M7[t] +  16.51375M8[t] +  30.8303125M9[t] +  29.806875M10[t] +  18.8834375M11[t] -0.1565625t  + e[t] \tabularnewline
\hline
\end{tabular}
%Source: https://freestatistics.org/blog/index.php?pk=25683&T=1

[TABLE]
[ROW][C]Multiple Linear Regression - Estimated Regression Equation[/C][/ROW]
[ROW][C]Y[t] =  +  79.050625 +  6.9640625X[t] +  3.31062499999999M1[t] +  11.0671875M2[t] +  26.82375M3[t] +  19.6203125M4[t] +  16.7840625M5[t] +  30.020625M6[t] -27.4828125M7[t] +  16.51375M8[t] +  30.8303125M9[t] +  29.806875M10[t] +  18.8834375M11[t] -0.1565625t  + e[t][/C][/ROW]
[/TABLE]
Source: https://freestatistics.org/blog/index.php?pk=25683&T=1

Globally Unique Identifier (entire table): ba.freestatistics.org/blog/index.php?pk=25683&T=1

As an alternative you can also use a QR Code:  

The GUIDs for individual cells are displayed in the table below:

Multiple Linear Regression - Estimated Regression Equation
Y[t] = + 79.050625 + 6.9640625X[t] + 3.31062499999999M1[t] + 11.0671875M2[t] + 26.82375M3[t] + 19.6203125M4[t] + 16.7840625M5[t] + 30.020625M6[t] -27.4828125M7[t] + 16.51375M8[t] + 30.8303125M9[t] + 29.806875M10[t] + 18.8834375M11[t] -0.1565625t + e[t]


Multiple Linear Regression - Ordinary Least Squares
VariableParameterS.D.T-STATH0: parameter = 02-tail p-value1-tail p-value
(Intercept)79.0506252.62250730.143200
X6.96406252.2711573.06630.0036230.001811
M13.310624999999992.9945871.10550.2746760.137338
M211.06718752.988843.70280.0005690.000285
M326.823752.9843628.988100
M419.62031252.981166.581400
M516.78406252.9984125.59771e-061e-06
M630.0206252.99011810.039900
M7-27.48281252.983081-9.212900
M816.513752.9773125.54651e-061e-06
M930.83031252.97281710.370700
M1029.8068752.96960210.037300
M1118.88343752.9676726.36300
t-0.15656250.061813-2.53280.0147890.007395

\begin{tabular}{lllllllll}
\hline
Multiple Linear Regression - Ordinary Least Squares \tabularnewline
Variable & Parameter & S.D. & T-STATH0: parameter = 0 & 2-tail p-value & 1-tail p-value \tabularnewline
(Intercept) & 79.050625 & 2.622507 & 30.1432 & 0 & 0 \tabularnewline
X & 6.9640625 & 2.271157 & 3.0663 & 0.003623 & 0.001811 \tabularnewline
M1 & 3.31062499999999 & 2.994587 & 1.1055 & 0.274676 & 0.137338 \tabularnewline
M2 & 11.0671875 & 2.98884 & 3.7028 & 0.000569 & 0.000285 \tabularnewline
M3 & 26.82375 & 2.984362 & 8.9881 & 0 & 0 \tabularnewline
M4 & 19.6203125 & 2.98116 & 6.5814 & 0 & 0 \tabularnewline
M5 & 16.7840625 & 2.998412 & 5.5977 & 1e-06 & 1e-06 \tabularnewline
M6 & 30.020625 & 2.990118 & 10.0399 & 0 & 0 \tabularnewline
M7 & -27.4828125 & 2.983081 & -9.2129 & 0 & 0 \tabularnewline
M8 & 16.51375 & 2.977312 & 5.5465 & 1e-06 & 1e-06 \tabularnewline
M9 & 30.8303125 & 2.972817 & 10.3707 & 0 & 0 \tabularnewline
M10 & 29.806875 & 2.969602 & 10.0373 & 0 & 0 \tabularnewline
M11 & 18.8834375 & 2.967672 & 6.363 & 0 & 0 \tabularnewline
t & -0.1565625 & 0.061813 & -2.5328 & 0.014789 & 0.007395 \tabularnewline
\hline
\end{tabular}
%Source: https://freestatistics.org/blog/index.php?pk=25683&T=2

[TABLE]
[ROW][C]Multiple Linear Regression - Ordinary Least Squares[/C][/ROW]
[ROW][C]Variable[/C][C]Parameter[/C][C]S.D.[/C][C]T-STATH0: parameter = 0[/C][C]2-tail p-value[/C][C]1-tail p-value[/C][/ROW]
[ROW][C](Intercept)[/C][C]79.050625[/C][C]2.622507[/C][C]30.1432[/C][C]0[/C][C]0[/C][/ROW]
[ROW][C]X[/C][C]6.9640625[/C][C]2.271157[/C][C]3.0663[/C][C]0.003623[/C][C]0.001811[/C][/ROW]
[ROW][C]M1[/C][C]3.31062499999999[/C][C]2.994587[/C][C]1.1055[/C][C]0.274676[/C][C]0.137338[/C][/ROW]
[ROW][C]M2[/C][C]11.0671875[/C][C]2.98884[/C][C]3.7028[/C][C]0.000569[/C][C]0.000285[/C][/ROW]
[ROW][C]M3[/C][C]26.82375[/C][C]2.984362[/C][C]8.9881[/C][C]0[/C][C]0[/C][/ROW]
[ROW][C]M4[/C][C]19.6203125[/C][C]2.98116[/C][C]6.5814[/C][C]0[/C][C]0[/C][/ROW]
[ROW][C]M5[/C][C]16.7840625[/C][C]2.998412[/C][C]5.5977[/C][C]1e-06[/C][C]1e-06[/C][/ROW]
[ROW][C]M6[/C][C]30.020625[/C][C]2.990118[/C][C]10.0399[/C][C]0[/C][C]0[/C][/ROW]
[ROW][C]M7[/C][C]-27.4828125[/C][C]2.983081[/C][C]-9.2129[/C][C]0[/C][C]0[/C][/ROW]
[ROW][C]M8[/C][C]16.51375[/C][C]2.977312[/C][C]5.5465[/C][C]1e-06[/C][C]1e-06[/C][/ROW]
[ROW][C]M9[/C][C]30.8303125[/C][C]2.972817[/C][C]10.3707[/C][C]0[/C][C]0[/C][/ROW]
[ROW][C]M10[/C][C]29.806875[/C][C]2.969602[/C][C]10.0373[/C][C]0[/C][C]0[/C][/ROW]
[ROW][C]M11[/C][C]18.8834375[/C][C]2.967672[/C][C]6.363[/C][C]0[/C][C]0[/C][/ROW]
[ROW][C]t[/C][C]-0.1565625[/C][C]0.061813[/C][C]-2.5328[/C][C]0.014789[/C][C]0.007395[/C][/ROW]
[/TABLE]
Source: https://freestatistics.org/blog/index.php?pk=25683&T=2

Globally Unique Identifier (entire table): ba.freestatistics.org/blog/index.php?pk=25683&T=2

As an alternative you can also use a QR Code:  

The GUIDs for individual cells are displayed in the table below:

Multiple Linear Regression - Ordinary Least Squares
VariableParameterS.D.T-STATH0: parameter = 02-tail p-value1-tail p-value
(Intercept)79.0506252.62250730.143200
X6.96406252.2711573.06630.0036230.001811
M13.310624999999992.9945871.10550.2746760.137338
M211.06718752.988843.70280.0005690.000285
M326.823752.9843628.988100
M419.62031252.981166.581400
M516.78406252.9984125.59771e-061e-06
M630.0206252.99011810.039900
M7-27.48281252.983081-9.212900
M816.513752.9773125.54651e-061e-06
M930.83031252.97281710.370700
M1029.8068752.96960210.037300
M1118.88343752.9676726.36300
t-0.15656250.061813-2.53280.0147890.007395


Multiple Linear Regression - Regression Statistics
Multiple R0.968733906257455
R-squared0.938445381132827
Adjusted R-squared0.921049510583409
F-TEST (value)53.9464454203012
F-TEST (DF numerator)13
F-TEST (DF denominator)46
p-value0
Multiple Linear Regression - Residual Statistics
Residual Standard Deviation4.69128274904868
Sum Squared Residuals1012.37415625

\begin{tabular}{lllllllll}
\hline
Multiple Linear Regression - Regression Statistics \tabularnewline
Multiple R & 0.968733906257455 \tabularnewline
R-squared & 0.938445381132827 \tabularnewline
Adjusted R-squared & 0.921049510583409 \tabularnewline
F-TEST (value) & 53.9464454203012 \tabularnewline
F-TEST (DF numerator) & 13 \tabularnewline
F-TEST (DF denominator) & 46 \tabularnewline
p-value & 0 \tabularnewline
Multiple Linear Regression - Residual Statistics \tabularnewline
Residual Standard Deviation & 4.69128274904868 \tabularnewline
Sum Squared Residuals & 1012.37415625 \tabularnewline
\hline
\end{tabular}
%Source: https://freestatistics.org/blog/index.php?pk=25683&T=3

[TABLE]
[ROW][C]Multiple Linear Regression - Regression Statistics[/C][/ROW]
[ROW][C]Multiple R[/C][C]0.968733906257455[/C][/ROW]
[ROW][C]R-squared[/C][C]0.938445381132827[/C][/ROW]
[ROW][C]Adjusted R-squared[/C][C]0.921049510583409[/C][/ROW]
[ROW][C]F-TEST (value)[/C][C]53.9464454203012[/C][/ROW]
[ROW][C]F-TEST (DF numerator)[/C][C]13[/C][/ROW]
[ROW][C]F-TEST (DF denominator)[/C][C]46[/C][/ROW]
[ROW][C]p-value[/C][C]0[/C][/ROW]
[ROW][C]Multiple Linear Regression - Residual Statistics[/C][/ROW]
[ROW][C]Residual Standard Deviation[/C][C]4.69128274904868[/C][/ROW]
[ROW][C]Sum Squared Residuals[/C][C]1012.37415625[/C][/ROW]
[/TABLE]
Source: https://freestatistics.org/blog/index.php?pk=25683&T=3

Globally Unique Identifier (entire table): ba.freestatistics.org/blog/index.php?pk=25683&T=3

As an alternative you can also use a QR Code:  

The GUIDs for individual cells are displayed in the table below:

Multiple Linear Regression - Regression Statistics
Multiple R0.968733906257455
R-squared0.938445381132827
Adjusted R-squared0.921049510583409
F-TEST (value)53.9464454203012
F-TEST (DF numerator)13
F-TEST (DF denominator)46
p-value0
Multiple Linear Regression - Residual Statistics
Residual Standard Deviation4.69128274904868
Sum Squared Residuals1012.37415625


Multiple Linear Regression - Actuals, Interpolation, and Residuals
Time or IndexActualsInterpolationForecastResidualsPrediction Error
182.782.20468750.495312499999957
288.989.8046875-0.904687499999987
3105.9105.40468750.49531250000001
4100.898.04468752.75531250000001
59495.051875-1.05187499999999
6105108.131875-3.131875
758.550.4718758.028125
887.694.311875-6.711875
9113.1108.4718754.628125
10112.5107.2918755.208125
1189.696.211875-6.61187499999999
1274.577.171875-2.67187500000000
1382.780.32593752.37406250000001
1490.187.92593752.17406249999999
15109.4103.52593755.87406250000001
169696.1659375-0.165937500000004
1789.293.173125-3.973125
18109.1106.2531252.84687499999999
1949.148.5931250.506875000000006
2092.992.4331250.466875000000007
21107.7106.5931251.106875
22103.5105.413125-1.913125
2391.194.333125-3.23312500000001
2479.875.2931254.50687499999999
2571.978.4471875-6.54718749999999
2682.986.0471875-3.14718750000000
2790.1101.6471875-11.5471875
28100.794.28718756.4128125
2990.791.294375-0.594375000000002
30108.8104.3743754.425625
3144.146.714375-2.61437499999999
3293.690.5543753.04562499999999
33107.4104.7143752.685625
3496.5103.534375-7.034375
3593.692.4543751.14562499999999
3676.573.4143753.085625
3776.776.56843750.131562500000008
388484.1684375-0.168437500000002
39103.399.76843753.53156249999999
4088.592.4084375-3.90843750000001
419996.37968752.62031249999999
42105.9109.4596875-3.5596875
4344.751.7996875-7.0996875
449495.6396875-1.63968750000000
45107.1109.7996875-2.6996875
46104.8108.6196875-3.8196875
47102.597.53968754.9603125
4877.778.4996875-0.799687499999999
4985.281.653753.54625000000000
5091.389.253752.04624999999999
51106.5104.853751.64625000000000
5292.497.49375-5.09374999999999
5397.594.50093752.99906250000000
54107107.5809375-0.580937499999998
5551.149.92093751.17906249999999
5698.693.76093754.8390625
57102.2107.9209375-5.7209375
58114.3106.74093757.5590625
5999.495.66093753.7390625
6072.576.6209375-4.12093749999999

\begin{tabular}{lllllllll}
\hline
Multiple Linear Regression - Actuals, Interpolation, and Residuals \tabularnewline
Time or Index & Actuals & InterpolationForecast & ResidualsPrediction Error \tabularnewline
1 & 82.7 & 82.2046875 & 0.495312499999957 \tabularnewline
2 & 88.9 & 89.8046875 & -0.904687499999987 \tabularnewline
3 & 105.9 & 105.4046875 & 0.49531250000001 \tabularnewline
4 & 100.8 & 98.0446875 & 2.75531250000001 \tabularnewline
5 & 94 & 95.051875 & -1.05187499999999 \tabularnewline
6 & 105 & 108.131875 & -3.131875 \tabularnewline
7 & 58.5 & 50.471875 & 8.028125 \tabularnewline
8 & 87.6 & 94.311875 & -6.711875 \tabularnewline
9 & 113.1 & 108.471875 & 4.628125 \tabularnewline
10 & 112.5 & 107.291875 & 5.208125 \tabularnewline
11 & 89.6 & 96.211875 & -6.61187499999999 \tabularnewline
12 & 74.5 & 77.171875 & -2.67187500000000 \tabularnewline
13 & 82.7 & 80.3259375 & 2.37406250000001 \tabularnewline
14 & 90.1 & 87.9259375 & 2.17406249999999 \tabularnewline
15 & 109.4 & 103.5259375 & 5.87406250000001 \tabularnewline
16 & 96 & 96.1659375 & -0.165937500000004 \tabularnewline
17 & 89.2 & 93.173125 & -3.973125 \tabularnewline
18 & 109.1 & 106.253125 & 2.84687499999999 \tabularnewline
19 & 49.1 & 48.593125 & 0.506875000000006 \tabularnewline
20 & 92.9 & 92.433125 & 0.466875000000007 \tabularnewline
21 & 107.7 & 106.593125 & 1.106875 \tabularnewline
22 & 103.5 & 105.413125 & -1.913125 \tabularnewline
23 & 91.1 & 94.333125 & -3.23312500000001 \tabularnewline
24 & 79.8 & 75.293125 & 4.50687499999999 \tabularnewline
25 & 71.9 & 78.4471875 & -6.54718749999999 \tabularnewline
26 & 82.9 & 86.0471875 & -3.14718750000000 \tabularnewline
27 & 90.1 & 101.6471875 & -11.5471875 \tabularnewline
28 & 100.7 & 94.2871875 & 6.4128125 \tabularnewline
29 & 90.7 & 91.294375 & -0.594375000000002 \tabularnewline
30 & 108.8 & 104.374375 & 4.425625 \tabularnewline
31 & 44.1 & 46.714375 & -2.61437499999999 \tabularnewline
32 & 93.6 & 90.554375 & 3.04562499999999 \tabularnewline
33 & 107.4 & 104.714375 & 2.685625 \tabularnewline
34 & 96.5 & 103.534375 & -7.034375 \tabularnewline
35 & 93.6 & 92.454375 & 1.14562499999999 \tabularnewline
36 & 76.5 & 73.414375 & 3.085625 \tabularnewline
37 & 76.7 & 76.5684375 & 0.131562500000008 \tabularnewline
38 & 84 & 84.1684375 & -0.168437500000002 \tabularnewline
39 & 103.3 & 99.7684375 & 3.53156249999999 \tabularnewline
40 & 88.5 & 92.4084375 & -3.90843750000001 \tabularnewline
41 & 99 & 96.3796875 & 2.62031249999999 \tabularnewline
42 & 105.9 & 109.4596875 & -3.5596875 \tabularnewline
43 & 44.7 & 51.7996875 & -7.0996875 \tabularnewline
44 & 94 & 95.6396875 & -1.63968750000000 \tabularnewline
45 & 107.1 & 109.7996875 & -2.6996875 \tabularnewline
46 & 104.8 & 108.6196875 & -3.8196875 \tabularnewline
47 & 102.5 & 97.5396875 & 4.9603125 \tabularnewline
48 & 77.7 & 78.4996875 & -0.799687499999999 \tabularnewline
49 & 85.2 & 81.65375 & 3.54625000000000 \tabularnewline
50 & 91.3 & 89.25375 & 2.04624999999999 \tabularnewline
51 & 106.5 & 104.85375 & 1.64625000000000 \tabularnewline
52 & 92.4 & 97.49375 & -5.09374999999999 \tabularnewline
53 & 97.5 & 94.5009375 & 2.99906250000000 \tabularnewline
54 & 107 & 107.5809375 & -0.580937499999998 \tabularnewline
55 & 51.1 & 49.9209375 & 1.17906249999999 \tabularnewline
56 & 98.6 & 93.7609375 & 4.8390625 \tabularnewline
57 & 102.2 & 107.9209375 & -5.7209375 \tabularnewline
58 & 114.3 & 106.7409375 & 7.5590625 \tabularnewline
59 & 99.4 & 95.6609375 & 3.7390625 \tabularnewline
60 & 72.5 & 76.6209375 & -4.12093749999999 \tabularnewline
\hline
\end{tabular}
%Source: https://freestatistics.org/blog/index.php?pk=25683&T=4

[TABLE]
[ROW][C]Multiple Linear Regression - Actuals, Interpolation, and Residuals[/C][/ROW]
[ROW][C]Time or Index[/C][C]Actuals[/C][C]InterpolationForecast[/C][C]ResidualsPrediction Error[/C][/ROW]
[ROW][C]1[/C][C]82.7[/C][C]82.2046875[/C][C]0.495312499999957[/C][/ROW]
[ROW][C]2[/C][C]88.9[/C][C]89.8046875[/C][C]-0.904687499999987[/C][/ROW]
[ROW][C]3[/C][C]105.9[/C][C]105.4046875[/C][C]0.49531250000001[/C][/ROW]
[ROW][C]4[/C][C]100.8[/C][C]98.0446875[/C][C]2.75531250000001[/C][/ROW]
[ROW][C]5[/C][C]94[/C][C]95.051875[/C][C]-1.05187499999999[/C][/ROW]
[ROW][C]6[/C][C]105[/C][C]108.131875[/C][C]-3.131875[/C][/ROW]
[ROW][C]7[/C][C]58.5[/C][C]50.471875[/C][C]8.028125[/C][/ROW]
[ROW][C]8[/C][C]87.6[/C][C]94.311875[/C][C]-6.711875[/C][/ROW]
[ROW][C]9[/C][C]113.1[/C][C]108.471875[/C][C]4.628125[/C][/ROW]
[ROW][C]10[/C][C]112.5[/C][C]107.291875[/C][C]5.208125[/C][/ROW]
[ROW][C]11[/C][C]89.6[/C][C]96.211875[/C][C]-6.61187499999999[/C][/ROW]
[ROW][C]12[/C][C]74.5[/C][C]77.171875[/C][C]-2.67187500000000[/C][/ROW]
[ROW][C]13[/C][C]82.7[/C][C]80.3259375[/C][C]2.37406250000001[/C][/ROW]
[ROW][C]14[/C][C]90.1[/C][C]87.9259375[/C][C]2.17406249999999[/C][/ROW]
[ROW][C]15[/C][C]109.4[/C][C]103.5259375[/C][C]5.87406250000001[/C][/ROW]
[ROW][C]16[/C][C]96[/C][C]96.1659375[/C][C]-0.165937500000004[/C][/ROW]
[ROW][C]17[/C][C]89.2[/C][C]93.173125[/C][C]-3.973125[/C][/ROW]
[ROW][C]18[/C][C]109.1[/C][C]106.253125[/C][C]2.84687499999999[/C][/ROW]
[ROW][C]19[/C][C]49.1[/C][C]48.593125[/C][C]0.506875000000006[/C][/ROW]
[ROW][C]20[/C][C]92.9[/C][C]92.433125[/C][C]0.466875000000007[/C][/ROW]
[ROW][C]21[/C][C]107.7[/C][C]106.593125[/C][C]1.106875[/C][/ROW]
[ROW][C]22[/C][C]103.5[/C][C]105.413125[/C][C]-1.913125[/C][/ROW]
[ROW][C]23[/C][C]91.1[/C][C]94.333125[/C][C]-3.23312500000001[/C][/ROW]
[ROW][C]24[/C][C]79.8[/C][C]75.293125[/C][C]4.50687499999999[/C][/ROW]
[ROW][C]25[/C][C]71.9[/C][C]78.4471875[/C][C]-6.54718749999999[/C][/ROW]
[ROW][C]26[/C][C]82.9[/C][C]86.0471875[/C][C]-3.14718750000000[/C][/ROW]
[ROW][C]27[/C][C]90.1[/C][C]101.6471875[/C][C]-11.5471875[/C][/ROW]
[ROW][C]28[/C][C]100.7[/C][C]94.2871875[/C][C]6.4128125[/C][/ROW]
[ROW][C]29[/C][C]90.7[/C][C]91.294375[/C][C]-0.594375000000002[/C][/ROW]
[ROW][C]30[/C][C]108.8[/C][C]104.374375[/C][C]4.425625[/C][/ROW]
[ROW][C]31[/C][C]44.1[/C][C]46.714375[/C][C]-2.61437499999999[/C][/ROW]
[ROW][C]32[/C][C]93.6[/C][C]90.554375[/C][C]3.04562499999999[/C][/ROW]
[ROW][C]33[/C][C]107.4[/C][C]104.714375[/C][C]2.685625[/C][/ROW]
[ROW][C]34[/C][C]96.5[/C][C]103.534375[/C][C]-7.034375[/C][/ROW]
[ROW][C]35[/C][C]93.6[/C][C]92.454375[/C][C]1.14562499999999[/C][/ROW]
[ROW][C]36[/C][C]76.5[/C][C]73.414375[/C][C]3.085625[/C][/ROW]
[ROW][C]37[/C][C]76.7[/C][C]76.5684375[/C][C]0.131562500000008[/C][/ROW]
[ROW][C]38[/C][C]84[/C][C]84.1684375[/C][C]-0.168437500000002[/C][/ROW]
[ROW][C]39[/C][C]103.3[/C][C]99.7684375[/C][C]3.53156249999999[/C][/ROW]
[ROW][C]40[/C][C]88.5[/C][C]92.4084375[/C][C]-3.90843750000001[/C][/ROW]
[ROW][C]41[/C][C]99[/C][C]96.3796875[/C][C]2.62031249999999[/C][/ROW]
[ROW][C]42[/C][C]105.9[/C][C]109.4596875[/C][C]-3.5596875[/C][/ROW]
[ROW][C]43[/C][C]44.7[/C][C]51.7996875[/C][C]-7.0996875[/C][/ROW]
[ROW][C]44[/C][C]94[/C][C]95.6396875[/C][C]-1.63968750000000[/C][/ROW]
[ROW][C]45[/C][C]107.1[/C][C]109.7996875[/C][C]-2.6996875[/C][/ROW]
[ROW][C]46[/C][C]104.8[/C][C]108.6196875[/C][C]-3.8196875[/C][/ROW]
[ROW][C]47[/C][C]102.5[/C][C]97.5396875[/C][C]4.9603125[/C][/ROW]
[ROW][C]48[/C][C]77.7[/C][C]78.4996875[/C][C]-0.799687499999999[/C][/ROW]
[ROW][C]49[/C][C]85.2[/C][C]81.65375[/C][C]3.54625000000000[/C][/ROW]
[ROW][C]50[/C][C]91.3[/C][C]89.25375[/C][C]2.04624999999999[/C][/ROW]
[ROW][C]51[/C][C]106.5[/C][C]104.85375[/C][C]1.64625000000000[/C][/ROW]
[ROW][C]52[/C][C]92.4[/C][C]97.49375[/C][C]-5.09374999999999[/C][/ROW]
[ROW][C]53[/C][C]97.5[/C][C]94.5009375[/C][C]2.99906250000000[/C][/ROW]
[ROW][C]54[/C][C]107[/C][C]107.5809375[/C][C]-0.580937499999998[/C][/ROW]
[ROW][C]55[/C][C]51.1[/C][C]49.9209375[/C][C]1.17906249999999[/C][/ROW]
[ROW][C]56[/C][C]98.6[/C][C]93.7609375[/C][C]4.8390625[/C][/ROW]
[ROW][C]57[/C][C]102.2[/C][C]107.9209375[/C][C]-5.7209375[/C][/ROW]
[ROW][C]58[/C][C]114.3[/C][C]106.7409375[/C][C]7.5590625[/C][/ROW]
[ROW][C]59[/C][C]99.4[/C][C]95.6609375[/C][C]3.7390625[/C][/ROW]
[ROW][C]60[/C][C]72.5[/C][C]76.6209375[/C][C]-4.12093749999999[/C][/ROW]
[/TABLE]
Source: https://freestatistics.org/blog/index.php?pk=25683&T=4

Globally Unique Identifier (entire table): ba.freestatistics.org/blog/index.php?pk=25683&T=4

As an alternative you can also use a QR Code:  

The GUIDs for individual cells are displayed in the table below:

Multiple Linear Regression - Actuals, Interpolation, and Residuals
Time or IndexActualsInterpolationForecastResidualsPrediction Error
182.782.20468750.495312499999957
288.989.8046875-0.904687499999987
3105.9105.40468750.49531250000001
4100.898.04468752.75531250000001
59495.051875-1.05187499999999
6105108.131875-3.131875
758.550.4718758.028125
887.694.311875-6.711875
9113.1108.4718754.628125
10112.5107.2918755.208125
1189.696.211875-6.61187499999999
1274.577.171875-2.67187500000000
1382.780.32593752.37406250000001
1490.187.92593752.17406249999999
15109.4103.52593755.87406250000001
169696.1659375-0.165937500000004
1789.293.173125-3.973125
18109.1106.2531252.84687499999999
1949.148.5931250.506875000000006
2092.992.4331250.466875000000007
21107.7106.5931251.106875
22103.5105.413125-1.913125
2391.194.333125-3.23312500000001
2479.875.2931254.50687499999999
2571.978.4471875-6.54718749999999
2682.986.0471875-3.14718750000000
2790.1101.6471875-11.5471875
28100.794.28718756.4128125
2990.791.294375-0.594375000000002
30108.8104.3743754.425625
3144.146.714375-2.61437499999999
3293.690.5543753.04562499999999
33107.4104.7143752.685625
3496.5103.534375-7.034375
3593.692.4543751.14562499999999
3676.573.4143753.085625
3776.776.56843750.131562500000008
388484.1684375-0.168437500000002
39103.399.76843753.53156249999999
4088.592.4084375-3.90843750000001
419996.37968752.62031249999999
42105.9109.4596875-3.5596875
4344.751.7996875-7.0996875
449495.6396875-1.63968750000000
45107.1109.7996875-2.6996875
46104.8108.6196875-3.8196875
47102.597.53968754.9603125
4877.778.4996875-0.799687499999999
4985.281.653753.54625000000000
5091.389.253752.04624999999999
51106.5104.853751.64625000000000
5292.497.49375-5.09374999999999
5397.594.50093752.99906250000000
54107107.5809375-0.580937499999998
5551.149.92093751.17906249999999
5698.693.76093754.8390625
57102.2107.9209375-5.7209375
58114.3106.74093757.5590625
5999.495.66093753.7390625
6072.576.6209375-4.12093749999999


Goldfeld-Quandt test for Heteroskedasticity
p-valuesAlternative Hypothesis
breakpoint indexgreater2-sidedless
170.2653572896768400.5307145793536790.73464271032316
180.2210092492821990.4420184985643980.778990750717801
190.3621385908099050.724277181619810.637861409190095
200.3460477746992260.6920955493984520.653952225300774
210.2960039020083150.592007804016630.703996097991685
220.3134456527102050.626891305420410.686554347289795
230.2455594703261450.491118940652290.754440529673855
240.2783232863792070.5566465727584130.721676713620793
250.3702231309868290.7404462619736590.629776869013171
260.2944818089245090.5889636178490190.70551819107549
270.688045720165380.6239085596692410.311954279834620
280.852589182710020.2948216345799620.147410817289981
290.8167492677293880.3665014645412240.183250732270612
300.8376751396930630.3246497206138730.162324860306937
310.797194492306330.4056110153873410.202805507693670
320.7752295576156320.4495408847687350.224770442384368
330.8179622079196930.3640755841606140.182037792080307
340.883324304481870.2333513910362620.116675695518131
350.8642140347832060.2715719304335880.135785965216794
360.8831697295117340.2336605409765310.116830270488266
370.8357420654936340.3285158690127310.164257934506366
380.770311280913040.4593774381739210.229688719086961
390.6867057477672560.6265885044654880.313294252232744
400.5929142146147630.8141715707704730.407085785385237
410.4694378860993070.9388757721986150.530562113900693
420.3510871361979310.7021742723958630.648912863802069
430.3049303696487030.6098607392974070.695069630351297

\begin{tabular}{lllllllll}
\hline
Goldfeld-Quandt test for Heteroskedasticity \tabularnewline
p-values & Alternative Hypothesis \tabularnewline
breakpoint index & greater & 2-sided & less \tabularnewline
17 & 0.265357289676840 & 0.530714579353679 & 0.73464271032316 \tabularnewline
18 & 0.221009249282199 & 0.442018498564398 & 0.778990750717801 \tabularnewline
19 & 0.362138590809905 & 0.72427718161981 & 0.637861409190095 \tabularnewline
20 & 0.346047774699226 & 0.692095549398452 & 0.653952225300774 \tabularnewline
21 & 0.296003902008315 & 0.59200780401663 & 0.703996097991685 \tabularnewline
22 & 0.313445652710205 & 0.62689130542041 & 0.686554347289795 \tabularnewline
23 & 0.245559470326145 & 0.49111894065229 & 0.754440529673855 \tabularnewline
24 & 0.278323286379207 & 0.556646572758413 & 0.721676713620793 \tabularnewline
25 & 0.370223130986829 & 0.740446261973659 & 0.629776869013171 \tabularnewline
26 & 0.294481808924509 & 0.588963617849019 & 0.70551819107549 \tabularnewline
27 & 0.68804572016538 & 0.623908559669241 & 0.311954279834620 \tabularnewline
28 & 0.85258918271002 & 0.294821634579962 & 0.147410817289981 \tabularnewline
29 & 0.816749267729388 & 0.366501464541224 & 0.183250732270612 \tabularnewline
30 & 0.837675139693063 & 0.324649720613873 & 0.162324860306937 \tabularnewline
31 & 0.79719449230633 & 0.405611015387341 & 0.202805507693670 \tabularnewline
32 & 0.775229557615632 & 0.449540884768735 & 0.224770442384368 \tabularnewline
33 & 0.817962207919693 & 0.364075584160614 & 0.182037792080307 \tabularnewline
34 & 0.88332430448187 & 0.233351391036262 & 0.116675695518131 \tabularnewline
35 & 0.864214034783206 & 0.271571930433588 & 0.135785965216794 \tabularnewline
36 & 0.883169729511734 & 0.233660540976531 & 0.116830270488266 \tabularnewline
37 & 0.835742065493634 & 0.328515869012731 & 0.164257934506366 \tabularnewline
38 & 0.77031128091304 & 0.459377438173921 & 0.229688719086961 \tabularnewline
39 & 0.686705747767256 & 0.626588504465488 & 0.313294252232744 \tabularnewline
40 & 0.592914214614763 & 0.814171570770473 & 0.407085785385237 \tabularnewline
41 & 0.469437886099307 & 0.938875772198615 & 0.530562113900693 \tabularnewline
42 & 0.351087136197931 & 0.702174272395863 & 0.648912863802069 \tabularnewline
43 & 0.304930369648703 & 0.609860739297407 & 0.695069630351297 \tabularnewline
\hline
\end{tabular}
%Source: https://freestatistics.org/blog/index.php?pk=25683&T=5

[TABLE]
[ROW][C]Goldfeld-Quandt test for Heteroskedasticity[/C][/ROW]
[ROW][C]p-values[/C][C]Alternative Hypothesis[/C][/ROW]
[ROW][C]breakpoint index[/C][C]greater[/C][C]2-sided[/C][C]less[/C][/ROW]
[ROW][C]17[/C][C]0.265357289676840[/C][C]0.530714579353679[/C][C]0.73464271032316[/C][/ROW]
[ROW][C]18[/C][C]0.221009249282199[/C][C]0.442018498564398[/C][C]0.778990750717801[/C][/ROW]
[ROW][C]19[/C][C]0.362138590809905[/C][C]0.72427718161981[/C][C]0.637861409190095[/C][/ROW]
[ROW][C]20[/C][C]0.346047774699226[/C][C]0.692095549398452[/C][C]0.653952225300774[/C][/ROW]
[ROW][C]21[/C][C]0.296003902008315[/C][C]0.59200780401663[/C][C]0.703996097991685[/C][/ROW]
[ROW][C]22[/C][C]0.313445652710205[/C][C]0.62689130542041[/C][C]0.686554347289795[/C][/ROW]
[ROW][C]23[/C][C]0.245559470326145[/C][C]0.49111894065229[/C][C]0.754440529673855[/C][/ROW]
[ROW][C]24[/C][C]0.278323286379207[/C][C]0.556646572758413[/C][C]0.721676713620793[/C][/ROW]
[ROW][C]25[/C][C]0.370223130986829[/C][C]0.740446261973659[/C][C]0.629776869013171[/C][/ROW]
[ROW][C]26[/C][C]0.294481808924509[/C][C]0.588963617849019[/C][C]0.70551819107549[/C][/ROW]
[ROW][C]27[/C][C]0.68804572016538[/C][C]0.623908559669241[/C][C]0.311954279834620[/C][/ROW]
[ROW][C]28[/C][C]0.85258918271002[/C][C]0.294821634579962[/C][C]0.147410817289981[/C][/ROW]
[ROW][C]29[/C][C]0.816749267729388[/C][C]0.366501464541224[/C][C]0.183250732270612[/C][/ROW]
[ROW][C]30[/C][C]0.837675139693063[/C][C]0.324649720613873[/C][C]0.162324860306937[/C][/ROW]
[ROW][C]31[/C][C]0.79719449230633[/C][C]0.405611015387341[/C][C]0.202805507693670[/C][/ROW]
[ROW][C]32[/C][C]0.775229557615632[/C][C]0.449540884768735[/C][C]0.224770442384368[/C][/ROW]
[ROW][C]33[/C][C]0.817962207919693[/C][C]0.364075584160614[/C][C]0.182037792080307[/C][/ROW]
[ROW][C]34[/C][C]0.88332430448187[/C][C]0.233351391036262[/C][C]0.116675695518131[/C][/ROW]
[ROW][C]35[/C][C]0.864214034783206[/C][C]0.271571930433588[/C][C]0.135785965216794[/C][/ROW]
[ROW][C]36[/C][C]0.883169729511734[/C][C]0.233660540976531[/C][C]0.116830270488266[/C][/ROW]
[ROW][C]37[/C][C]0.835742065493634[/C][C]0.328515869012731[/C][C]0.164257934506366[/C][/ROW]
[ROW][C]38[/C][C]0.77031128091304[/C][C]0.459377438173921[/C][C]0.229688719086961[/C][/ROW]
[ROW][C]39[/C][C]0.686705747767256[/C][C]0.626588504465488[/C][C]0.313294252232744[/C][/ROW]
[ROW][C]40[/C][C]0.592914214614763[/C][C]0.814171570770473[/C][C]0.407085785385237[/C][/ROW]
[ROW][C]41[/C][C]0.469437886099307[/C][C]0.938875772198615[/C][C]0.530562113900693[/C][/ROW]
[ROW][C]42[/C][C]0.351087136197931[/C][C]0.702174272395863[/C][C]0.648912863802069[/C][/ROW]
[ROW][C]43[/C][C]0.304930369648703[/C][C]0.609860739297407[/C][C]0.695069630351297[/C][/ROW]
[/TABLE]
Source: https://freestatistics.org/blog/index.php?pk=25683&T=5

Globally Unique Identifier (entire table): ba.freestatistics.org/blog/index.php?pk=25683&T=5

As an alternative you can also use a QR Code:  

The GUIDs for individual cells are displayed in the table below:

Goldfeld-Quandt test for Heteroskedasticity
p-valuesAlternative Hypothesis
breakpoint indexgreater2-sidedless
170.2653572896768400.5307145793536790.73464271032316
180.2210092492821990.4420184985643980.778990750717801
190.3621385908099050.724277181619810.637861409190095
200.3460477746992260.6920955493984520.653952225300774
210.2960039020083150.592007804016630.703996097991685
220.3134456527102050.626891305420410.686554347289795
230.2455594703261450.491118940652290.754440529673855
240.2783232863792070.5566465727584130.721676713620793
250.3702231309868290.7404462619736590.629776869013171
260.2944818089245090.5889636178490190.70551819107549
270.688045720165380.6239085596692410.311954279834620
280.852589182710020.2948216345799620.147410817289981
290.8167492677293880.3665014645412240.183250732270612
300.8376751396930630.3246497206138730.162324860306937
310.797194492306330.4056110153873410.202805507693670
320.7752295576156320.4495408847687350.224770442384368
330.8179622079196930.3640755841606140.182037792080307
340.883324304481870.2333513910362620.116675695518131
350.8642140347832060.2715719304335880.135785965216794
360.8831697295117340.2336605409765310.116830270488266
370.8357420654936340.3285158690127310.164257934506366
380.770311280913040.4593774381739210.229688719086961
390.6867057477672560.6265885044654880.313294252232744
400.5929142146147630.8141715707704730.407085785385237
410.4694378860993070.9388757721986150.530562113900693
420.3510871361979310.7021742723958630.648912863802069
430.3049303696487030.6098607392974070.695069630351297


Meta Analysis of Goldfeld-Quandt test for Heteroskedasticity
Description# significant tests% significant testsOK/NOK
1% type I error level00OK
5% type I error level00OK
10% type I error level00OK

\begin{tabular}{lllllllll}
\hline
Meta Analysis of Goldfeld-Quandt test for Heteroskedasticity \tabularnewline
Description & # significant tests & % significant tests & OK/NOK \tabularnewline
1% type I error level & 0 & 0 & OK \tabularnewline
5% type I error level & 0 & 0 & OK \tabularnewline
10% type I error level & 0 & 0 & OK \tabularnewline
\hline
\end{tabular}
%Source: https://freestatistics.org/blog/index.php?pk=25683&T=6

[TABLE]
[ROW][C]Meta Analysis of Goldfeld-Quandt test for Heteroskedasticity[/C][/ROW]
[ROW][C]Description[/C][C]# significant tests[/C][C]% significant tests[/C][C]OK/NOK[/C][/ROW]
[ROW][C]1% type I error level[/C][C]0[/C][C]0[/C][C]OK[/C][/ROW]
[ROW][C]5% type I error level[/C][C]0[/C][C]0[/C][C]OK[/C][/ROW]
[ROW][C]10% type I error level[/C][C]0[/C][C]0[/C][C]OK[/C][/ROW]
[/TABLE]
Source: https://freestatistics.org/blog/index.php?pk=25683&T=6

Globally Unique Identifier (entire table): ba.freestatistics.org/blog/index.php?pk=25683&T=6

As an alternative you can also use a QR Code:  

The GUIDs for individual cells are displayed in the table below:

Meta Analysis of Goldfeld-Quandt test for Heteroskedasticity
Description# significant tests% significant testsOK/NOK
1% type I error level00OK
5% type I error level00OK
10% type I error level00OK


Parameters (Session):
par1 = 1 ; par2 = Include Monthly Dummies ; par3 = Linear Trend ;
Parameters (R input):
par1 = 1 ; par2 = Include Monthly Dummies ; par3 = Linear Trend ;
R code (references can be found in the software module):
library(lattice)
library(lmtest)
n25 <- 25 #minimum number of obs. for Goldfeld-Quandt test
par1 <- as.numeric(par1)
x <- t(y)
k <- length(x[1,])
n <- length(x[,1])
x1 <- cbind(x[,par1], x[,1:k!=par1])
mycolnames <- c(colnames(x)[par1], colnames(x)[1:k!=par1])
colnames(x1) <- mycolnames #colnames(x)[par1]
x <- x1
if (par3 == 'First Differences'){
x2 <- array(0, dim=c(n-1,k), dimnames=list(1:(n-1), paste('(1-B)',colnames(x),sep='')))
for (i in 1:n-1) {
for (j in 1:k) {
x2[i,j] <- x[i+1,j] - x[i,j]
}
}
x <- x2
}
if (par2 == 'Include Monthly Dummies'){
x2 <- array(0, dim=c(n,11), dimnames=list(1:n, paste('M', seq(1:11), sep ='')))
for (i in 1:11){
x2[seq(i,n,12),i] <- 1
}
x <- cbind(x, x2)
}
if (par2 == 'Include Quarterly Dummies'){
x2 <- array(0, dim=c(n,3), dimnames=list(1:n, paste('Q', seq(1:3), sep ='')))
for (i in 1:3){
x2[seq(i,n,4),i] <- 1
}
x <- cbind(x, x2)
}
k <- length(x[1,])
if (par3 == 'Linear Trend'){
x <- cbind(x, c(1:n))
colnames(x)[k+1] <- 't'
}
x
k <- length(x[1,])
df <- as.data.frame(x)
(mylm <- lm(df))
(mysum <- summary(mylm))
if (n > n25) {
kp3 <- k + 3
nmkm3 <- n - k - 3
gqarr <- array(NA, dim=c(nmkm3-kp3+1,3))
numgqtests <- 0
numsignificant1 <- 0
numsignificant5 <- 0
numsignificant10 <- 0
for (mypoint in kp3:nmkm3) {
j <- 0
numgqtests <- numgqtests + 1
for (myalt in c('greater', 'two.sided', 'less')) {
j <- j + 1
gqarr[mypoint-kp3+1,j] <- gqtest(mylm, point=mypoint, alternative=myalt)$p.value
}
if (gqarr[mypoint-kp3+1,2] < 0.01) numsignificant1 <- numsignificant1 + 1
if (gqarr[mypoint-kp3+1,2] < 0.05) numsignificant5 <- numsignificant5 + 1
if (gqarr[mypoint-kp3+1,2] < 0.10) numsignificant10 <- numsignificant10 + 1
}
gqarr
}
bitmap(file='test0.png')
plot(x[,1], type='l', main='Actuals and Interpolation', ylab='value of Actuals and Interpolation (dots)', xlab='time or index')
points(x[,1]-mysum$resid)
grid()
dev.off()
bitmap(file='test1.png')
plot(mysum$resid, type='b', pch=19, main='Residuals', ylab='value of Residuals', xlab='time or index')
grid()
dev.off()
bitmap(file='test2.png')
hist(mysum$resid, main='Residual Histogram', xlab='values of Residuals')
grid()
dev.off()
bitmap(file='test3.png')
densityplot(~mysum$resid,col='black',main='Residual Density Plot', xlab='values of Residuals')
dev.off()
bitmap(file='test4.png')
qqnorm(mysum$resid, main='Residual Normal Q-Q Plot')
qqline(mysum$resid)
grid()
dev.off()
(myerror <- as.ts(mysum$resid))
bitmap(file='test5.png')
dum <- cbind(lag(myerror,k=1),myerror)
dum
dum1 <- dum[2:length(myerror),]
dum1
z <- as.data.frame(dum1)
z
plot(z,main=paste('Residual Lag plot, lowess, and regression line'), ylab='values of Residuals', xlab='lagged values of Residuals')
lines(lowess(z))
abline(lm(z))
grid()
dev.off()
bitmap(file='test6.png')
acf(mysum$resid, lag.max=length(mysum$resid)/2, main='Residual Autocorrelation Function')
grid()
dev.off()
bitmap(file='test7.png')
pacf(mysum$resid, lag.max=length(mysum$resid)/2, main='Residual Partial Autocorrelation Function')
grid()
dev.off()
bitmap(file='test8.png')
opar <- par(mfrow = c(2,2), oma = c(0, 0, 1.1, 0))
plot(mylm, las = 1, sub='Residual Diagnostics')
par(opar)
dev.off()
if (n > n25) {
bitmap(file='test9.png')
plot(kp3:nmkm3,gqarr[,2], main='Goldfeld-Quandt test',ylab='2-sided p-value',xlab='breakpoint')
grid()
dev.off()
}
load(file='createtable')
a<-table.start()
a<-table.row.start(a)
a<-table.element(a, 'Multiple Linear Regression - Estimated Regression Equation', 1, TRUE)
a<-table.row.end(a)
myeq <- colnames(x)[1]
myeq <- paste(myeq, '[t] = ', sep='')
for (i in 1:k){
if (mysum$coefficients[i,1] > 0) myeq <- paste(myeq, '+', '')
myeq <- paste(myeq, mysum$coefficients[i,1], sep=' ')
if (rownames(mysum$coefficients)[i] != '(Intercept)') {
myeq <- paste(myeq, rownames(mysum$coefficients)[i], sep='')
if (rownames(mysum$coefficients)[i] != 't') myeq <- paste(myeq, '[t]', sep='')
}
}
myeq <- paste(myeq, ' + e[t]')
a<-table.row.start(a)
a<-table.element(a, myeq)
a<-table.row.end(a)
a<-table.end(a)
table.save(a,file='mytable1.tab')
a<-table.start()
a<-table.row.start(a)
a<-table.element(a,hyperlink('ols1.htm','Multiple Linear Regression - Ordinary Least Squares',''), 6, TRUE)
a<-table.row.end(a)
a<-table.row.start(a)
a<-table.element(a,'Variable',header=TRUE)
a<-table.element(a,'Parameter',header=TRUE)
a<-table.element(a,'S.D.',header=TRUE)
a<-table.element(a,'T-STAT
H0: parameter = 0',header=TRUE)
a<-table.element(a,'2-tail p-value',header=TRUE)
a<-table.element(a,'1-tail p-value',header=TRUE)
a<-table.row.end(a)
for (i in 1:k){
a<-table.row.start(a)
a<-table.element(a,rownames(mysum$coefficients)[i],header=TRUE)
a<-table.element(a,mysum$coefficients[i,1])
a<-table.element(a, round(mysum$coefficients[i,2],6))
a<-table.element(a, round(mysum$coefficients[i,3],4))
a<-table.element(a, round(mysum$coefficients[i,4],6))
a<-table.element(a, round(mysum$coefficients[i,4]/2,6))
a<-table.row.end(a)
}
a<-table.end(a)
table.save(a,file='mytable2.tab')
a<-table.start()
a<-table.row.start(a)
a<-table.element(a, 'Multiple Linear Regression - Regression Statistics', 2, TRUE)
a<-table.row.end(a)
a<-table.row.start(a)
a<-table.element(a, 'Multiple R',1,TRUE)
a<-table.element(a, sqrt(mysum$r.squared))
a<-table.row.end(a)
a<-table.row.start(a)
a<-table.element(a, 'R-squared',1,TRUE)
a<-table.element(a, mysum$r.squared)
a<-table.row.end(a)
a<-table.row.start(a)
a<-table.element(a, 'Adjusted R-squared',1,TRUE)
a<-table.element(a, mysum$adj.r.squared)
a<-table.row.end(a)
a<-table.row.start(a)
a<-table.element(a, 'F-TEST (value)',1,TRUE)
a<-table.element(a, mysum$fstatistic[1])
a<-table.row.end(a)
a<-table.row.start(a)
a<-table.element(a, 'F-TEST (DF numerator)',1,TRUE)
a<-table.element(a, mysum$fstatistic[2])
a<-table.row.end(a)
a<-table.row.start(a)
a<-table.element(a, 'F-TEST (DF denominator)',1,TRUE)
a<-table.element(a, mysum$fstatistic[3])
a<-table.row.end(a)
a<-table.row.start(a)
a<-table.element(a, 'p-value',1,TRUE)
a<-table.element(a, 1-pf(mysum$fstatistic[1],mysum$fstatistic[2],mysum$fstatistic[3]))
a<-table.row.end(a)
a<-table.row.start(a)
a<-table.element(a, 'Multiple Linear Regression - Residual Statistics', 2, TRUE)
a<-table.row.end(a)
a<-table.row.start(a)
a<-table.element(a, 'Residual Standard Deviation',1,TRUE)
a<-table.element(a, mysum$sigma)
a<-table.row.end(a)
a<-table.row.start(a)
a<-table.element(a, 'Sum Squared Residuals',1,TRUE)
a<-table.element(a, sum(myerror*myerror))
a<-table.row.end(a)
a<-table.end(a)
table.save(a,file='mytable3.tab')
a<-table.start()
a<-table.row.start(a)
a<-table.element(a, 'Multiple Linear Regression - Actuals, Interpolation, and Residuals', 4, TRUE)
a<-table.row.end(a)
a<-table.row.start(a)
a<-table.element(a, 'Time or Index', 1, TRUE)
a<-table.element(a, 'Actuals', 1, TRUE)
a<-table.element(a, 'Interpolation
Forecast', 1, TRUE)
a<-table.element(a, 'Residuals
Prediction Error', 1, TRUE)
a<-table.row.end(a)
for (i in 1:n) {
a<-table.row.start(a)
a<-table.element(a,i, 1, TRUE)
a<-table.element(a,x[i])
a<-table.element(a,x[i]-mysum$resid[i])
a<-table.element(a,mysum$resid[i])
a<-table.row.end(a)
}
a<-table.end(a)
table.save(a,file='mytable4.tab')
if (n > n25) {
a<-table.start()
a<-table.row.start(a)
a<-table.element(a,'Goldfeld-Quandt test for Heteroskedasticity',4,TRUE)
a<-table.row.end(a)
a<-table.row.start(a)
a<-table.element(a,'p-values',header=TRUE)
a<-table.element(a,'Alternative Hypothesis',3,header=TRUE)
a<-table.row.end(a)
a<-table.row.start(a)
a<-table.element(a,'breakpoint index',header=TRUE)
a<-table.element(a,'greater',header=TRUE)
a<-table.element(a,'2-sided',header=TRUE)
a<-table.element(a,'less',header=TRUE)
a<-table.row.end(a)
for (mypoint in kp3:nmkm3) {
a<-table.row.start(a)
a<-table.element(a,mypoint,header=TRUE)
a<-table.element(a,gqarr[mypoint-kp3+1,1])
a<-table.element(a,gqarr[mypoint-kp3+1,2])
a<-table.element(a,gqarr[mypoint-kp3+1,3])
a<-table.row.end(a)
}
a<-table.end(a)
table.save(a,file='mytable5.tab')
a<-table.start()
a<-table.row.start(a)
a<-table.element(a,'Meta Analysis of Goldfeld-Quandt test for Heteroskedasticity',4,TRUE)
a<-table.row.end(a)
a<-table.row.start(a)
a<-table.element(a,'Description',header=TRUE)
a<-table.element(a,'# significant tests',header=TRUE)
a<-table.element(a,'% significant tests',header=TRUE)
a<-table.element(a,'OK/NOK',header=TRUE)
a<-table.row.end(a)
a<-table.row.start(a)
a<-table.element(a,'1% type I error level',header=TRUE)
a<-table.element(a,numsignificant1)
a<-table.element(a,numsignificant1/numgqtests)
if (numsignificant1/numgqtests < 0.01) dum <- 'OK' else dum <- 'NOK'
a<-table.element(a,dum)
a<-table.row.end(a)
a<-table.row.start(a)
a<-table.element(a,'5% type I error level',header=TRUE)
a<-table.element(a,numsignificant5)
a<-table.element(a,numsignificant5/numgqtests)
if (numsignificant5/numgqtests < 0.05) dum <- 'OK' else dum <- 'NOK'
a<-table.element(a,dum)
a<-table.row.end(a)
a<-table.row.start(a)
a<-table.element(a,'10% type I error level',header=TRUE)
a<-table.element(a,numsignificant10)
a<-table.element(a,numsignificant10/numgqtests)
if (numsignificant10/numgqtests < 0.1) dum <- 'OK' else dum <- 'NOK'
a<-table.element(a,dum)
a<-table.row.end(a)
a<-table.end(a)
table.save(a,file='mytable6.tab')
}