Free Statistics

of Irreproducible Research!

Author's title

Author*Unverified author*
R Software Modulerwasp_multipleregression.wasp
Title produced by softwareMultiple Regression
Date of computationSun, 23 Nov 2008 07:31:37 -0700
Cite this page as followsStatistical Computations at FreeStatistics.org, Office for Research Development and Education, URL https://freestatistics.org/blog/index.php?v=date/2008/Nov/23/t12274509143drz8mswac03sk2.htm/, Retrieved Mon, 20 May 2024 04:56:58 +0000
Statistical Computations at FreeStatistics.org, Office for Research Development and Education, URL https://freestatistics.org/blog/index.php?pk=25267, Retrieved Mon, 20 May 2024 04:56:58 +0000
QR Codes:

Original text written by user:
IsPrivate?No (this computation is public)
User-defined keywords
Estimated Impact128
Family? (F = Feedback message, R = changed R code, M = changed R Module, P = changed Parameters, D = changed Data)
F       [Multiple Regression] [] [2008-11-23 14:31:37] [1768685c15539a739b6b33586be71b78] [Current]
Feedback Forum
2008-11-30 10:03:43 [Tinneke De Bock] [reply
Hierbij moet je wel opletten met de standaarddeviatie. Het is waar dat we een dalende waarde van 0,83 waarnemen voor de investeringen, maar hierbij hebben we wel een standaarddeviatie van 1,31. Dit betekent dat we er 1,31 zouden kunnen naast zitten en dat de investeringen evengoed zouden kunnen toenemen.

We moeten dus rekening houden met de 2-tailed p-value, omdat we er niet zeker van zijn of de investeringen wel zeker zullen dalen bij een intrest hoger dan 4,5%. Deze p-waarden zijn zeer hoog. De kans dat we ons vergissen bij het verwerpen van de hypothese is dus groot. (nulhypothese= een verhoogde intrestvoet heeft geen effect op het aantal investeringen) De kans dat dit verband op toeval is berust is dus reëel.

Wat we wel duidelijk waarnemen is een dalende trend op lange termijn van 0.7 per maand. Hiervoor is de p-waarde gelijk aan 0 en de absolute waarde van de t-verdeling groter dan 2, waaruit we kunnen afleiden dat deze dalende trend significant is en dat de kans dat we ons vergissen zeer klein is.
Bij de andere variabelen stellen we vast dat de absolute waarde van de t-verdeling nooit groter is dan 2, hieruit kunnen we afleiden dat het geen goed model is.

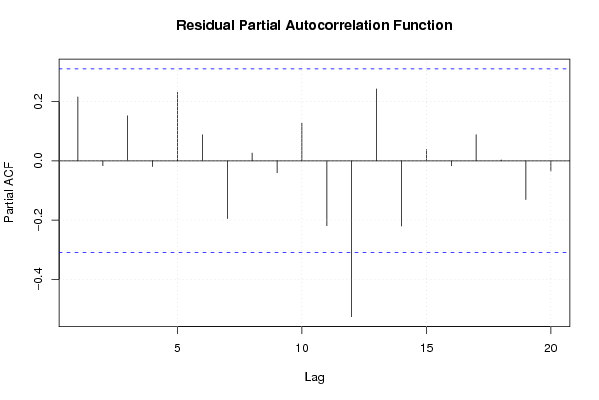
Bij deze oefening is het ook zeker nuttig om de volgende figuren te bespreken:
- actuals and interpolations
- residuals
- residual histogram
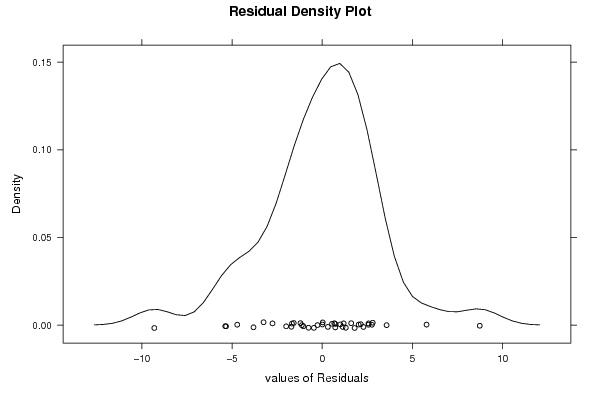
- residual density plot
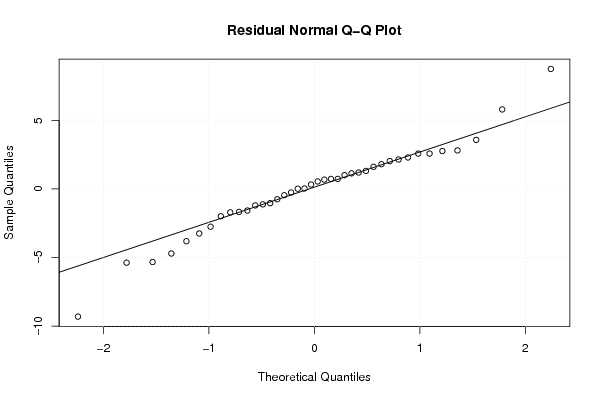
- residual normal QQ-plot
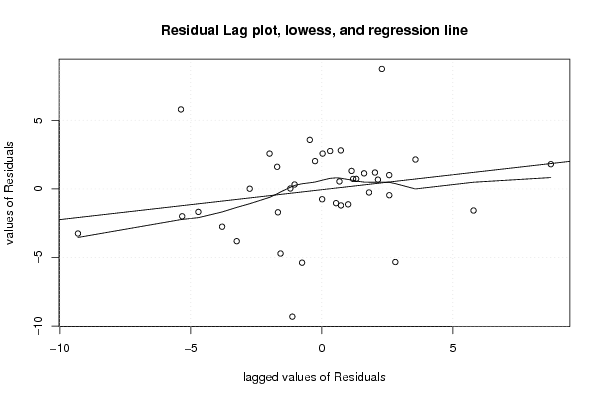
- residual lag-plot
- residual autocorrelation
Aan de hand van al deze gegevens kan je dan een uitspraak doen over je model, rekening gehouden met de volgende assumpties: Is er een patroon of autocorrelatie? Is het gemiddelde constant en gelijk aan 0?
2008-11-30 13:09:09 [c00776cbed2786c9c4960950021bd861] [reply
De conclusie bij de tabel is niet helemaal correct : we kunnen 80% van de schommelingen in de investeringen verklaren.
ook hier is de residual standard deviation handig om te vermelden.

Ook bij de tweede tabel had veel meer informatie moeten staat.

De maand december is hier de standaardmaand met een intercept van 131 dat ongeveerd 2 à 3 eenheden kan afwijken naar boven of naar beneden (standaard deviatie).
Als het interestniveau stijgt boven 4.5% is er inderdaad een gemiddelde daling van 0.83%.

Ook wordt hier weer de toevoeging van de lineaire trend niet vermeld: deze bedraagt -0.70 wat betekent dat we op lange termijn een dalende trend zullen hebben.

Je zou ook de grafieken moeten toevoegen en hier wat informatie over geven om je conclusie te ondersteunen.
2008-12-01 22:34:47 [Li Tang Hu] [reply
heel beknopte bespreking, hier kan duidelijk meer over worden gezegd...analyseer al de grafieken en concludeer dan of het een betrowbaar model is of niet.

Post a new message
Dataseries X:
132.7	0
128.6	0
127.8	0
128.9	0
124.6	0
129.2	0
130.5	0
124.3	0
125.8	0
123.5	1
120.7	1
123.1	1
122.0	1
121.0	0
121.2	1
117.4	1
113.0	1
113.1	1
116.1	1
121.3	1
108.6	1
114.3	1
113.5	1
111.2	1
109.3	0
108.2	0
102.7	0
110.4	0
108.1	0
112.8	0
108.1	0
102.6	0
109.2	0
108.2	0
107.1	0
108.4	0
103.6	1
104.0	1
111.5	1
105.4	0


Summary of computational transaction
Raw Inputview raw input (R code)
Raw Outputview raw output of R engine
Computing time6 seconds
R Server'Herman Ole Andreas Wold' @ 193.190.124.10:1001

\begin{tabular}{lllllllll}
\hline
Summary of computational transaction \tabularnewline
Raw Input & view raw input (R code)  \tabularnewline
Raw Output & view raw output of R engine  \tabularnewline
Computing time & 6 seconds \tabularnewline
R Server & 'Herman Ole Andreas Wold' @ 193.190.124.10:1001 \tabularnewline
\hline
\end{tabular}
%Source: https://freestatistics.org/blog/index.php?pk=25267&T=0

[TABLE]
[ROW][C]Summary of computational transaction[/C][/ROW]
[ROW][C]Raw Input[/C][C]view raw input (R code) [/C][/ROW]
[ROW][C]Raw Output[/C][C]view raw output of R engine [/C][/ROW]
[ROW][C]Computing time[/C][C]6 seconds[/C][/ROW]
[ROW][C]R Server[/C][C]'Herman Ole Andreas Wold' @ 193.190.124.10:1001[/C][/ROW]
[/TABLE]
Source: https://freestatistics.org/blog/index.php?pk=25267&T=0

Globally Unique Identifier (entire table): ba.freestatistics.org/blog/index.php?pk=25267&T=0

As an alternative you can also use a QR Code:  

The GUIDs for individual cells are displayed in the table below:

Summary of computational transaction
Raw Inputview raw input (R code)
Raw Outputview raw output of R engine
Computing time6 seconds
R Server'Herman Ole Andreas Wold' @ 193.190.124.10:1001


Multiple Linear Regression - Estimated Regression Equation
Investeringsgoederen[t] = + 131.620492662474 -0.834905660377361Intres[t] -0.978850017470295M1[t] -1.93630328441650M2[t] -0.676303721174005M3[t] -0.458756988120192M4[t] -4.18721392382950M5[t] -0.352607442348018M6[t] + 0.215332372466799M7[t] -1.25006114605172M8[t] -2.08212133123690M9[t] -0.302546296296298M10[t] -1.16793981481482M11[t] -0.701273148148148t + e[t]

\begin{tabular}{lllllllll}
\hline
Multiple Linear Regression - Estimated Regression Equation \tabularnewline
Investeringsgoederen[t] =  +  131.620492662474 -0.834905660377361Intres[t] -0.978850017470295M1[t] -1.93630328441650M2[t] -0.676303721174005M3[t] -0.458756988120192M4[t] -4.18721392382950M5[t] -0.352607442348018M6[t] +  0.215332372466799M7[t] -1.25006114605172M8[t] -2.08212133123690M9[t] -0.302546296296298M10[t] -1.16793981481482M11[t] -0.701273148148148t  + e[t] \tabularnewline
\hline
\end{tabular}
%Source: https://freestatistics.org/blog/index.php?pk=25267&T=1

[TABLE]
[ROW][C]Multiple Linear Regression - Estimated Regression Equation[/C][/ROW]
[ROW][C]Investeringsgoederen[t] =  +  131.620492662474 -0.834905660377361Intres[t] -0.978850017470295M1[t] -1.93630328441650M2[t] -0.676303721174005M3[t] -0.458756988120192M4[t] -4.18721392382950M5[t] -0.352607442348018M6[t] +  0.215332372466799M7[t] -1.25006114605172M8[t] -2.08212133123690M9[t] -0.302546296296298M10[t] -1.16793981481482M11[t] -0.701273148148148t  + e[t][/C][/ROW]
[/TABLE]
Source: https://freestatistics.org/blog/index.php?pk=25267&T=1

Globally Unique Identifier (entire table): ba.freestatistics.org/blog/index.php?pk=25267&T=1

As an alternative you can also use a QR Code:  

The GUIDs for individual cells are displayed in the table below:

Multiple Linear Regression - Estimated Regression Equation
Investeringsgoederen[t] = + 131.620492662474 -0.834905660377361Intres[t] -0.978850017470295M1[t] -1.93630328441650M2[t] -0.676303721174005M3[t] -0.458756988120192M4[t] -4.18721392382950M5[t] -0.352607442348018M6[t] + 0.215332372466799M7[t] -1.25006114605172M8[t] -2.08212133123690M9[t] -0.302546296296298M10[t] -1.16793981481482M11[t] -0.701273148148148t + e[t]


Multiple Linear Regression - Ordinary Least Squares
VariableParameterS.D.T-STATH0: parameter = 02-tail p-value1-tail p-value
(Intercept)131.6204926624742.7387348.05900
Intres-0.8349056603773611.310057-0.63730.5294990.264749
M1-0.9788500174702952.994032-0.32690.7463360.373168
M2-1.936303284416503.031204-0.63880.5285470.264274
M3-0.6763037211740052.986208-0.22650.8226030.411301
M4-0.4587569881201923.02541-0.15160.8806460.440323
M5-4.187213923829503.23122-1.29590.206410.103205
M6-0.3526074423480183.225332-0.10930.9137850.456892
M70.2153323724667993.2203420.06690.94720.4736
M8-1.250061146051723.216252-0.38870.7006850.350342
M9-2.082121331236903.213068-0.6480.5226560.261328
M10-0.3025462962962983.180958-0.09510.9249550.462478
M11-1.167939814814823.179578-0.36730.7163490.358175
t-0.7012731481481480.054078-12.967800

\begin{tabular}{lllllllll}
\hline
Multiple Linear Regression - Ordinary Least Squares \tabularnewline
Variable & Parameter & S.D. & T-STATH0: parameter = 0 & 2-tail p-value & 1-tail p-value \tabularnewline
(Intercept) & 131.620492662474 & 2.73873 & 48.059 & 0 & 0 \tabularnewline
Intres & -0.834905660377361 & 1.310057 & -0.6373 & 0.529499 & 0.264749 \tabularnewline
M1 & -0.978850017470295 & 2.994032 & -0.3269 & 0.746336 & 0.373168 \tabularnewline
M2 & -1.93630328441650 & 3.031204 & -0.6388 & 0.528547 & 0.264274 \tabularnewline
M3 & -0.676303721174005 & 2.986208 & -0.2265 & 0.822603 & 0.411301 \tabularnewline
M4 & -0.458756988120192 & 3.02541 & -0.1516 & 0.880646 & 0.440323 \tabularnewline
M5 & -4.18721392382950 & 3.23122 & -1.2959 & 0.20641 & 0.103205 \tabularnewline
M6 & -0.352607442348018 & 3.225332 & -0.1093 & 0.913785 & 0.456892 \tabularnewline
M7 & 0.215332372466799 & 3.220342 & 0.0669 & 0.9472 & 0.4736 \tabularnewline
M8 & -1.25006114605172 & 3.216252 & -0.3887 & 0.700685 & 0.350342 \tabularnewline
M9 & -2.08212133123690 & 3.213068 & -0.648 & 0.522656 & 0.261328 \tabularnewline
M10 & -0.302546296296298 & 3.180958 & -0.0951 & 0.924955 & 0.462478 \tabularnewline
M11 & -1.16793981481482 & 3.179578 & -0.3673 & 0.716349 & 0.358175 \tabularnewline
t & -0.701273148148148 & 0.054078 & -12.9678 & 0 & 0 \tabularnewline
\hline
\end{tabular}
%Source: https://freestatistics.org/blog/index.php?pk=25267&T=2

[TABLE]
[ROW][C]Multiple Linear Regression - Ordinary Least Squares[/C][/ROW]
[ROW][C]Variable[/C][C]Parameter[/C][C]S.D.[/C][C]T-STATH0: parameter = 0[/C][C]2-tail p-value[/C][C]1-tail p-value[/C][/ROW]
[ROW][C](Intercept)[/C][C]131.620492662474[/C][C]2.73873[/C][C]48.059[/C][C]0[/C][C]0[/C][/ROW]
[ROW][C]Intres[/C][C]-0.834905660377361[/C][C]1.310057[/C][C]-0.6373[/C][C]0.529499[/C][C]0.264749[/C][/ROW]
[ROW][C]M1[/C][C]-0.978850017470295[/C][C]2.994032[/C][C]-0.3269[/C][C]0.746336[/C][C]0.373168[/C][/ROW]
[ROW][C]M2[/C][C]-1.93630328441650[/C][C]3.031204[/C][C]-0.6388[/C][C]0.528547[/C][C]0.264274[/C][/ROW]
[ROW][C]M3[/C][C]-0.676303721174005[/C][C]2.986208[/C][C]-0.2265[/C][C]0.822603[/C][C]0.411301[/C][/ROW]
[ROW][C]M4[/C][C]-0.458756988120192[/C][C]3.02541[/C][C]-0.1516[/C][C]0.880646[/C][C]0.440323[/C][/ROW]
[ROW][C]M5[/C][C]-4.18721392382950[/C][C]3.23122[/C][C]-1.2959[/C][C]0.20641[/C][C]0.103205[/C][/ROW]
[ROW][C]M6[/C][C]-0.352607442348018[/C][C]3.225332[/C][C]-0.1093[/C][C]0.913785[/C][C]0.456892[/C][/ROW]
[ROW][C]M7[/C][C]0.215332372466799[/C][C]3.220342[/C][C]0.0669[/C][C]0.9472[/C][C]0.4736[/C][/ROW]
[ROW][C]M8[/C][C]-1.25006114605172[/C][C]3.216252[/C][C]-0.3887[/C][C]0.700685[/C][C]0.350342[/C][/ROW]
[ROW][C]M9[/C][C]-2.08212133123690[/C][C]3.213068[/C][C]-0.648[/C][C]0.522656[/C][C]0.261328[/C][/ROW]
[ROW][C]M10[/C][C]-0.302546296296298[/C][C]3.180958[/C][C]-0.0951[/C][C]0.924955[/C][C]0.462478[/C][/ROW]
[ROW][C]M11[/C][C]-1.16793981481482[/C][C]3.179578[/C][C]-0.3673[/C][C]0.716349[/C][C]0.358175[/C][/ROW]
[ROW][C]t[/C][C]-0.701273148148148[/C][C]0.054078[/C][C]-12.9678[/C][C]0[/C][C]0[/C][/ROW]
[/TABLE]
Source: https://freestatistics.org/blog/index.php?pk=25267&T=2

Globally Unique Identifier (entire table): ba.freestatistics.org/blog/index.php?pk=25267&T=2

As an alternative you can also use a QR Code:  

The GUIDs for individual cells are displayed in the table below:

Multiple Linear Regression - Ordinary Least Squares
VariableParameterS.D.T-STATH0: parameter = 02-tail p-value1-tail p-value
(Intercept)131.6204926624742.7387348.05900
Intres-0.8349056603773611.310057-0.63730.5294990.264749
M1-0.9788500174702952.994032-0.32690.7463360.373168
M2-1.936303284416503.031204-0.63880.5285470.264274
M3-0.6763037211740052.986208-0.22650.8226030.411301
M4-0.4587569881201923.02541-0.15160.8806460.440323
M5-4.187213923829503.23122-1.29590.206410.103205
M6-0.3526074423480183.225332-0.10930.9137850.456892
M70.2153323724667993.2203420.06690.94720.4736
M8-1.250061146051723.216252-0.38870.7006850.350342
M9-2.082121331236903.213068-0.6480.5226560.261328
M10-0.3025462962962983.180958-0.09510.9249550.462478
M11-1.167939814814823.179578-0.36730.7163490.358175
t-0.7012731481481480.054078-12.967800


Multiple Linear Regression - Regression Statistics
Multiple R0.93244384713827
R-squared0.869451528066018
Adjusted R-squared0.804177292099026
F-TEST (value)13.3199801604065
F-TEST (DF numerator)13
F-TEST (DF denominator)26
p-value2.43365920749028e-08
Multiple Linear Regression - Residual Statistics
Residual Standard Deviation3.89360916863614
Sum Squared Residuals394.165001310273

\begin{tabular}{lllllllll}
\hline
Multiple Linear Regression - Regression Statistics \tabularnewline
Multiple R & 0.93244384713827 \tabularnewline
R-squared & 0.869451528066018 \tabularnewline
Adjusted R-squared & 0.804177292099026 \tabularnewline
F-TEST (value) & 13.3199801604065 \tabularnewline
F-TEST (DF numerator) & 13 \tabularnewline
F-TEST (DF denominator) & 26 \tabularnewline
p-value & 2.43365920749028e-08 \tabularnewline
Multiple Linear Regression - Residual Statistics \tabularnewline
Residual Standard Deviation & 3.89360916863614 \tabularnewline
Sum Squared Residuals & 394.165001310273 \tabularnewline
\hline
\end{tabular}
%Source: https://freestatistics.org/blog/index.php?pk=25267&T=3

[TABLE]
[ROW][C]Multiple Linear Regression - Regression Statistics[/C][/ROW]
[ROW][C]Multiple R[/C][C]0.93244384713827[/C][/ROW]
[ROW][C]R-squared[/C][C]0.869451528066018[/C][/ROW]
[ROW][C]Adjusted R-squared[/C][C]0.804177292099026[/C][/ROW]
[ROW][C]F-TEST (value)[/C][C]13.3199801604065[/C][/ROW]
[ROW][C]F-TEST (DF numerator)[/C][C]13[/C][/ROW]
[ROW][C]F-TEST (DF denominator)[/C][C]26[/C][/ROW]
[ROW][C]p-value[/C][C]2.43365920749028e-08[/C][/ROW]
[ROW][C]Multiple Linear Regression - Residual Statistics[/C][/ROW]
[ROW][C]Residual Standard Deviation[/C][C]3.89360916863614[/C][/ROW]
[ROW][C]Sum Squared Residuals[/C][C]394.165001310273[/C][/ROW]
[/TABLE]
Source: https://freestatistics.org/blog/index.php?pk=25267&T=3

Globally Unique Identifier (entire table): ba.freestatistics.org/blog/index.php?pk=25267&T=3

As an alternative you can also use a QR Code:  

The GUIDs for individual cells are displayed in the table below:

Multiple Linear Regression - Regression Statistics
Multiple R0.93244384713827
R-squared0.869451528066018
Adjusted R-squared0.804177292099026
F-TEST (value)13.3199801604065
F-TEST (DF numerator)13
F-TEST (DF denominator)26
p-value2.43365920749028e-08
Multiple Linear Regression - Residual Statistics
Residual Standard Deviation3.89360916863614
Sum Squared Residuals394.165001310273


Multiple Linear Regression - Actuals, Interpolation, and Residuals
Time or IndexActualsInterpolationForecastResidualsPrediction Error
1132.7129.9403694968552.75963050314468
2128.6128.2816430817610.318356918238984
3127.8128.840369496855-1.04036949685536
4128.9128.3566430817610.543356918238993
5124.6123.9269129979040.673087002096431
6129.2127.0602463312372.13975366876310
7130.5126.9269129979043.57308700209644
8124.3124.760246331237-0.4602463312369
9125.8123.2269129979042.57308700209643
10123.5123.4703092243190.0296907756813441
11120.7121.903642557652-1.20364255765199
12123.1122.3703092243190.729690775681334
13122120.6901860587001.30981394129978
14121119.8663653039831.13363469601678
15121.2119.5901860587001.60981394129979
16117.4119.106459643606-1.70645964360587
17113114.676729559748-1.67672955974842
18113.1117.810062893082-4.71006289308176
19116.1117.676729559748-1.57672955974843
20121.3115.5100628930825.78993710691824
21108.6113.976729559748-5.37672955974843
22114.3115.055031446541-0.755031446540882
23113.5113.4883647798740.0116352201257889
24111.2113.955031446541-2.75503144654088
25109.3113.109813941300-3.8098139412998
26108.2111.451087526205-3.25108752620545
27102.7112.009813941300-9.30981394129979
28110.4111.526087526205-1.12608752620545
29108.1107.0963574423481.00364255765199
30112.8110.2296907756812.57030922431866
31108.1110.096357442348-1.99635744234801
32102.6107.929690775681-5.32969077568134
33109.2106.3963574423482.803642557652
34108.2107.4746593291400.725340670859537
35107.1105.9079926624741.19200733752620
36108.4106.3746593291402.02534067085954
37103.6103.859630503145-0.259630503144666
38104102.2009040880501.79909591194969
39111.5102.7596305031458.74036949685535
40105.4103.1108097484282.28919025157233

\begin{tabular}{lllllllll}
\hline
Multiple Linear Regression - Actuals, Interpolation, and Residuals \tabularnewline
Time or Index & Actuals & InterpolationForecast & ResidualsPrediction Error \tabularnewline
1 & 132.7 & 129.940369496855 & 2.75963050314468 \tabularnewline
2 & 128.6 & 128.281643081761 & 0.318356918238984 \tabularnewline
3 & 127.8 & 128.840369496855 & -1.04036949685536 \tabularnewline
4 & 128.9 & 128.356643081761 & 0.543356918238993 \tabularnewline
5 & 124.6 & 123.926912997904 & 0.673087002096431 \tabularnewline
6 & 129.2 & 127.060246331237 & 2.13975366876310 \tabularnewline
7 & 130.5 & 126.926912997904 & 3.57308700209644 \tabularnewline
8 & 124.3 & 124.760246331237 & -0.4602463312369 \tabularnewline
9 & 125.8 & 123.226912997904 & 2.57308700209643 \tabularnewline
10 & 123.5 & 123.470309224319 & 0.0296907756813441 \tabularnewline
11 & 120.7 & 121.903642557652 & -1.20364255765199 \tabularnewline
12 & 123.1 & 122.370309224319 & 0.729690775681334 \tabularnewline
13 & 122 & 120.690186058700 & 1.30981394129978 \tabularnewline
14 & 121 & 119.866365303983 & 1.13363469601678 \tabularnewline
15 & 121.2 & 119.590186058700 & 1.60981394129979 \tabularnewline
16 & 117.4 & 119.106459643606 & -1.70645964360587 \tabularnewline
17 & 113 & 114.676729559748 & -1.67672955974842 \tabularnewline
18 & 113.1 & 117.810062893082 & -4.71006289308176 \tabularnewline
19 & 116.1 & 117.676729559748 & -1.57672955974843 \tabularnewline
20 & 121.3 & 115.510062893082 & 5.78993710691824 \tabularnewline
21 & 108.6 & 113.976729559748 & -5.37672955974843 \tabularnewline
22 & 114.3 & 115.055031446541 & -0.755031446540882 \tabularnewline
23 & 113.5 & 113.488364779874 & 0.0116352201257889 \tabularnewline
24 & 111.2 & 113.955031446541 & -2.75503144654088 \tabularnewline
25 & 109.3 & 113.109813941300 & -3.8098139412998 \tabularnewline
26 & 108.2 & 111.451087526205 & -3.25108752620545 \tabularnewline
27 & 102.7 & 112.009813941300 & -9.30981394129979 \tabularnewline
28 & 110.4 & 111.526087526205 & -1.12608752620545 \tabularnewline
29 & 108.1 & 107.096357442348 & 1.00364255765199 \tabularnewline
30 & 112.8 & 110.229690775681 & 2.57030922431866 \tabularnewline
31 & 108.1 & 110.096357442348 & -1.99635744234801 \tabularnewline
32 & 102.6 & 107.929690775681 & -5.32969077568134 \tabularnewline
33 & 109.2 & 106.396357442348 & 2.803642557652 \tabularnewline
34 & 108.2 & 107.474659329140 & 0.725340670859537 \tabularnewline
35 & 107.1 & 105.907992662474 & 1.19200733752620 \tabularnewline
36 & 108.4 & 106.374659329140 & 2.02534067085954 \tabularnewline
37 & 103.6 & 103.859630503145 & -0.259630503144666 \tabularnewline
38 & 104 & 102.200904088050 & 1.79909591194969 \tabularnewline
39 & 111.5 & 102.759630503145 & 8.74036949685535 \tabularnewline
40 & 105.4 & 103.110809748428 & 2.28919025157233 \tabularnewline
\hline
\end{tabular}
%Source: https://freestatistics.org/blog/index.php?pk=25267&T=4

[TABLE]
[ROW][C]Multiple Linear Regression - Actuals, Interpolation, and Residuals[/C][/ROW]
[ROW][C]Time or Index[/C][C]Actuals[/C][C]InterpolationForecast[/C][C]ResidualsPrediction Error[/C][/ROW]
[ROW][C]1[/C][C]132.7[/C][C]129.940369496855[/C][C]2.75963050314468[/C][/ROW]
[ROW][C]2[/C][C]128.6[/C][C]128.281643081761[/C][C]0.318356918238984[/C][/ROW]
[ROW][C]3[/C][C]127.8[/C][C]128.840369496855[/C][C]-1.04036949685536[/C][/ROW]
[ROW][C]4[/C][C]128.9[/C][C]128.356643081761[/C][C]0.543356918238993[/C][/ROW]
[ROW][C]5[/C][C]124.6[/C][C]123.926912997904[/C][C]0.673087002096431[/C][/ROW]
[ROW][C]6[/C][C]129.2[/C][C]127.060246331237[/C][C]2.13975366876310[/C][/ROW]
[ROW][C]7[/C][C]130.5[/C][C]126.926912997904[/C][C]3.57308700209644[/C][/ROW]
[ROW][C]8[/C][C]124.3[/C][C]124.760246331237[/C][C]-0.4602463312369[/C][/ROW]
[ROW][C]9[/C][C]125.8[/C][C]123.226912997904[/C][C]2.57308700209643[/C][/ROW]
[ROW][C]10[/C][C]123.5[/C][C]123.470309224319[/C][C]0.0296907756813441[/C][/ROW]
[ROW][C]11[/C][C]120.7[/C][C]121.903642557652[/C][C]-1.20364255765199[/C][/ROW]
[ROW][C]12[/C][C]123.1[/C][C]122.370309224319[/C][C]0.729690775681334[/C][/ROW]
[ROW][C]13[/C][C]122[/C][C]120.690186058700[/C][C]1.30981394129978[/C][/ROW]
[ROW][C]14[/C][C]121[/C][C]119.866365303983[/C][C]1.13363469601678[/C][/ROW]
[ROW][C]15[/C][C]121.2[/C][C]119.590186058700[/C][C]1.60981394129979[/C][/ROW]
[ROW][C]16[/C][C]117.4[/C][C]119.106459643606[/C][C]-1.70645964360587[/C][/ROW]
[ROW][C]17[/C][C]113[/C][C]114.676729559748[/C][C]-1.67672955974842[/C][/ROW]
[ROW][C]18[/C][C]113.1[/C][C]117.810062893082[/C][C]-4.71006289308176[/C][/ROW]
[ROW][C]19[/C][C]116.1[/C][C]117.676729559748[/C][C]-1.57672955974843[/C][/ROW]
[ROW][C]20[/C][C]121.3[/C][C]115.510062893082[/C][C]5.78993710691824[/C][/ROW]
[ROW][C]21[/C][C]108.6[/C][C]113.976729559748[/C][C]-5.37672955974843[/C][/ROW]
[ROW][C]22[/C][C]114.3[/C][C]115.055031446541[/C][C]-0.755031446540882[/C][/ROW]
[ROW][C]23[/C][C]113.5[/C][C]113.488364779874[/C][C]0.0116352201257889[/C][/ROW]
[ROW][C]24[/C][C]111.2[/C][C]113.955031446541[/C][C]-2.75503144654088[/C][/ROW]
[ROW][C]25[/C][C]109.3[/C][C]113.109813941300[/C][C]-3.8098139412998[/C][/ROW]
[ROW][C]26[/C][C]108.2[/C][C]111.451087526205[/C][C]-3.25108752620545[/C][/ROW]
[ROW][C]27[/C][C]102.7[/C][C]112.009813941300[/C][C]-9.30981394129979[/C][/ROW]
[ROW][C]28[/C][C]110.4[/C][C]111.526087526205[/C][C]-1.12608752620545[/C][/ROW]
[ROW][C]29[/C][C]108.1[/C][C]107.096357442348[/C][C]1.00364255765199[/C][/ROW]
[ROW][C]30[/C][C]112.8[/C][C]110.229690775681[/C][C]2.57030922431866[/C][/ROW]
[ROW][C]31[/C][C]108.1[/C][C]110.096357442348[/C][C]-1.99635744234801[/C][/ROW]
[ROW][C]32[/C][C]102.6[/C][C]107.929690775681[/C][C]-5.32969077568134[/C][/ROW]
[ROW][C]33[/C][C]109.2[/C][C]106.396357442348[/C][C]2.803642557652[/C][/ROW]
[ROW][C]34[/C][C]108.2[/C][C]107.474659329140[/C][C]0.725340670859537[/C][/ROW]
[ROW][C]35[/C][C]107.1[/C][C]105.907992662474[/C][C]1.19200733752620[/C][/ROW]
[ROW][C]36[/C][C]108.4[/C][C]106.374659329140[/C][C]2.02534067085954[/C][/ROW]
[ROW][C]37[/C][C]103.6[/C][C]103.859630503145[/C][C]-0.259630503144666[/C][/ROW]
[ROW][C]38[/C][C]104[/C][C]102.200904088050[/C][C]1.79909591194969[/C][/ROW]
[ROW][C]39[/C][C]111.5[/C][C]102.759630503145[/C][C]8.74036949685535[/C][/ROW]
[ROW][C]40[/C][C]105.4[/C][C]103.110809748428[/C][C]2.28919025157233[/C][/ROW]
[/TABLE]
Source: https://freestatistics.org/blog/index.php?pk=25267&T=4

Globally Unique Identifier (entire table): ba.freestatistics.org/blog/index.php?pk=25267&T=4

As an alternative you can also use a QR Code:  

The GUIDs for individual cells are displayed in the table below:

Multiple Linear Regression - Actuals, Interpolation, and Residuals
Time or IndexActualsInterpolationForecastResidualsPrediction Error
1132.7129.9403694968552.75963050314468
2128.6128.2816430817610.318356918238984
3127.8128.840369496855-1.04036949685536
4128.9128.3566430817610.543356918238993
5124.6123.9269129979040.673087002096431
6129.2127.0602463312372.13975366876310
7130.5126.9269129979043.57308700209644
8124.3124.760246331237-0.4602463312369
9125.8123.2269129979042.57308700209643
10123.5123.4703092243190.0296907756813441
11120.7121.903642557652-1.20364255765199
12123.1122.3703092243190.729690775681334
13122120.6901860587001.30981394129978
14121119.8663653039831.13363469601678
15121.2119.5901860587001.60981394129979
16117.4119.106459643606-1.70645964360587
17113114.676729559748-1.67672955974842
18113.1117.810062893082-4.71006289308176
19116.1117.676729559748-1.57672955974843
20121.3115.5100628930825.78993710691824
21108.6113.976729559748-5.37672955974843
22114.3115.055031446541-0.755031446540882
23113.5113.4883647798740.0116352201257889
24111.2113.955031446541-2.75503144654088
25109.3113.109813941300-3.8098139412998
26108.2111.451087526205-3.25108752620545
27102.7112.009813941300-9.30981394129979
28110.4111.526087526205-1.12608752620545
29108.1107.0963574423481.00364255765199
30112.8110.2296907756812.57030922431866
31108.1110.096357442348-1.99635744234801
32102.6107.929690775681-5.32969077568134
33109.2106.3963574423482.803642557652
34108.2107.4746593291400.725340670859537
35107.1105.9079926624741.19200733752620
36108.4106.3746593291402.02534067085954
37103.6103.859630503145-0.259630503144666
38104102.2009040880501.79909591194969
39111.5102.7596305031458.74036949685535
40105.4103.1108097484282.28919025157233


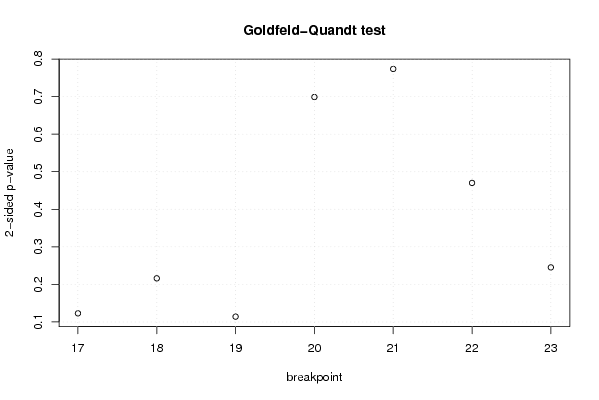
Goldfeld-Quandt test for Heteroskedasticity
p-valuesAlternative Hypothesis
breakpoint indexgreater2-sidedless
170.06150042941379840.1230008588275970.938499570586202
180.1080988124299180.2161976248598360.891901187570082
190.05707783596480640.1141556719296130.942922164035194
200.3494476811219830.6988953622439670.650552318878017
210.3868417247158290.7736834494316580.613158275284171
220.235086268135810.470172536271620.76491373186419
230.1226655612732790.2453311225465580.877334438726721

\begin{tabular}{lllllllll}
\hline
Goldfeld-Quandt test for Heteroskedasticity \tabularnewline
p-values & Alternative Hypothesis \tabularnewline
breakpoint index & greater & 2-sided & less \tabularnewline
17 & 0.0615004294137984 & 0.123000858827597 & 0.938499570586202 \tabularnewline
18 & 0.108098812429918 & 0.216197624859836 & 0.891901187570082 \tabularnewline
19 & 0.0570778359648064 & 0.114155671929613 & 0.942922164035194 \tabularnewline
20 & 0.349447681121983 & 0.698895362243967 & 0.650552318878017 \tabularnewline
21 & 0.386841724715829 & 0.773683449431658 & 0.613158275284171 \tabularnewline
22 & 0.23508626813581 & 0.47017253627162 & 0.76491373186419 \tabularnewline
23 & 0.122665561273279 & 0.245331122546558 & 0.877334438726721 \tabularnewline
\hline
\end{tabular}
%Source: https://freestatistics.org/blog/index.php?pk=25267&T=5

[TABLE]
[ROW][C]Goldfeld-Quandt test for Heteroskedasticity[/C][/ROW]
[ROW][C]p-values[/C][C]Alternative Hypothesis[/C][/ROW]
[ROW][C]breakpoint index[/C][C]greater[/C][C]2-sided[/C][C]less[/C][/ROW]
[ROW][C]17[/C][C]0.0615004294137984[/C][C]0.123000858827597[/C][C]0.938499570586202[/C][/ROW]
[ROW][C]18[/C][C]0.108098812429918[/C][C]0.216197624859836[/C][C]0.891901187570082[/C][/ROW]
[ROW][C]19[/C][C]0.0570778359648064[/C][C]0.114155671929613[/C][C]0.942922164035194[/C][/ROW]
[ROW][C]20[/C][C]0.349447681121983[/C][C]0.698895362243967[/C][C]0.650552318878017[/C][/ROW]
[ROW][C]21[/C][C]0.386841724715829[/C][C]0.773683449431658[/C][C]0.613158275284171[/C][/ROW]
[ROW][C]22[/C][C]0.23508626813581[/C][C]0.47017253627162[/C][C]0.76491373186419[/C][/ROW]
[ROW][C]23[/C][C]0.122665561273279[/C][C]0.245331122546558[/C][C]0.877334438726721[/C][/ROW]
[/TABLE]
Source: https://freestatistics.org/blog/index.php?pk=25267&T=5

Globally Unique Identifier (entire table): ba.freestatistics.org/blog/index.php?pk=25267&T=5

As an alternative you can also use a QR Code:  

The GUIDs for individual cells are displayed in the table below:

Goldfeld-Quandt test for Heteroskedasticity
p-valuesAlternative Hypothesis
breakpoint indexgreater2-sidedless
170.06150042941379840.1230008588275970.938499570586202
180.1080988124299180.2161976248598360.891901187570082
190.05707783596480640.1141556719296130.942922164035194
200.3494476811219830.6988953622439670.650552318878017
210.3868417247158290.7736834494316580.613158275284171
220.235086268135810.470172536271620.76491373186419
230.1226655612732790.2453311225465580.877334438726721


Meta Analysis of Goldfeld-Quandt test for Heteroskedasticity
Description# significant tests% significant testsOK/NOK
1% type I error level00OK
5% type I error level00OK
10% type I error level00OK

\begin{tabular}{lllllllll}
\hline
Meta Analysis of Goldfeld-Quandt test for Heteroskedasticity \tabularnewline
Description & # significant tests & % significant tests & OK/NOK \tabularnewline
1% type I error level & 0 & 0 & OK \tabularnewline
5% type I error level & 0 & 0 & OK \tabularnewline
10% type I error level & 0 & 0 & OK \tabularnewline
\hline
\end{tabular}
%Source: https://freestatistics.org/blog/index.php?pk=25267&T=6

[TABLE]
[ROW][C]Meta Analysis of Goldfeld-Quandt test for Heteroskedasticity[/C][/ROW]
[ROW][C]Description[/C][C]# significant tests[/C][C]% significant tests[/C][C]OK/NOK[/C][/ROW]
[ROW][C]1% type I error level[/C][C]0[/C][C]0[/C][C]OK[/C][/ROW]
[ROW][C]5% type I error level[/C][C]0[/C][C]0[/C][C]OK[/C][/ROW]
[ROW][C]10% type I error level[/C][C]0[/C][C]0[/C][C]OK[/C][/ROW]
[/TABLE]
Source: https://freestatistics.org/blog/index.php?pk=25267&T=6

Globally Unique Identifier (entire table): ba.freestatistics.org/blog/index.php?pk=25267&T=6

As an alternative you can also use a QR Code:  

The GUIDs for individual cells are displayed in the table below:

Meta Analysis of Goldfeld-Quandt test for Heteroskedasticity
Description# significant tests% significant testsOK/NOK
1% type I error level00OK
5% type I error level00OK
10% type I error level00OK


Parameters (Session):
par1 = 1 ; par2 = Include Monthly Dummies ; par3 = Linear Trend ;
Parameters (R input):
par1 = 1 ; par2 = Include Monthly Dummies ; par3 = Linear Trend ;
R code (references can be found in the software module):
library(lattice)
library(lmtest)
n25 <- 25 #minimum number of obs. for Goldfeld-Quandt test
par1 <- as.numeric(par1)
x <- t(y)
k <- length(x[1,])
n <- length(x[,1])
x1 <- cbind(x[,par1], x[,1:k!=par1])
mycolnames <- c(colnames(x)[par1], colnames(x)[1:k!=par1])
colnames(x1) <- mycolnames #colnames(x)[par1]
x <- x1
if (par3 == 'First Differences'){
x2 <- array(0, dim=c(n-1,k), dimnames=list(1:(n-1), paste('(1-B)',colnames(x),sep='')))
for (i in 1:n-1) {
for (j in 1:k) {
x2[i,j] <- x[i+1,j] - x[i,j]
}
}
x <- x2
}
if (par2 == 'Include Monthly Dummies'){
x2 <- array(0, dim=c(n,11), dimnames=list(1:n, paste('M', seq(1:11), sep ='')))
for (i in 1:11){
x2[seq(i,n,12),i] <- 1
}
x <- cbind(x, x2)
}
if (par2 == 'Include Quarterly Dummies'){
x2 <- array(0, dim=c(n,3), dimnames=list(1:n, paste('Q', seq(1:3), sep ='')))
for (i in 1:3){
x2[seq(i,n,4),i] <- 1
}
x <- cbind(x, x2)
}
k <- length(x[1,])
if (par3 == 'Linear Trend'){
x <- cbind(x, c(1:n))
colnames(x)[k+1] <- 't'
}
x
k <- length(x[1,])
df <- as.data.frame(x)
(mylm <- lm(df))
(mysum <- summary(mylm))
if (n > n25) {
kp3 <- k + 3
nmkm3 <- n - k - 3
gqarr <- array(NA, dim=c(nmkm3-kp3+1,3))
numgqtests <- 0
numsignificant1 <- 0
numsignificant5 <- 0
numsignificant10 <- 0
for (mypoint in kp3:nmkm3) {
j <- 0
numgqtests <- numgqtests + 1
for (myalt in c('greater', 'two.sided', 'less')) {
j <- j + 1
gqarr[mypoint-kp3+1,j] <- gqtest(mylm, point=mypoint, alternative=myalt)$p.value
}
if (gqarr[mypoint-kp3+1,2] < 0.01) numsignificant1 <- numsignificant1 + 1
if (gqarr[mypoint-kp3+1,2] < 0.05) numsignificant5 <- numsignificant5 + 1
if (gqarr[mypoint-kp3+1,2] < 0.10) numsignificant10 <- numsignificant10 + 1
}
gqarr
}
bitmap(file='test0.png')
plot(x[,1], type='l', main='Actuals and Interpolation', ylab='value of Actuals and Interpolation (dots)', xlab='time or index')
points(x[,1]-mysum$resid)
grid()
dev.off()
bitmap(file='test1.png')
plot(mysum$resid, type='b', pch=19, main='Residuals', ylab='value of Residuals', xlab='time or index')
grid()
dev.off()
bitmap(file='test2.png')
hist(mysum$resid, main='Residual Histogram', xlab='values of Residuals')
grid()
dev.off()
bitmap(file='test3.png')
densityplot(~mysum$resid,col='black',main='Residual Density Plot', xlab='values of Residuals')
dev.off()
bitmap(file='test4.png')
qqnorm(mysum$resid, main='Residual Normal Q-Q Plot')
qqline(mysum$resid)
grid()
dev.off()
(myerror <- as.ts(mysum$resid))
bitmap(file='test5.png')
dum <- cbind(lag(myerror,k=1),myerror)
dum
dum1 <- dum[2:length(myerror),]
dum1
z <- as.data.frame(dum1)
z
plot(z,main=paste('Residual Lag plot, lowess, and regression line'), ylab='values of Residuals', xlab='lagged values of Residuals')
lines(lowess(z))
abline(lm(z))
grid()
dev.off()
bitmap(file='test6.png')
acf(mysum$resid, lag.max=length(mysum$resid)/2, main='Residual Autocorrelation Function')
grid()
dev.off()
bitmap(file='test7.png')
pacf(mysum$resid, lag.max=length(mysum$resid)/2, main='Residual Partial Autocorrelation Function')
grid()
dev.off()
bitmap(file='test8.png')
opar <- par(mfrow = c(2,2), oma = c(0, 0, 1.1, 0))
plot(mylm, las = 1, sub='Residual Diagnostics')
par(opar)
dev.off()
if (n > n25) {
bitmap(file='test9.png')
plot(kp3:nmkm3,gqarr[,2], main='Goldfeld-Quandt test',ylab='2-sided p-value',xlab='breakpoint')
grid()
dev.off()
}
load(file='createtable')
a<-table.start()
a<-table.row.start(a)
a<-table.element(a, 'Multiple Linear Regression - Estimated Regression Equation', 1, TRUE)
a<-table.row.end(a)
myeq <- colnames(x)[1]
myeq <- paste(myeq, '[t] = ', sep='')
for (i in 1:k){
if (mysum$coefficients[i,1] > 0) myeq <- paste(myeq, '+', '')
myeq <- paste(myeq, mysum$coefficients[i,1], sep=' ')
if (rownames(mysum$coefficients)[i] != '(Intercept)') {
myeq <- paste(myeq, rownames(mysum$coefficients)[i], sep='')
if (rownames(mysum$coefficients)[i] != 't') myeq <- paste(myeq, '[t]', sep='')
}
}
myeq <- paste(myeq, ' + e[t]')
a<-table.row.start(a)
a<-table.element(a, myeq)
a<-table.row.end(a)
a<-table.end(a)
table.save(a,file='mytable1.tab')
a<-table.start()
a<-table.row.start(a)
a<-table.element(a,hyperlink('ols1.htm','Multiple Linear Regression - Ordinary Least Squares',''), 6, TRUE)
a<-table.row.end(a)
a<-table.row.start(a)
a<-table.element(a,'Variable',header=TRUE)
a<-table.element(a,'Parameter',header=TRUE)
a<-table.element(a,'S.D.',header=TRUE)
a<-table.element(a,'T-STAT
H0: parameter = 0',header=TRUE)
a<-table.element(a,'2-tail p-value',header=TRUE)
a<-table.element(a,'1-tail p-value',header=TRUE)
a<-table.row.end(a)
for (i in 1:k){
a<-table.row.start(a)
a<-table.element(a,rownames(mysum$coefficients)[i],header=TRUE)
a<-table.element(a,mysum$coefficients[i,1])
a<-table.element(a, round(mysum$coefficients[i,2],6))
a<-table.element(a, round(mysum$coefficients[i,3],4))
a<-table.element(a, round(mysum$coefficients[i,4],6))
a<-table.element(a, round(mysum$coefficients[i,4]/2,6))
a<-table.row.end(a)
}
a<-table.end(a)
table.save(a,file='mytable2.tab')
a<-table.start()
a<-table.row.start(a)
a<-table.element(a, 'Multiple Linear Regression - Regression Statistics', 2, TRUE)
a<-table.row.end(a)
a<-table.row.start(a)
a<-table.element(a, 'Multiple R',1,TRUE)
a<-table.element(a, sqrt(mysum$r.squared))
a<-table.row.end(a)
a<-table.row.start(a)
a<-table.element(a, 'R-squared',1,TRUE)
a<-table.element(a, mysum$r.squared)
a<-table.row.end(a)
a<-table.row.start(a)
a<-table.element(a, 'Adjusted R-squared',1,TRUE)
a<-table.element(a, mysum$adj.r.squared)
a<-table.row.end(a)
a<-table.row.start(a)
a<-table.element(a, 'F-TEST (value)',1,TRUE)
a<-table.element(a, mysum$fstatistic[1])
a<-table.row.end(a)
a<-table.row.start(a)
a<-table.element(a, 'F-TEST (DF numerator)',1,TRUE)
a<-table.element(a, mysum$fstatistic[2])
a<-table.row.end(a)
a<-table.row.start(a)
a<-table.element(a, 'F-TEST (DF denominator)',1,TRUE)
a<-table.element(a, mysum$fstatistic[3])
a<-table.row.end(a)
a<-table.row.start(a)
a<-table.element(a, 'p-value',1,TRUE)
a<-table.element(a, 1-pf(mysum$fstatistic[1],mysum$fstatistic[2],mysum$fstatistic[3]))
a<-table.row.end(a)
a<-table.row.start(a)
a<-table.element(a, 'Multiple Linear Regression - Residual Statistics', 2, TRUE)
a<-table.row.end(a)
a<-table.row.start(a)
a<-table.element(a, 'Residual Standard Deviation',1,TRUE)
a<-table.element(a, mysum$sigma)
a<-table.row.end(a)
a<-table.row.start(a)
a<-table.element(a, 'Sum Squared Residuals',1,TRUE)
a<-table.element(a, sum(myerror*myerror))
a<-table.row.end(a)
a<-table.end(a)
table.save(a,file='mytable3.tab')
a<-table.start()
a<-table.row.start(a)
a<-table.element(a, 'Multiple Linear Regression - Actuals, Interpolation, and Residuals', 4, TRUE)
a<-table.row.end(a)
a<-table.row.start(a)
a<-table.element(a, 'Time or Index', 1, TRUE)
a<-table.element(a, 'Actuals', 1, TRUE)
a<-table.element(a, 'Interpolation
Forecast', 1, TRUE)
a<-table.element(a, 'Residuals
Prediction Error', 1, TRUE)
a<-table.row.end(a)
for (i in 1:n) {
a<-table.row.start(a)
a<-table.element(a,i, 1, TRUE)
a<-table.element(a,x[i])
a<-table.element(a,x[i]-mysum$resid[i])
a<-table.element(a,mysum$resid[i])
a<-table.row.end(a)
}
a<-table.end(a)
table.save(a,file='mytable4.tab')
if (n > n25) {
a<-table.start()
a<-table.row.start(a)
a<-table.element(a,'Goldfeld-Quandt test for Heteroskedasticity',4,TRUE)
a<-table.row.end(a)
a<-table.row.start(a)
a<-table.element(a,'p-values',header=TRUE)
a<-table.element(a,'Alternative Hypothesis',3,header=TRUE)
a<-table.row.end(a)
a<-table.row.start(a)
a<-table.element(a,'breakpoint index',header=TRUE)
a<-table.element(a,'greater',header=TRUE)
a<-table.element(a,'2-sided',header=TRUE)
a<-table.element(a,'less',header=TRUE)
a<-table.row.end(a)
for (mypoint in kp3:nmkm3) {
a<-table.row.start(a)
a<-table.element(a,mypoint,header=TRUE)
a<-table.element(a,gqarr[mypoint-kp3+1,1])
a<-table.element(a,gqarr[mypoint-kp3+1,2])
a<-table.element(a,gqarr[mypoint-kp3+1,3])
a<-table.row.end(a)
}
a<-table.end(a)
table.save(a,file='mytable5.tab')
a<-table.start()
a<-table.row.start(a)
a<-table.element(a,'Meta Analysis of Goldfeld-Quandt test for Heteroskedasticity',4,TRUE)
a<-table.row.end(a)
a<-table.row.start(a)
a<-table.element(a,'Description',header=TRUE)
a<-table.element(a,'# significant tests',header=TRUE)
a<-table.element(a,'% significant tests',header=TRUE)
a<-table.element(a,'OK/NOK',header=TRUE)
a<-table.row.end(a)
a<-table.row.start(a)
a<-table.element(a,'1% type I error level',header=TRUE)
a<-table.element(a,numsignificant1)
a<-table.element(a,numsignificant1/numgqtests)
if (numsignificant1/numgqtests < 0.01) dum <- 'OK' else dum <- 'NOK'
a<-table.element(a,dum)
a<-table.row.end(a)
a<-table.row.start(a)
a<-table.element(a,'5% type I error level',header=TRUE)
a<-table.element(a,numsignificant5)
a<-table.element(a,numsignificant5/numgqtests)
if (numsignificant5/numgqtests < 0.05) dum <- 'OK' else dum <- 'NOK'
a<-table.element(a,dum)
a<-table.row.end(a)
a<-table.row.start(a)
a<-table.element(a,'10% type I error level',header=TRUE)
a<-table.element(a,numsignificant10)
a<-table.element(a,numsignificant10/numgqtests)
if (numsignificant10/numgqtests < 0.1) dum <- 'OK' else dum <- 'NOK'
a<-table.element(a,dum)
a<-table.row.end(a)
a<-table.end(a)
table.save(a,file='mytable6.tab')
}