Free Statistics

of Irreproducible Research!

Author's title

Author*The author of this computation has been verified*
R Software Modulerwasp_edauni.wasp
Title produced by softwareUnivariate Explorative Data Analysis
Date of computationFri, 21 Nov 2008 03:41:47 -0700
Cite this page as followsStatistical Computations at FreeStatistics.org, Office for Research Development and Education, URL https://freestatistics.org/blog/index.php?v=date/2008/Nov/21/t12272641577t5ipuveqgsxivz.htm/, Retrieved Mon, 20 May 2024 07:47:58 +0000
Statistical Computations at FreeStatistics.org, Office for Research Development and Education, URL https://freestatistics.org/blog/index.php?pk=25106, Retrieved Mon, 20 May 2024 07:47:58 +0000
QR Codes:

Original text written by user:
IsPrivate?No (this computation is public)
User-defined keywords
Estimated Impact185
Family? (F = Feedback message, R = changed R code, M = changed R Module, P = changed Parameters, D = changed Data)
-     [Univariate Explorative Data Analysis] [Taak 6 - Q2 (1)] [2008-11-16 11:01:18] [46c5a5fbda57fdfa1d4ef48658f82a0c]
F    D    [Univariate Explorative Data Analysis] [Q2 (1)] [2008-11-21 10:41:47] [dbfa7caa6871c163dec68ca05d48bb00] [Current]
Feedback Forum
2008-11-25 22:24:20 [Glenn De Maeyer] [reply
We kunnen deze vraag ook oplossen door te kijken naar de link van vraag 1. (Link: http://www.freestatistics.org/blog/index.php?v=date/2008/Nov/24/t1227517244av2qanxbpeaamu7.htm)
Vooreerst kijken we naar de 'adjusted R-squared', deze bedraagt 72%, wat wil zeggen dat we 72% van de schommelingen in het aantal verkeersslachtoffers per maand verklaren met het opgestelde model. Het resterende deel (28%) is te wijten aan uitzonderlijke invloeden (zoals weersomstandigheden, kettingbotsingen, enz.)Het model geeft dus een vrij goed beeld van de werkelijke situatie.
2008-11-30 15:17:14 [Evelyn Ongena] [reply
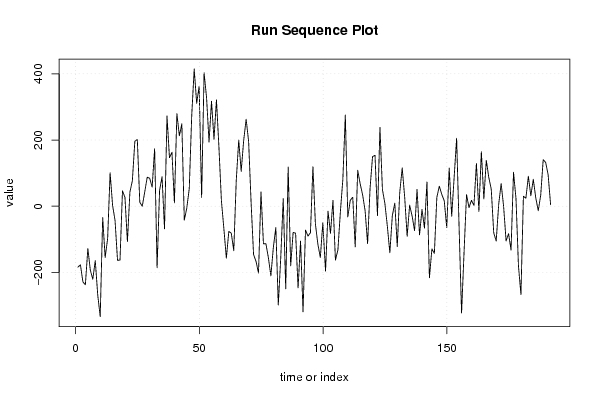
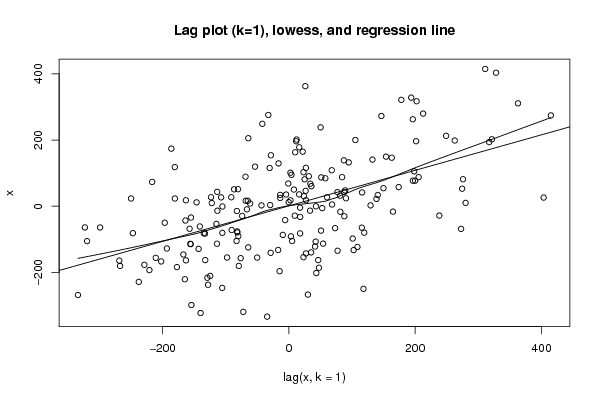
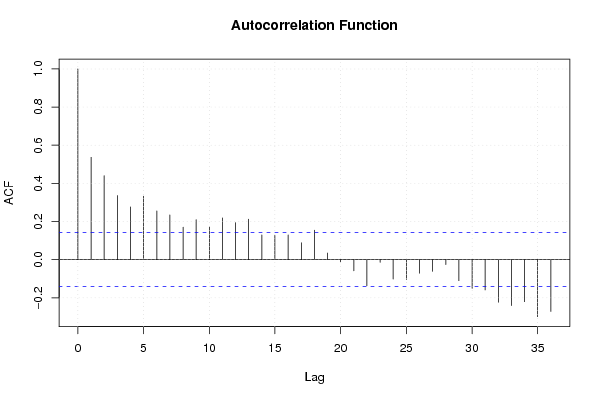
In deze vraag was het belangrijk te kijken naar inderdaad de adjusted R-Squared, waardoor we zo'n 72% van de schommelingen die bestaan in het aantal verkeerslachtoffers kunnen verklaren. Bovendien was het verstandig geweest van de student om ook de seizoenaliteit aan te duiden op de grafiek, dit door de steeds terugkomende pieken. En de student had ook moeten wijze op de plotse daling van het aantal sterfgevallen door het invoeren van de seatbeltlaw op dat moment. Verder was het ook belangrijk om erop te wijzen dat we hier niet te maken hebben met autocorrelatie... Dit is de eerste voorwaarde aan wat moet voldaan worden. De tweede voorwaarde had betrekking op het gemiddelde welke constant en nul moest zijn wat niet het geval was, is af te lezen op de grafiek. Bijgevolg heeft de studente haar conclusie wel juist.
2008-12-01 19:55:59 [4db2e62d895b4fb371d0fef3013b569f] [reply
Het moet duidelijk zijn dat 72% van de ongevallen toe te wijzen is aan dit model, de overige 28% vloeit voort uit andere elementen.

Post a new message
Dataseries X:
-183.9235445
-177.0726091
-228.6351091
-237.4476091
-127.7601091
-193.0101091
-220.6351091
-164.5101091
-268.3226091
-333.6976091
-34.26010911
-154.8851091
-97.74528053
101.1056549
2.543154874
-43.26934513
-163.5818451
-162.8318451
46.54315487
26.66815487
-107.1443451
42.48065487
76.91815487
196.2931549
201.4329835
12.28391886
-0.278581137
42.90891886
87.59641886
84.34641886
57.72141886
173.8464189
-185.9660811
47.65891886
89.09641886
-68.52858114
272.6112475
146.4621829
162.8996829
10.08718285
279.7746829
212.5246829
248.8996829
-41.97531715
-5.787817149
52.83718285
274.2746829
414.6496829
310.7895114
362.6404468
26.07794684
403.2654468
327.9529468
193.7029468
317.0779468
202.2029468
321.3904468
178.0154468
16.45294684
-68.17205316
-157.0322246
-76.18128917
-81.74378917
-134.5562892
77.13121083
199.8812108
105.2562108
198.3812108
262.5687108
196.1937108
11.63121083
-145.9937892
-166.8539606
-202.0030252
43.43447482
-113.3780252
-113.6905252
-155.9405252
-210.5655252
-124.4405252
-64.25302518
-298.6280252
-154.1905252
23.18447482
-249.6756966
118.1752388
-180.3872612
-79.19976119
-81.51226119
-246.7622612
-105.3872612
-319.2622612
-72.07476119
-90.44976119
-80.01226119
119.3627388
-53.49743261
-114.6464972
-155.2089972
-50.02149721
-196.3339972
-14.58399721
-82.20899721
17.91600279
-162.8964972
-132.2714972
-16.83399721
81.54100279
275.6808314
-32.46823322
17.96926678
27.15676678
-123.1557332
108.5942668
67.96926678
34.09426678
-13.71823322
-113.0932332
54.34426678
149.7192668
153.8590954
-28.28996923
238.1475308
50.33503077
8.022530771
-61.22746923
-140.8524692
-28.72746923
9.460030771
-121.9149692
41.52253077
115.8975308
27.03735936
-91.11170524
3.325794759
-29.48670524
-73.79920524
50.95079476
-86.67420524
-9.54920524
-66.36170524
73.26329476
-216.2992052
-128.9242052
-142.7843767
27.06655875
60.50405875
35.69155875
16.37905875
-64.87094125
115.5040587
-30.37094125
87.81655875
205.4415587
-64.12094125
-322.7459413
-139.6061127
35.24482274
-4.317677263
17.86982274
2.557322737
129.3073227
-16.31767726
164.8073227
21.99482274
138.6198227
87.05732274
51.43232274
-80.42784867
-105.1918797
5.245620328
68.43312033
-0.879379672
-105.1293797
-82.75437967
-132.6293797
102.5581203
23.18312033
-180.3793797
-267.0043797
30.13544892
23.98638432
90.42388432
31.61138432
81.29888432
25.04888432
-13.57611568
33.54888432
140.7363843
132.3613843
94.79888432
4.173884316


Summary of computational transaction
Raw Inputview raw input (R code)
Raw Outputview raw output of R engine
Computing time5 seconds
R Server'Herman Ole Andreas Wold' @ 193.190.124.10:1001

\begin{tabular}{lllllllll}
\hline
Summary of computational transaction \tabularnewline
Raw Input & view raw input (R code)  \tabularnewline
Raw Output & view raw output of R engine  \tabularnewline
Computing time & 5 seconds \tabularnewline
R Server & 'Herman Ole Andreas Wold' @ 193.190.124.10:1001 \tabularnewline
\hline
\end{tabular}
%Source: https://freestatistics.org/blog/index.php?pk=25106&T=0

[TABLE]
[ROW][C]Summary of computational transaction[/C][/ROW]
[ROW][C]Raw Input[/C][C]view raw input (R code) [/C][/ROW]
[ROW][C]Raw Output[/C][C]view raw output of R engine [/C][/ROW]
[ROW][C]Computing time[/C][C]5 seconds[/C][/ROW]
[ROW][C]R Server[/C][C]'Herman Ole Andreas Wold' @ 193.190.124.10:1001[/C][/ROW]
[/TABLE]
Source: https://freestatistics.org/blog/index.php?pk=25106&T=0

Globally Unique Identifier (entire table): ba.freestatistics.org/blog/index.php?pk=25106&T=0

As an alternative you can also use a QR Code:  

The GUIDs for individual cells are displayed in the table below:

Summary of computational transaction
Raw Inputview raw input (R code)
Raw Outputview raw output of R engine
Computing time5 seconds
R Server'Herman Ole Andreas Wold' @ 193.190.124.10:1001


Descriptive Statistics
# observations192
minimum-333.6976091
Q1-105.826532175
median4.709752322
mean-8.0729257479187e-10
Q385.02414483
maximum414.6496829

\begin{tabular}{lllllllll}
\hline
Descriptive Statistics \tabularnewline
# observations & 192 \tabularnewline
minimum & -333.6976091 \tabularnewline
Q1 & -105.826532175 \tabularnewline
median & 4.709752322 \tabularnewline
mean & -8.0729257479187e-10 \tabularnewline
Q3 & 85.02414483 \tabularnewline
maximum & 414.6496829 \tabularnewline
\hline
\end{tabular}
%Source: https://freestatistics.org/blog/index.php?pk=25106&T=1

[TABLE]
[ROW][C]Descriptive Statistics[/C][/ROW]
[ROW][C]# observations[/C][C]192[/C][/ROW]
[ROW][C]minimum[/C][C]-333.6976091[/C][/ROW]
[ROW][C]Q1[/C][C]-105.826532175[/C][/ROW]
[ROW][C]median[/C][C]4.709752322[/C][/ROW]
[ROW][C]mean[/C][C]-8.0729257479187e-10[/C][/ROW]
[ROW][C]Q3[/C][C]85.02414483[/C][/ROW]
[ROW][C]maximum[/C][C]414.6496829[/C][/ROW]
[/TABLE]
Source: https://freestatistics.org/blog/index.php?pk=25106&T=1

Globally Unique Identifier (entire table): ba.freestatistics.org/blog/index.php?pk=25106&T=1

As an alternative you can also use a QR Code:  

The GUIDs for individual cells are displayed in the table below:

Descriptive Statistics
# observations192
minimum-333.6976091
Q1-105.826532175
median4.709752322
mean-8.0729257479187e-10
Q385.02414483
maximum414.6496829


Parameters (Session):
par1 = 0 ; par2 = 36 ;
Parameters (R input):
par1 = 0 ; par2 = 36 ;
R code (references can be found in the software module):
par1 <- as.numeric(par1)
par2 <- as.numeric(par2)
x <- as.ts(x)
library(lattice)
bitmap(file='pic1.png')
plot(x,type='l',main='Run Sequence Plot',xlab='time or index',ylab='value')
grid()
dev.off()
bitmap(file='pic2.png')
hist(x)
grid()
dev.off()
bitmap(file='pic3.png')
if (par1 > 0)
{
densityplot(~x,col='black',main=paste('Density Plot bw = ',par1),bw=par1)
} else {
densityplot(~x,col='black',main='Density Plot')
}
dev.off()
bitmap(file='pic4.png')
qqnorm(x)
qqline(x)
grid()
dev.off()
if (par2 > 0)
{
bitmap(file='lagplot1.png')
dum <- cbind(lag(x,k=1),x)
dum
dum1 <- dum[2:length(x),]
dum1
z <- as.data.frame(dum1)
z
plot(z,main='Lag plot (k=1), lowess, and regression line')
lines(lowess(z))
abline(lm(z))
dev.off()
if (par2 > 1) {
bitmap(file='lagplotpar2.png')
dum <- cbind(lag(x,k=par2),x)
dum
dum1 <- dum[(par2+1):length(x),]
dum1
z <- as.data.frame(dum1)
z
mylagtitle <- 'Lag plot (k='
mylagtitle <- paste(mylagtitle,par2,sep='')
mylagtitle <- paste(mylagtitle,'), and lowess',sep='')
plot(z,main=mylagtitle)
lines(lowess(z))
dev.off()
}
bitmap(file='pic5.png')
acf(x,lag.max=par2,main='Autocorrelation Function')
grid()
dev.off()
}
summary(x)
load(file='createtable')
a<-table.start()
a<-table.row.start(a)
a<-table.element(a,'Descriptive Statistics',2,TRUE)
a<-table.row.end(a)
a<-table.row.start(a)
a<-table.element(a,'# observations',header=TRUE)
a<-table.element(a,length(x))
a<-table.row.end(a)
a<-table.row.start(a)
a<-table.element(a,'minimum',header=TRUE)
a<-table.element(a,min(x))
a<-table.row.end(a)
a<-table.row.start(a)
a<-table.element(a,'Q1',header=TRUE)
a<-table.element(a,quantile(x,0.25))
a<-table.row.end(a)
a<-table.row.start(a)
a<-table.element(a,'median',header=TRUE)
a<-table.element(a,median(x))
a<-table.row.end(a)
a<-table.row.start(a)
a<-table.element(a,'mean',header=TRUE)
a<-table.element(a,mean(x))
a<-table.row.end(a)
a<-table.row.start(a)
a<-table.element(a,'Q3',header=TRUE)
a<-table.element(a,quantile(x,0.75))
a<-table.row.end(a)
a<-table.row.start(a)
a<-table.element(a,'maximum',header=TRUE)
a<-table.element(a,max(x))
a<-table.row.end(a)
a<-table.end(a)
table.save(a,file='mytable.tab')