Free Statistics

of Irreproducible Research!

Author's title

Author*The author of this computation has been verified*
R Software Modulerwasp_multipleregression.wasp
Title produced by softwareMultiple Regression
Date of computationWed, 19 Nov 2008 07:12:05 -0700
Cite this page as followsStatistical Computations at FreeStatistics.org, Office for Research Development and Education, URL https://freestatistics.org/blog/index.php?v=date/2008/Nov/19/t1227104086n1dtxo3hyy5oj4e.htm/, Retrieved Mon, 29 Apr 2024 11:54:56 +0000
Statistical Computations at FreeStatistics.org, Office for Research Development and Education, URL https://freestatistics.org/blog/index.php?pk=25037, Retrieved Mon, 29 Apr 2024 11:54:56 +0000
QR Codes:

Original text written by user:
IsPrivate?No (this computation is public)
User-defined keywords
Estimated Impact252
Family? (F = Feedback message, R = changed R code, M = changed R Module, P = changed Parameters, D = changed Data)
-     [Multiple Regression] [Q1 The Seatbeltlaw] [2007-11-14 19:27:43] [8cd6641b921d30ebe00b648d1481bba0]
F    D  [Multiple Regression] [The Seatbelt Law ...] [2008-11-15 12:00:57] [93834488277b53a4510bfd06084ae13b]
-   PD    [Multiple Regression] [] [2008-11-15 18:50:27] [93834488277b53a4510bfd06084ae13b]
F    D        [Multiple Regression] [q3 ] [2008-11-19 14:12:05] [1aceffc2fa350402d9e8f8edd757a2e8] [Current]
F   P           [Multiple Regression] [q3 dummie+trend] [2008-11-19 14:18:31] [44a98561a4b3e6ab8cd5a857b48b0914]
Feedback Forum
2008-11-30 11:47:13 [Koen De Winter] [reply
Q3: Een goed berekende oplossing, vast en zeker. De verklaring die je geeft aan de uitkomst is wat minder. Ik begrijp dit wel, want het is geen gemakkelijke opgave.

Je hebt voor de moeilijke weg gekozen wat betreft de variabelen. In de opgave stond tussen de hints de terroristische aanslag op de WTC torens bij. Deze mag dan meer voor de hand liggen maar is volgens mij wel een veel betere variabele dan de faillissementen van luchtvaartmaatschappijen. De faillissementen zijn een gevolg van de terroristische aanslag. Daarom lijkt het mij beter dat je een vergelijking had gemaakt tussen 9/11 en het algemene consumentenvertrouwen. De faillissementen zijn slechts een tussenstap.

Daarbovenop zijn de faillismenten veel uitgebreider in tijd dan 9/11. Zij geven het consumentenvertrouwen niet die plotse knik, die de terroristische aanslag gaf.

Nog één laatste opmerking. De link in je document klopt niet. Je geblogde uitwerking op freestatistics komt niet overeen met je oplossing in je document. Waarschijnlijk was dit een misverstand. Hetzelfde geldt ook voor de link die zou moeten verwijzen naar de berekening met seasonal dummies en een lineaire trend.

Begrijp me niet verkeerd, je hebt mooi werk geleverd.
2008-11-30 12:25:27 [Koen De Winter] [reply
Q3 en Q4: Ik vind nergens de begindatum en einddatum van je tijdreeks terug. Sluiten de gegevens van Q4 aan op die van Q3?

Post a new message
Dataseries X:
3.4	1
3	1
3.1	1
2.5	0
2.2	0
2.3	0
2.1	0
2.8	0
3.1	1
2.9	0
2.6	0
2.7	0
2.3	0
2.3	0
2.1	0
2.2	0
2.9	0
2.6	0
2.7	0
1.8	0
1.3	0
0.9	0
1.3	0
1.3	0
1.3	0
1.3	0
1.1	0
1.4	0
1.2	0
1.7	0
1.8	0
1.5	0
1	0
1.6	0
1.5	0
1.8	0
1.8	0
1.6	0
1.9	0
1.7	0
1.6	0
1.3	0
1.1	0
1.9	0
2.6	0
2.3	0
2.4	0
2.2	0
2	0
2.9	0
2.6	0
2.3	0
2.3	0
2.6	0
3.1	1
2.8	0
2.5	0
2.9	0
3.1	1
3.1	1
3.2	1
2.5	0
2.6	0
2.9	0
2.6	0
2.4	0
1.7	0
2	0
2.2	0
1.9	0
1.6	0
1.6	0
1.2	0
1.2	0
1.5	0
1.6	0
1.7	0
1.8	0
1.8	0
1.8	0
1.3	0
1.3	0
1.4	0
1.1	0
1.5	0
2.2	0
2.9	0
3.1	1
3.5	1
3.6	1
4.4	1
4.2	1
5.2	1
5.8	1


Summary of computational transaction
Raw Inputview raw input (R code)
Raw Outputview raw output of R engine
Computing time2 seconds
R Server'George Udny Yule' @ 72.249.76.132

\begin{tabular}{lllllllll}
\hline
Summary of computational transaction \tabularnewline
Raw Input & view raw input (R code)  \tabularnewline
Raw Output & view raw output of R engine  \tabularnewline
Computing time & 2 seconds \tabularnewline
R Server & 'George Udny Yule' @ 72.249.76.132 \tabularnewline
\hline
\end{tabular}
%Source: https://freestatistics.org/blog/index.php?pk=25037&T=0

[TABLE]
[ROW][C]Summary of computational transaction[/C][/ROW]
[ROW][C]Raw Input[/C][C]view raw input (R code) [/C][/ROW]
[ROW][C]Raw Output[/C][C]view raw output of R engine [/C][/ROW]
[ROW][C]Computing time[/C][C]2 seconds[/C][/ROW]
[ROW][C]R Server[/C][C]'George Udny Yule' @ 72.249.76.132[/C][/ROW]
[/TABLE]
Source: https://freestatistics.org/blog/index.php?pk=25037&T=0

Globally Unique Identifier (entire table): ba.freestatistics.org/blog/index.php?pk=25037&T=0

As an alternative you can also use a QR Code:  

The GUIDs for individual cells are displayed in the table below:

Summary of computational transaction
Raw Inputview raw input (R code)
Raw Outputview raw output of R engine
Computing time2 seconds
R Server'George Udny Yule' @ 72.249.76.132


Multiple Linear Regression - Estimated Regression Equation
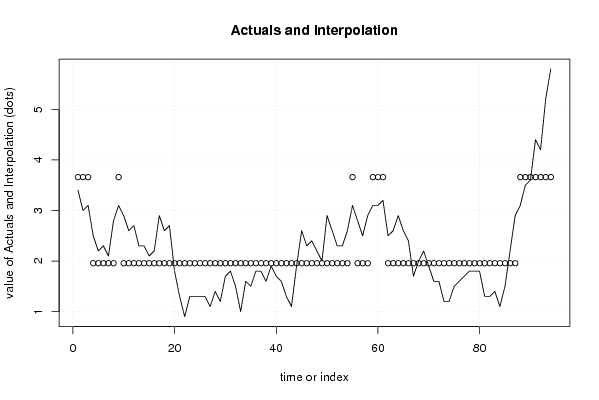
Consumptieprijsindex[t] = + 1.95696202531645 + 1.70303797468354Dumivariabele[t] + e[t]

\begin{tabular}{lllllllll}
\hline
Multiple Linear Regression - Estimated Regression Equation \tabularnewline
Consumptieprijsindex[t] =  +  1.95696202531645 +  1.70303797468354Dumivariabele[t]  + e[t] \tabularnewline
\hline
\end{tabular}
%Source: https://freestatistics.org/blog/index.php?pk=25037&T=1

[TABLE]
[ROW][C]Multiple Linear Regression - Estimated Regression Equation[/C][/ROW]
[ROW][C]Consumptieprijsindex[t] =  +  1.95696202531645 +  1.70303797468354Dumivariabele[t]  + e[t][/C][/ROW]
[/TABLE]
Source: https://freestatistics.org/blog/index.php?pk=25037&T=1

Globally Unique Identifier (entire table): ba.freestatistics.org/blog/index.php?pk=25037&T=1

As an alternative you can also use a QR Code:  

The GUIDs for individual cells are displayed in the table below:

Multiple Linear Regression - Estimated Regression Equation
Consumptieprijsindex[t] = + 1.95696202531645 + 1.70303797468354Dumivariabele[t] + e[t]


Multiple Linear Regression - Ordinary Least Squares
VariableParameterS.D.T-STATH0: parameter = 02-tail p-value1-tail p-value
(Intercept)1.956962025316450.06995727.973700
Dumivariabele1.703037974683540.1751269.724600

\begin{tabular}{lllllllll}
\hline
Multiple Linear Regression - Ordinary Least Squares \tabularnewline
Variable & Parameter & S.D. & T-STATH0: parameter = 0 & 2-tail p-value & 1-tail p-value \tabularnewline
(Intercept) & 1.95696202531645 & 0.069957 & 27.9737 & 0 & 0 \tabularnewline
Dumivariabele & 1.70303797468354 & 0.175126 & 9.7246 & 0 & 0 \tabularnewline
\hline
\end{tabular}
%Source: https://freestatistics.org/blog/index.php?pk=25037&T=2

[TABLE]
[ROW][C]Multiple Linear Regression - Ordinary Least Squares[/C][/ROW]
[ROW][C]Variable[/C][C]Parameter[/C][C]S.D.[/C][C]T-STATH0: parameter = 0[/C][C]2-tail p-value[/C][C]1-tail p-value[/C][/ROW]
[ROW][C](Intercept)[/C][C]1.95696202531645[/C][C]0.069957[/C][C]27.9737[/C][C]0[/C][C]0[/C][/ROW]
[ROW][C]Dumivariabele[/C][C]1.70303797468354[/C][C]0.175126[/C][C]9.7246[/C][C]0[/C][C]0[/C][/ROW]
[/TABLE]
Source: https://freestatistics.org/blog/index.php?pk=25037&T=2

Globally Unique Identifier (entire table): ba.freestatistics.org/blog/index.php?pk=25037&T=2

As an alternative you can also use a QR Code:  

The GUIDs for individual cells are displayed in the table below:

Multiple Linear Regression - Ordinary Least Squares
VariableParameterS.D.T-STATH0: parameter = 02-tail p-value1-tail p-value
(Intercept)1.956962025316450.06995727.973700
Dumivariabele1.703037974683540.1751269.724600


Multiple Linear Regression - Regression Statistics
Multiple R0.711957793377351
R-squared0.506883899550747
Adjusted R-squared0.501523941937168
F-TEST (value)94.568639547935
F-TEST (DF numerator)1
F-TEST (DF denominator)92
p-value8.88178419700125e-16
Multiple Linear Regression - Residual Statistics
Residual Standard Deviation0.621793259417748
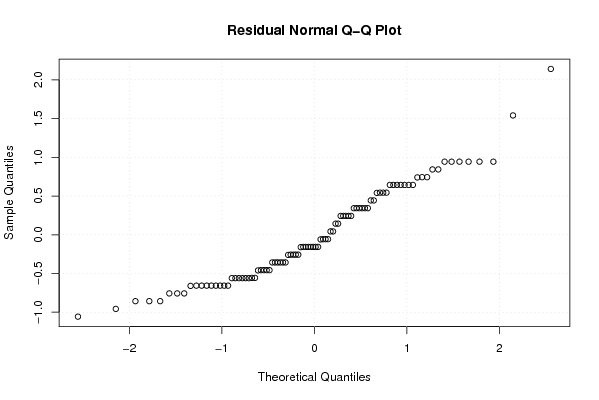
Sum Squared Residuals35.5696708860760

\begin{tabular}{lllllllll}
\hline
Multiple Linear Regression - Regression Statistics \tabularnewline
Multiple R & 0.711957793377351 \tabularnewline
R-squared & 0.506883899550747 \tabularnewline
Adjusted R-squared & 0.501523941937168 \tabularnewline
F-TEST (value) & 94.568639547935 \tabularnewline
F-TEST (DF numerator) & 1 \tabularnewline
F-TEST (DF denominator) & 92 \tabularnewline
p-value & 8.88178419700125e-16 \tabularnewline
Multiple Linear Regression - Residual Statistics \tabularnewline
Residual Standard Deviation & 0.621793259417748 \tabularnewline
Sum Squared Residuals & 35.5696708860760 \tabularnewline
\hline
\end{tabular}
%Source: https://freestatistics.org/blog/index.php?pk=25037&T=3

[TABLE]
[ROW][C]Multiple Linear Regression - Regression Statistics[/C][/ROW]
[ROW][C]Multiple R[/C][C]0.711957793377351[/C][/ROW]
[ROW][C]R-squared[/C][C]0.506883899550747[/C][/ROW]
[ROW][C]Adjusted R-squared[/C][C]0.501523941937168[/C][/ROW]
[ROW][C]F-TEST (value)[/C][C]94.568639547935[/C][/ROW]
[ROW][C]F-TEST (DF numerator)[/C][C]1[/C][/ROW]
[ROW][C]F-TEST (DF denominator)[/C][C]92[/C][/ROW]
[ROW][C]p-value[/C][C]8.88178419700125e-16[/C][/ROW]
[ROW][C]Multiple Linear Regression - Residual Statistics[/C][/ROW]
[ROW][C]Residual Standard Deviation[/C][C]0.621793259417748[/C][/ROW]
[ROW][C]Sum Squared Residuals[/C][C]35.5696708860760[/C][/ROW]
[/TABLE]
Source: https://freestatistics.org/blog/index.php?pk=25037&T=3

Globally Unique Identifier (entire table): ba.freestatistics.org/blog/index.php?pk=25037&T=3

As an alternative you can also use a QR Code:  

The GUIDs for individual cells are displayed in the table below:

Multiple Linear Regression - Regression Statistics
Multiple R0.711957793377351
R-squared0.506883899550747
Adjusted R-squared0.501523941937168
F-TEST (value)94.568639547935
F-TEST (DF numerator)1
F-TEST (DF denominator)92
p-value8.88178419700125e-16
Multiple Linear Regression - Residual Statistics
Residual Standard Deviation0.621793259417748
Sum Squared Residuals35.5696708860760


Multiple Linear Regression - Actuals, Interpolation, and Residuals
Time or IndexActualsInterpolationForecastResidualsPrediction Error
13.43.66000000000001-0.260000000000011
233.66-0.659999999999999
33.13.66-0.559999999999999
42.51.956962025316460.543037974683544
52.21.956962025316460.243037974683544
62.31.956962025316460.343037974683544
72.11.956962025316460.143037974683544
82.81.956962025316460.843037974683544
93.13.66-0.559999999999999
102.91.956962025316460.943037974683544
112.61.956962025316460.643037974683544
122.71.956962025316460.743037974683544
132.31.956962025316460.343037974683544
142.31.956962025316460.343037974683544
152.11.956962025316460.143037974683544
162.21.956962025316460.243037974683544
172.91.956962025316460.943037974683544
182.61.956962025316460.643037974683544
192.71.956962025316460.743037974683544
201.81.95696202531646-0.156962025316456
211.31.95696202531646-0.656962025316456
220.91.95696202531646-1.05696202531646
231.31.95696202531646-0.656962025316456
241.31.95696202531646-0.656962025316456
251.31.95696202531646-0.656962025316456
261.31.95696202531646-0.656962025316456
271.11.95696202531646-0.856962025316456
281.41.95696202531646-0.556962025316456
291.21.95696202531646-0.756962025316456
301.71.95696202531646-0.256962025316456
311.81.95696202531646-0.156962025316456
321.51.95696202531646-0.456962025316456
3311.95696202531646-0.956962025316456
341.61.95696202531646-0.356962025316456
351.51.95696202531646-0.456962025316456
361.81.95696202531646-0.156962025316456
371.81.95696202531646-0.156962025316456
381.61.95696202531646-0.356962025316456
391.91.95696202531646-0.0569620253164558
401.71.95696202531646-0.256962025316456
411.61.95696202531646-0.356962025316456
421.31.95696202531646-0.656962025316456
431.11.95696202531646-0.856962025316456
441.91.95696202531646-0.0569620253164558
452.61.956962025316460.643037974683544
462.31.956962025316460.343037974683544
472.41.956962025316460.443037974683544
482.21.956962025316460.243037974683544
4921.956962025316460.0430379746835443
502.91.956962025316460.943037974683544
512.61.956962025316460.643037974683544
522.31.956962025316460.343037974683544
532.31.956962025316460.343037974683544
542.61.956962025316460.643037974683544
553.13.66-0.559999999999999
562.81.956962025316460.843037974683544
572.51.956962025316460.543037974683544
582.91.956962025316460.943037974683544
593.13.66-0.559999999999999
603.13.66-0.559999999999999
613.23.66-0.459999999999999
622.51.956962025316460.543037974683544
632.61.956962025316460.643037974683544
642.91.956962025316460.943037974683544
652.61.956962025316460.643037974683544
662.41.956962025316460.443037974683544
671.71.95696202531646-0.256962025316456
6821.956962025316460.0430379746835443
692.21.956962025316460.243037974683544
701.91.95696202531646-0.0569620253164558
711.61.95696202531646-0.356962025316456
721.61.95696202531646-0.356962025316456
731.21.95696202531646-0.756962025316456
741.21.95696202531646-0.756962025316456
751.51.95696202531646-0.456962025316456
761.61.95696202531646-0.356962025316456
771.71.95696202531646-0.256962025316456
781.81.95696202531646-0.156962025316456
791.81.95696202531646-0.156962025316456
801.81.95696202531646-0.156962025316456
811.31.95696202531646-0.656962025316456
821.31.95696202531646-0.656962025316456
831.41.95696202531646-0.556962025316456
841.11.95696202531646-0.856962025316456
851.51.95696202531646-0.456962025316456
862.21.956962025316460.243037974683544
872.91.956962025316460.943037974683544
883.13.66-0.559999999999999
893.53.66-0.159999999999999
903.63.66-0.0599999999999992
914.43.660.740000000000001
924.23.660.540000000000001
935.23.661.54
945.83.662.14

\begin{tabular}{lllllllll}
\hline
Multiple Linear Regression - Actuals, Interpolation, and Residuals \tabularnewline
Time or Index & Actuals & InterpolationForecast & ResidualsPrediction Error \tabularnewline
1 & 3.4 & 3.66000000000001 & -0.260000000000011 \tabularnewline
2 & 3 & 3.66 & -0.659999999999999 \tabularnewline
3 & 3.1 & 3.66 & -0.559999999999999 \tabularnewline
4 & 2.5 & 1.95696202531646 & 0.543037974683544 \tabularnewline
5 & 2.2 & 1.95696202531646 & 0.243037974683544 \tabularnewline
6 & 2.3 & 1.95696202531646 & 0.343037974683544 \tabularnewline
7 & 2.1 & 1.95696202531646 & 0.143037974683544 \tabularnewline
8 & 2.8 & 1.95696202531646 & 0.843037974683544 \tabularnewline
9 & 3.1 & 3.66 & -0.559999999999999 \tabularnewline
10 & 2.9 & 1.95696202531646 & 0.943037974683544 \tabularnewline
11 & 2.6 & 1.95696202531646 & 0.643037974683544 \tabularnewline
12 & 2.7 & 1.95696202531646 & 0.743037974683544 \tabularnewline
13 & 2.3 & 1.95696202531646 & 0.343037974683544 \tabularnewline
14 & 2.3 & 1.95696202531646 & 0.343037974683544 \tabularnewline
15 & 2.1 & 1.95696202531646 & 0.143037974683544 \tabularnewline
16 & 2.2 & 1.95696202531646 & 0.243037974683544 \tabularnewline
17 & 2.9 & 1.95696202531646 & 0.943037974683544 \tabularnewline
18 & 2.6 & 1.95696202531646 & 0.643037974683544 \tabularnewline
19 & 2.7 & 1.95696202531646 & 0.743037974683544 \tabularnewline
20 & 1.8 & 1.95696202531646 & -0.156962025316456 \tabularnewline
21 & 1.3 & 1.95696202531646 & -0.656962025316456 \tabularnewline
22 & 0.9 & 1.95696202531646 & -1.05696202531646 \tabularnewline
23 & 1.3 & 1.95696202531646 & -0.656962025316456 \tabularnewline
24 & 1.3 & 1.95696202531646 & -0.656962025316456 \tabularnewline
25 & 1.3 & 1.95696202531646 & -0.656962025316456 \tabularnewline
26 & 1.3 & 1.95696202531646 & -0.656962025316456 \tabularnewline
27 & 1.1 & 1.95696202531646 & -0.856962025316456 \tabularnewline
28 & 1.4 & 1.95696202531646 & -0.556962025316456 \tabularnewline
29 & 1.2 & 1.95696202531646 & -0.756962025316456 \tabularnewline
30 & 1.7 & 1.95696202531646 & -0.256962025316456 \tabularnewline
31 & 1.8 & 1.95696202531646 & -0.156962025316456 \tabularnewline
32 & 1.5 & 1.95696202531646 & -0.456962025316456 \tabularnewline
33 & 1 & 1.95696202531646 & -0.956962025316456 \tabularnewline
34 & 1.6 & 1.95696202531646 & -0.356962025316456 \tabularnewline
35 & 1.5 & 1.95696202531646 & -0.456962025316456 \tabularnewline
36 & 1.8 & 1.95696202531646 & -0.156962025316456 \tabularnewline
37 & 1.8 & 1.95696202531646 & -0.156962025316456 \tabularnewline
38 & 1.6 & 1.95696202531646 & -0.356962025316456 \tabularnewline
39 & 1.9 & 1.95696202531646 & -0.0569620253164558 \tabularnewline
40 & 1.7 & 1.95696202531646 & -0.256962025316456 \tabularnewline
41 & 1.6 & 1.95696202531646 & -0.356962025316456 \tabularnewline
42 & 1.3 & 1.95696202531646 & -0.656962025316456 \tabularnewline
43 & 1.1 & 1.95696202531646 & -0.856962025316456 \tabularnewline
44 & 1.9 & 1.95696202531646 & -0.0569620253164558 \tabularnewline
45 & 2.6 & 1.95696202531646 & 0.643037974683544 \tabularnewline
46 & 2.3 & 1.95696202531646 & 0.343037974683544 \tabularnewline
47 & 2.4 & 1.95696202531646 & 0.443037974683544 \tabularnewline
48 & 2.2 & 1.95696202531646 & 0.243037974683544 \tabularnewline
49 & 2 & 1.95696202531646 & 0.0430379746835443 \tabularnewline
50 & 2.9 & 1.95696202531646 & 0.943037974683544 \tabularnewline
51 & 2.6 & 1.95696202531646 & 0.643037974683544 \tabularnewline
52 & 2.3 & 1.95696202531646 & 0.343037974683544 \tabularnewline
53 & 2.3 & 1.95696202531646 & 0.343037974683544 \tabularnewline
54 & 2.6 & 1.95696202531646 & 0.643037974683544 \tabularnewline
55 & 3.1 & 3.66 & -0.559999999999999 \tabularnewline
56 & 2.8 & 1.95696202531646 & 0.843037974683544 \tabularnewline
57 & 2.5 & 1.95696202531646 & 0.543037974683544 \tabularnewline
58 & 2.9 & 1.95696202531646 & 0.943037974683544 \tabularnewline
59 & 3.1 & 3.66 & -0.559999999999999 \tabularnewline
60 & 3.1 & 3.66 & -0.559999999999999 \tabularnewline
61 & 3.2 & 3.66 & -0.459999999999999 \tabularnewline
62 & 2.5 & 1.95696202531646 & 0.543037974683544 \tabularnewline
63 & 2.6 & 1.95696202531646 & 0.643037974683544 \tabularnewline
64 & 2.9 & 1.95696202531646 & 0.943037974683544 \tabularnewline
65 & 2.6 & 1.95696202531646 & 0.643037974683544 \tabularnewline
66 & 2.4 & 1.95696202531646 & 0.443037974683544 \tabularnewline
67 & 1.7 & 1.95696202531646 & -0.256962025316456 \tabularnewline
68 & 2 & 1.95696202531646 & 0.0430379746835443 \tabularnewline
69 & 2.2 & 1.95696202531646 & 0.243037974683544 \tabularnewline
70 & 1.9 & 1.95696202531646 & -0.0569620253164558 \tabularnewline
71 & 1.6 & 1.95696202531646 & -0.356962025316456 \tabularnewline
72 & 1.6 & 1.95696202531646 & -0.356962025316456 \tabularnewline
73 & 1.2 & 1.95696202531646 & -0.756962025316456 \tabularnewline
74 & 1.2 & 1.95696202531646 & -0.756962025316456 \tabularnewline
75 & 1.5 & 1.95696202531646 & -0.456962025316456 \tabularnewline
76 & 1.6 & 1.95696202531646 & -0.356962025316456 \tabularnewline
77 & 1.7 & 1.95696202531646 & -0.256962025316456 \tabularnewline
78 & 1.8 & 1.95696202531646 & -0.156962025316456 \tabularnewline
79 & 1.8 & 1.95696202531646 & -0.156962025316456 \tabularnewline
80 & 1.8 & 1.95696202531646 & -0.156962025316456 \tabularnewline
81 & 1.3 & 1.95696202531646 & -0.656962025316456 \tabularnewline
82 & 1.3 & 1.95696202531646 & -0.656962025316456 \tabularnewline
83 & 1.4 & 1.95696202531646 & -0.556962025316456 \tabularnewline
84 & 1.1 & 1.95696202531646 & -0.856962025316456 \tabularnewline
85 & 1.5 & 1.95696202531646 & -0.456962025316456 \tabularnewline
86 & 2.2 & 1.95696202531646 & 0.243037974683544 \tabularnewline
87 & 2.9 & 1.95696202531646 & 0.943037974683544 \tabularnewline
88 & 3.1 & 3.66 & -0.559999999999999 \tabularnewline
89 & 3.5 & 3.66 & -0.159999999999999 \tabularnewline
90 & 3.6 & 3.66 & -0.0599999999999992 \tabularnewline
91 & 4.4 & 3.66 & 0.740000000000001 \tabularnewline
92 & 4.2 & 3.66 & 0.540000000000001 \tabularnewline
93 & 5.2 & 3.66 & 1.54 \tabularnewline
94 & 5.8 & 3.66 & 2.14 \tabularnewline
\hline
\end{tabular}
%Source: https://freestatistics.org/blog/index.php?pk=25037&T=4

[TABLE]
[ROW][C]Multiple Linear Regression - Actuals, Interpolation, and Residuals[/C][/ROW]
[ROW][C]Time or Index[/C][C]Actuals[/C][C]InterpolationForecast[/C][C]ResidualsPrediction Error[/C][/ROW]
[ROW][C]1[/C][C]3.4[/C][C]3.66000000000001[/C][C]-0.260000000000011[/C][/ROW]
[ROW][C]2[/C][C]3[/C][C]3.66[/C][C]-0.659999999999999[/C][/ROW]
[ROW][C]3[/C][C]3.1[/C][C]3.66[/C][C]-0.559999999999999[/C][/ROW]
[ROW][C]4[/C][C]2.5[/C][C]1.95696202531646[/C][C]0.543037974683544[/C][/ROW]
[ROW][C]5[/C][C]2.2[/C][C]1.95696202531646[/C][C]0.243037974683544[/C][/ROW]
[ROW][C]6[/C][C]2.3[/C][C]1.95696202531646[/C][C]0.343037974683544[/C][/ROW]
[ROW][C]7[/C][C]2.1[/C][C]1.95696202531646[/C][C]0.143037974683544[/C][/ROW]
[ROW][C]8[/C][C]2.8[/C][C]1.95696202531646[/C][C]0.843037974683544[/C][/ROW]
[ROW][C]9[/C][C]3.1[/C][C]3.66[/C][C]-0.559999999999999[/C][/ROW]
[ROW][C]10[/C][C]2.9[/C][C]1.95696202531646[/C][C]0.943037974683544[/C][/ROW]
[ROW][C]11[/C][C]2.6[/C][C]1.95696202531646[/C][C]0.643037974683544[/C][/ROW]
[ROW][C]12[/C][C]2.7[/C][C]1.95696202531646[/C][C]0.743037974683544[/C][/ROW]
[ROW][C]13[/C][C]2.3[/C][C]1.95696202531646[/C][C]0.343037974683544[/C][/ROW]
[ROW][C]14[/C][C]2.3[/C][C]1.95696202531646[/C][C]0.343037974683544[/C][/ROW]
[ROW][C]15[/C][C]2.1[/C][C]1.95696202531646[/C][C]0.143037974683544[/C][/ROW]
[ROW][C]16[/C][C]2.2[/C][C]1.95696202531646[/C][C]0.243037974683544[/C][/ROW]
[ROW][C]17[/C][C]2.9[/C][C]1.95696202531646[/C][C]0.943037974683544[/C][/ROW]
[ROW][C]18[/C][C]2.6[/C][C]1.95696202531646[/C][C]0.643037974683544[/C][/ROW]
[ROW][C]19[/C][C]2.7[/C][C]1.95696202531646[/C][C]0.743037974683544[/C][/ROW]
[ROW][C]20[/C][C]1.8[/C][C]1.95696202531646[/C][C]-0.156962025316456[/C][/ROW]
[ROW][C]21[/C][C]1.3[/C][C]1.95696202531646[/C][C]-0.656962025316456[/C][/ROW]
[ROW][C]22[/C][C]0.9[/C][C]1.95696202531646[/C][C]-1.05696202531646[/C][/ROW]
[ROW][C]23[/C][C]1.3[/C][C]1.95696202531646[/C][C]-0.656962025316456[/C][/ROW]
[ROW][C]24[/C][C]1.3[/C][C]1.95696202531646[/C][C]-0.656962025316456[/C][/ROW]
[ROW][C]25[/C][C]1.3[/C][C]1.95696202531646[/C][C]-0.656962025316456[/C][/ROW]
[ROW][C]26[/C][C]1.3[/C][C]1.95696202531646[/C][C]-0.656962025316456[/C][/ROW]
[ROW][C]27[/C][C]1.1[/C][C]1.95696202531646[/C][C]-0.856962025316456[/C][/ROW]
[ROW][C]28[/C][C]1.4[/C][C]1.95696202531646[/C][C]-0.556962025316456[/C][/ROW]
[ROW][C]29[/C][C]1.2[/C][C]1.95696202531646[/C][C]-0.756962025316456[/C][/ROW]
[ROW][C]30[/C][C]1.7[/C][C]1.95696202531646[/C][C]-0.256962025316456[/C][/ROW]
[ROW][C]31[/C][C]1.8[/C][C]1.95696202531646[/C][C]-0.156962025316456[/C][/ROW]
[ROW][C]32[/C][C]1.5[/C][C]1.95696202531646[/C][C]-0.456962025316456[/C][/ROW]
[ROW][C]33[/C][C]1[/C][C]1.95696202531646[/C][C]-0.956962025316456[/C][/ROW]
[ROW][C]34[/C][C]1.6[/C][C]1.95696202531646[/C][C]-0.356962025316456[/C][/ROW]
[ROW][C]35[/C][C]1.5[/C][C]1.95696202531646[/C][C]-0.456962025316456[/C][/ROW]
[ROW][C]36[/C][C]1.8[/C][C]1.95696202531646[/C][C]-0.156962025316456[/C][/ROW]
[ROW][C]37[/C][C]1.8[/C][C]1.95696202531646[/C][C]-0.156962025316456[/C][/ROW]
[ROW][C]38[/C][C]1.6[/C][C]1.95696202531646[/C][C]-0.356962025316456[/C][/ROW]
[ROW][C]39[/C][C]1.9[/C][C]1.95696202531646[/C][C]-0.0569620253164558[/C][/ROW]
[ROW][C]40[/C][C]1.7[/C][C]1.95696202531646[/C][C]-0.256962025316456[/C][/ROW]
[ROW][C]41[/C][C]1.6[/C][C]1.95696202531646[/C][C]-0.356962025316456[/C][/ROW]
[ROW][C]42[/C][C]1.3[/C][C]1.95696202531646[/C][C]-0.656962025316456[/C][/ROW]
[ROW][C]43[/C][C]1.1[/C][C]1.95696202531646[/C][C]-0.856962025316456[/C][/ROW]
[ROW][C]44[/C][C]1.9[/C][C]1.95696202531646[/C][C]-0.0569620253164558[/C][/ROW]
[ROW][C]45[/C][C]2.6[/C][C]1.95696202531646[/C][C]0.643037974683544[/C][/ROW]
[ROW][C]46[/C][C]2.3[/C][C]1.95696202531646[/C][C]0.343037974683544[/C][/ROW]
[ROW][C]47[/C][C]2.4[/C][C]1.95696202531646[/C][C]0.443037974683544[/C][/ROW]
[ROW][C]48[/C][C]2.2[/C][C]1.95696202531646[/C][C]0.243037974683544[/C][/ROW]
[ROW][C]49[/C][C]2[/C][C]1.95696202531646[/C][C]0.0430379746835443[/C][/ROW]
[ROW][C]50[/C][C]2.9[/C][C]1.95696202531646[/C][C]0.943037974683544[/C][/ROW]
[ROW][C]51[/C][C]2.6[/C][C]1.95696202531646[/C][C]0.643037974683544[/C][/ROW]
[ROW][C]52[/C][C]2.3[/C][C]1.95696202531646[/C][C]0.343037974683544[/C][/ROW]
[ROW][C]53[/C][C]2.3[/C][C]1.95696202531646[/C][C]0.343037974683544[/C][/ROW]
[ROW][C]54[/C][C]2.6[/C][C]1.95696202531646[/C][C]0.643037974683544[/C][/ROW]
[ROW][C]55[/C][C]3.1[/C][C]3.66[/C][C]-0.559999999999999[/C][/ROW]
[ROW][C]56[/C][C]2.8[/C][C]1.95696202531646[/C][C]0.843037974683544[/C][/ROW]
[ROW][C]57[/C][C]2.5[/C][C]1.95696202531646[/C][C]0.543037974683544[/C][/ROW]
[ROW][C]58[/C][C]2.9[/C][C]1.95696202531646[/C][C]0.943037974683544[/C][/ROW]
[ROW][C]59[/C][C]3.1[/C][C]3.66[/C][C]-0.559999999999999[/C][/ROW]
[ROW][C]60[/C][C]3.1[/C][C]3.66[/C][C]-0.559999999999999[/C][/ROW]
[ROW][C]61[/C][C]3.2[/C][C]3.66[/C][C]-0.459999999999999[/C][/ROW]
[ROW][C]62[/C][C]2.5[/C][C]1.95696202531646[/C][C]0.543037974683544[/C][/ROW]
[ROW][C]63[/C][C]2.6[/C][C]1.95696202531646[/C][C]0.643037974683544[/C][/ROW]
[ROW][C]64[/C][C]2.9[/C][C]1.95696202531646[/C][C]0.943037974683544[/C][/ROW]
[ROW][C]65[/C][C]2.6[/C][C]1.95696202531646[/C][C]0.643037974683544[/C][/ROW]
[ROW][C]66[/C][C]2.4[/C][C]1.95696202531646[/C][C]0.443037974683544[/C][/ROW]
[ROW][C]67[/C][C]1.7[/C][C]1.95696202531646[/C][C]-0.256962025316456[/C][/ROW]
[ROW][C]68[/C][C]2[/C][C]1.95696202531646[/C][C]0.0430379746835443[/C][/ROW]
[ROW][C]69[/C][C]2.2[/C][C]1.95696202531646[/C][C]0.243037974683544[/C][/ROW]
[ROW][C]70[/C][C]1.9[/C][C]1.95696202531646[/C][C]-0.0569620253164558[/C][/ROW]
[ROW][C]71[/C][C]1.6[/C][C]1.95696202531646[/C][C]-0.356962025316456[/C][/ROW]
[ROW][C]72[/C][C]1.6[/C][C]1.95696202531646[/C][C]-0.356962025316456[/C][/ROW]
[ROW][C]73[/C][C]1.2[/C][C]1.95696202531646[/C][C]-0.756962025316456[/C][/ROW]
[ROW][C]74[/C][C]1.2[/C][C]1.95696202531646[/C][C]-0.756962025316456[/C][/ROW]
[ROW][C]75[/C][C]1.5[/C][C]1.95696202531646[/C][C]-0.456962025316456[/C][/ROW]
[ROW][C]76[/C][C]1.6[/C][C]1.95696202531646[/C][C]-0.356962025316456[/C][/ROW]
[ROW][C]77[/C][C]1.7[/C][C]1.95696202531646[/C][C]-0.256962025316456[/C][/ROW]
[ROW][C]78[/C][C]1.8[/C][C]1.95696202531646[/C][C]-0.156962025316456[/C][/ROW]
[ROW][C]79[/C][C]1.8[/C][C]1.95696202531646[/C][C]-0.156962025316456[/C][/ROW]
[ROW][C]80[/C][C]1.8[/C][C]1.95696202531646[/C][C]-0.156962025316456[/C][/ROW]
[ROW][C]81[/C][C]1.3[/C][C]1.95696202531646[/C][C]-0.656962025316456[/C][/ROW]
[ROW][C]82[/C][C]1.3[/C][C]1.95696202531646[/C][C]-0.656962025316456[/C][/ROW]
[ROW][C]83[/C][C]1.4[/C][C]1.95696202531646[/C][C]-0.556962025316456[/C][/ROW]
[ROW][C]84[/C][C]1.1[/C][C]1.95696202531646[/C][C]-0.856962025316456[/C][/ROW]
[ROW][C]85[/C][C]1.5[/C][C]1.95696202531646[/C][C]-0.456962025316456[/C][/ROW]
[ROW][C]86[/C][C]2.2[/C][C]1.95696202531646[/C][C]0.243037974683544[/C][/ROW]
[ROW][C]87[/C][C]2.9[/C][C]1.95696202531646[/C][C]0.943037974683544[/C][/ROW]
[ROW][C]88[/C][C]3.1[/C][C]3.66[/C][C]-0.559999999999999[/C][/ROW]
[ROW][C]89[/C][C]3.5[/C][C]3.66[/C][C]-0.159999999999999[/C][/ROW]
[ROW][C]90[/C][C]3.6[/C][C]3.66[/C][C]-0.0599999999999992[/C][/ROW]
[ROW][C]91[/C][C]4.4[/C][C]3.66[/C][C]0.740000000000001[/C][/ROW]
[ROW][C]92[/C][C]4.2[/C][C]3.66[/C][C]0.540000000000001[/C][/ROW]
[ROW][C]93[/C][C]5.2[/C][C]3.66[/C][C]1.54[/C][/ROW]
[ROW][C]94[/C][C]5.8[/C][C]3.66[/C][C]2.14[/C][/ROW]
[/TABLE]
Source: https://freestatistics.org/blog/index.php?pk=25037&T=4

Globally Unique Identifier (entire table): ba.freestatistics.org/blog/index.php?pk=25037&T=4

As an alternative you can also use a QR Code:  

The GUIDs for individual cells are displayed in the table below:

Multiple Linear Regression - Actuals, Interpolation, and Residuals
Time or IndexActualsInterpolationForecastResidualsPrediction Error
13.43.66000000000001-0.260000000000011
233.66-0.659999999999999
33.13.66-0.559999999999999
42.51.956962025316460.543037974683544
52.21.956962025316460.243037974683544
62.31.956962025316460.343037974683544
72.11.956962025316460.143037974683544
82.81.956962025316460.843037974683544
93.13.66-0.559999999999999
102.91.956962025316460.943037974683544
112.61.956962025316460.643037974683544
122.71.956962025316460.743037974683544
132.31.956962025316460.343037974683544
142.31.956962025316460.343037974683544
152.11.956962025316460.143037974683544
162.21.956962025316460.243037974683544
172.91.956962025316460.943037974683544
182.61.956962025316460.643037974683544
192.71.956962025316460.743037974683544
201.81.95696202531646-0.156962025316456
211.31.95696202531646-0.656962025316456
220.91.95696202531646-1.05696202531646
231.31.95696202531646-0.656962025316456
241.31.95696202531646-0.656962025316456
251.31.95696202531646-0.656962025316456
261.31.95696202531646-0.656962025316456
271.11.95696202531646-0.856962025316456
281.41.95696202531646-0.556962025316456
291.21.95696202531646-0.756962025316456
301.71.95696202531646-0.256962025316456
311.81.95696202531646-0.156962025316456
321.51.95696202531646-0.456962025316456
3311.95696202531646-0.956962025316456
341.61.95696202531646-0.356962025316456
351.51.95696202531646-0.456962025316456
361.81.95696202531646-0.156962025316456
371.81.95696202531646-0.156962025316456
381.61.95696202531646-0.356962025316456
391.91.95696202531646-0.0569620253164558
401.71.95696202531646-0.256962025316456
411.61.95696202531646-0.356962025316456
421.31.95696202531646-0.656962025316456
431.11.95696202531646-0.856962025316456
441.91.95696202531646-0.0569620253164558
452.61.956962025316460.643037974683544
462.31.956962025316460.343037974683544
472.41.956962025316460.443037974683544
482.21.956962025316460.243037974683544
4921.956962025316460.0430379746835443
502.91.956962025316460.943037974683544
512.61.956962025316460.643037974683544
522.31.956962025316460.343037974683544
532.31.956962025316460.343037974683544
542.61.956962025316460.643037974683544
553.13.66-0.559999999999999
562.81.956962025316460.843037974683544
572.51.956962025316460.543037974683544
582.91.956962025316460.943037974683544
593.13.66-0.559999999999999
603.13.66-0.559999999999999
613.23.66-0.459999999999999
622.51.956962025316460.543037974683544
632.61.956962025316460.643037974683544
642.91.956962025316460.943037974683544
652.61.956962025316460.643037974683544
662.41.956962025316460.443037974683544
671.71.95696202531646-0.256962025316456
6821.956962025316460.0430379746835443
692.21.956962025316460.243037974683544
701.91.95696202531646-0.0569620253164558
711.61.95696202531646-0.356962025316456
721.61.95696202531646-0.356962025316456
731.21.95696202531646-0.756962025316456
741.21.95696202531646-0.756962025316456
751.51.95696202531646-0.456962025316456
761.61.95696202531646-0.356962025316456
771.71.95696202531646-0.256962025316456
781.81.95696202531646-0.156962025316456
791.81.95696202531646-0.156962025316456
801.81.95696202531646-0.156962025316456
811.31.95696202531646-0.656962025316456
821.31.95696202531646-0.656962025316456
831.41.95696202531646-0.556962025316456
841.11.95696202531646-0.856962025316456
851.51.95696202531646-0.456962025316456
862.21.956962025316460.243037974683544
872.91.956962025316460.943037974683544
883.13.66-0.559999999999999
893.53.66-0.159999999999999
903.63.66-0.0599999999999992
914.43.660.740000000000001
924.23.660.540000000000001
935.23.661.54
945.83.662.14


Parameters (Session):
par1 = 1 ; par2 = Do not include Seasonal Dummies ; par3 = No Linear Trend ;
Parameters (R input):
par1 = 1 ; par2 = Do not include Seasonal Dummies ; par3 = No Linear Trend ;
R code (references can be found in the software module):
library(lattice)
par1 <- as.numeric(par1)
x <- t(y)
k <- length(x[1,])
n <- length(x[,1])
x1 <- cbind(x[,par1], x[,1:k!=par1])
mycolnames <- c(colnames(x)[par1], colnames(x)[1:k!=par1])
colnames(x1) <- mycolnames #colnames(x)[par1]
x <- x1
if (par3 == 'First Differences'){
x2 <- array(0, dim=c(n-1,k), dimnames=list(1:(n-1), paste('(1-B)',colnames(x),sep='')))
for (i in 1:n-1) {
for (j in 1:k) {
x2[i,j] <- x[i+1,j] - x[i,j]
}
}
x <- x2
}
if (par2 == 'Include Monthly Dummies'){
x2 <- array(0, dim=c(n,11), dimnames=list(1:n, paste('M', seq(1:11), sep ='')))
for (i in 1:11){
x2[seq(i,n,12),i] <- 1
}
x <- cbind(x, x2)
}
if (par2 == 'Include Quarterly Dummies'){
x2 <- array(0, dim=c(n,3), dimnames=list(1:n, paste('Q', seq(1:3), sep ='')))
for (i in 1:3){
x2[seq(i,n,4),i] <- 1
}
x <- cbind(x, x2)
}
k <- length(x[1,])
if (par3 == 'Linear Trend'){
x <- cbind(x, c(1:n))
colnames(x)[k+1] <- 't'
}
x
k <- length(x[1,])
df <- as.data.frame(x)
(mylm <- lm(df))
(mysum <- summary(mylm))
bitmap(file='test0.png')
plot(x[,1], type='l', main='Actuals and Interpolation', ylab='value of Actuals and Interpolation (dots)', xlab='time or index')
points(x[,1]-mysum$resid)
grid()
dev.off()
bitmap(file='test1.png')
plot(mysum$resid, type='b', pch=19, main='Residuals', ylab='value of Residuals', xlab='time or index')
grid()
dev.off()
bitmap(file='test2.png')
hist(mysum$resid, main='Residual Histogram', xlab='values of Residuals')
grid()
dev.off()
bitmap(file='test3.png')
densityplot(~mysum$resid,col='black',main='Residual Density Plot', xlab='values of Residuals')
dev.off()
bitmap(file='test4.png')
qqnorm(mysum$resid, main='Residual Normal Q-Q Plot')
grid()
dev.off()
(myerror <- as.ts(mysum$resid))
bitmap(file='test5.png')
dum <- cbind(lag(myerror,k=1),myerror)
dum
dum1 <- dum[2:length(myerror),]
dum1
z <- as.data.frame(dum1)
z
plot(z,main=paste('Residual Lag plot, lowess, and regression line'), ylab='values of Residuals', xlab='lagged values of Residuals')
lines(lowess(z))
abline(lm(z))
grid()
dev.off()
bitmap(file='test6.png')
acf(mysum$resid, lag.max=length(mysum$resid)/2, main='Residual Autocorrelation Function')
grid()
dev.off()
bitmap(file='test7.png')
pacf(mysum$resid, lag.max=length(mysum$resid)/2, main='Residual Partial Autocorrelation Function')
grid()
dev.off()
bitmap(file='test8.png')
opar <- par(mfrow = c(2,2), oma = c(0, 0, 1.1, 0))
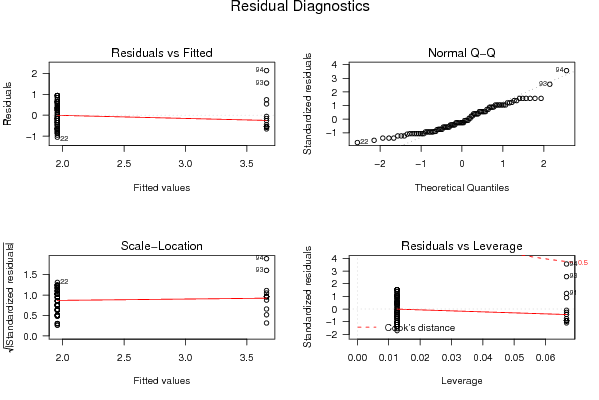
plot(mylm, las = 1, sub='Residual Diagnostics')
par(opar)
dev.off()
load(file='createtable')
a<-table.start()
a<-table.row.start(a)
a<-table.element(a, 'Multiple Linear Regression - Estimated Regression Equation', 1, TRUE)
a<-table.row.end(a)
myeq <- colnames(x)[1]
myeq <- paste(myeq, '[t] = ', sep='')
for (i in 1:k){
if (mysum$coefficients[i,1] > 0) myeq <- paste(myeq, '+', '')
myeq <- paste(myeq, mysum$coefficients[i,1], sep=' ')
if (rownames(mysum$coefficients)[i] != '(Intercept)') {
myeq <- paste(myeq, rownames(mysum$coefficients)[i], sep='')
if (rownames(mysum$coefficients)[i] != 't') myeq <- paste(myeq, '[t]', sep='')
}
}
myeq <- paste(myeq, ' + e[t]')
a<-table.row.start(a)
a<-table.element(a, myeq)
a<-table.row.end(a)
a<-table.end(a)
table.save(a,file='mytable1.tab')
a<-table.start()
a<-table.row.start(a)
a<-table.element(a,hyperlink('ols1.htm','Multiple Linear Regression - Ordinary Least Squares',''), 6, TRUE)
a<-table.row.end(a)
a<-table.row.start(a)
a<-table.element(a,'Variable',header=TRUE)
a<-table.element(a,'Parameter',header=TRUE)
a<-table.element(a,'S.D.',header=TRUE)
a<-table.element(a,'T-STAT
H0: parameter = 0',header=TRUE)
a<-table.element(a,'2-tail p-value',header=TRUE)
a<-table.element(a,'1-tail p-value',header=TRUE)
a<-table.row.end(a)
for (i in 1:k){
a<-table.row.start(a)
a<-table.element(a,rownames(mysum$coefficients)[i],header=TRUE)
a<-table.element(a,mysum$coefficients[i,1])
a<-table.element(a, round(mysum$coefficients[i,2],6))
a<-table.element(a, round(mysum$coefficients[i,3],4))
a<-table.element(a, round(mysum$coefficients[i,4],6))
a<-table.element(a, round(mysum$coefficients[i,4]/2,6))
a<-table.row.end(a)
}
a<-table.end(a)
table.save(a,file='mytable2.tab')
a<-table.start()
a<-table.row.start(a)
a<-table.element(a, 'Multiple Linear Regression - Regression Statistics', 2, TRUE)
a<-table.row.end(a)
a<-table.row.start(a)
a<-table.element(a, 'Multiple R',1,TRUE)
a<-table.element(a, sqrt(mysum$r.squared))
a<-table.row.end(a)
a<-table.row.start(a)
a<-table.element(a, 'R-squared',1,TRUE)
a<-table.element(a, mysum$r.squared)
a<-table.row.end(a)
a<-table.row.start(a)
a<-table.element(a, 'Adjusted R-squared',1,TRUE)
a<-table.element(a, mysum$adj.r.squared)
a<-table.row.end(a)
a<-table.row.start(a)
a<-table.element(a, 'F-TEST (value)',1,TRUE)
a<-table.element(a, mysum$fstatistic[1])
a<-table.row.end(a)
a<-table.row.start(a)
a<-table.element(a, 'F-TEST (DF numerator)',1,TRUE)
a<-table.element(a, mysum$fstatistic[2])
a<-table.row.end(a)
a<-table.row.start(a)
a<-table.element(a, 'F-TEST (DF denominator)',1,TRUE)
a<-table.element(a, mysum$fstatistic[3])
a<-table.row.end(a)
a<-table.row.start(a)
a<-table.element(a, 'p-value',1,TRUE)
a<-table.element(a, 1-pf(mysum$fstatistic[1],mysum$fstatistic[2],mysum$fstatistic[3]))
a<-table.row.end(a)
a<-table.row.start(a)
a<-table.element(a, 'Multiple Linear Regression - Residual Statistics', 2, TRUE)
a<-table.row.end(a)
a<-table.row.start(a)
a<-table.element(a, 'Residual Standard Deviation',1,TRUE)
a<-table.element(a, mysum$sigma)
a<-table.row.end(a)
a<-table.row.start(a)
a<-table.element(a, 'Sum Squared Residuals',1,TRUE)
a<-table.element(a, sum(myerror*myerror))
a<-table.row.end(a)
a<-table.end(a)
table.save(a,file='mytable3.tab')
a<-table.start()
a<-table.row.start(a)
a<-table.element(a, 'Multiple Linear Regression - Actuals, Interpolation, and Residuals', 4, TRUE)
a<-table.row.end(a)
a<-table.row.start(a)
a<-table.element(a, 'Time or Index', 1, TRUE)
a<-table.element(a, 'Actuals', 1, TRUE)
a<-table.element(a, 'Interpolation
Forecast', 1, TRUE)
a<-table.element(a, 'Residuals
Prediction Error', 1, TRUE)
a<-table.row.end(a)
for (i in 1:n) {
a<-table.row.start(a)
a<-table.element(a,i, 1, TRUE)
a<-table.element(a,x[i])
a<-table.element(a,x[i]-mysum$resid[i])
a<-table.element(a,mysum$resid[i])
a<-table.row.end(a)
}
a<-table.end(a)
table.save(a,file='mytable4.tab')