Free Statistics

of Irreproducible Research!

Author's title

Author*The author of this computation has been verified*
R Software Modulerwasp_multipleregression.wasp
Title produced by softwareMultiple Regression
Date of computationSat, 15 Nov 2008 14:54:28 -0700
Cite this page as followsStatistical Computations at FreeStatistics.org, Office for Research Development and Education, URL https://freestatistics.org/blog/index.php?v=date/2008/Nov/15/t1226786297jom1zoesj8oua7o.htm/, Retrieved Mon, 29 Apr 2024 11:20:08 +0000
Statistical Computations at FreeStatistics.org, Office for Research Development and Education, URL https://freestatistics.org/blog/index.php?pk=24946, Retrieved Mon, 29 Apr 2024 11:20:08 +0000
QR Codes:

Original text written by user:
IsPrivate?No (this computation is public)
User-defined keywords
Estimated Impact282
Family? (F = Feedback message, R = changed R code, M = changed R Module, P = changed Parameters, D = changed Data)
-     [Multiple Regression] [Q1 The Seatbeltlaw] [2007-11-14 19:27:43] [8cd6641b921d30ebe00b648d1481bba0]
F    D  [Multiple Regression] [The Seatbelt Law ...] [2008-11-15 12:00:57] [93834488277b53a4510bfd06084ae13b]
-   PD    [Multiple Regression] [] [2008-11-15 18:50:27] [93834488277b53a4510bfd06084ae13b]
F   P         [Multiple Regression] [Q3 - Consumptiepr...] [2008-11-15 21:54:28] [4127a50d3937d4bda99dae34ed7ecdc5] [Current]
Feedback Forum
2008-11-30 13:45:24 [Kristof Van Esbroeck] [reply
Student geeft een volledig en, naar mijn mening, correct antwoord op de vraagstelling.

Er wordt eerst een berekening geblogd zonder monthly dummies en trend. Na het trekken van een correcte conclusie wordt deze aangepast dmv invoering van monthly dummie en trend.

De interpretatie van de r squared en adjusted r squared waarde is ook correct waardoor men ook een juiste conclusie trekt.

Post a new message
Dataseries X:
2.2	0
2.3	0
2.1	0
2.8	0
3.1	0
2.9	0
2.6	0
2.7	0
2.3	0
2.3	0
2.1	0
2.2	0
2.9	0
2.6	0
2.7	0
1.8	1
1.3	1
0.9	1
1.3	1
1.3	1
1.3	1
1.3	1
1.1	1
1.4	1
1.2	1
1.7	1
1.8	1
1.5	1
1	1
1.6	1
1.5	1
1.8	1
1.8	1
1.6	1
1.9	1
1.7	1
1.6	1
1.3	1
1.1	1
1.9	0
2.6	0
2.3	0
2.4	0
2.2	0
2	0
2.9	0
2.6	0
2.3	0
2.3	0
2.6	0
3.1	0
2.8	0
2.5	0
2.9	0
3.1	0
3.1	0
3.2	0
2.5	0
2.6	0
2.9	0


Summary of computational transaction
Raw Inputview raw input (R code)
Raw Outputview raw output of R engine
Computing time5 seconds
R Server'Herman Ole Andreas Wold' @ 193.190.124.10:1001

\begin{tabular}{lllllllll}
\hline
Summary of computational transaction \tabularnewline
Raw Input & view raw input (R code)  \tabularnewline
Raw Output & view raw output of R engine  \tabularnewline
Computing time & 5 seconds \tabularnewline
R Server & 'Herman Ole Andreas Wold' @ 193.190.124.10:1001 \tabularnewline
\hline
\end{tabular}
%Source: https://freestatistics.org/blog/index.php?pk=24946&T=0

[TABLE]
[ROW][C]Summary of computational transaction[/C][/ROW]
[ROW][C]Raw Input[/C][C]view raw input (R code) [/C][/ROW]
[ROW][C]Raw Output[/C][C]view raw output of R engine [/C][/ROW]
[ROW][C]Computing time[/C][C]5 seconds[/C][/ROW]
[ROW][C]R Server[/C][C]'Herman Ole Andreas Wold' @ 193.190.124.10:1001[/C][/ROW]
[/TABLE]
Source: https://freestatistics.org/blog/index.php?pk=24946&T=0

Globally Unique Identifier (entire table): ba.freestatistics.org/blog/index.php?pk=24946&T=0

As an alternative you can also use a QR Code:  

The GUIDs for individual cells are displayed in the table below:

Summary of computational transaction
Raw Inputview raw input (R code)
Raw Outputview raw output of R engine
Computing time5 seconds
R Server'Herman Ole Andreas Wold' @ 193.190.124.10:1001


Multiple Linear Regression - Estimated Regression Equation
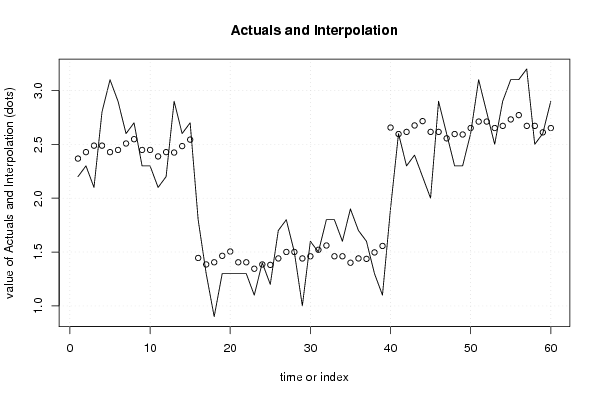
Consumptieprijsindex[t] = + 2.37191489361702 -1.09893617021277Dumivariabele[t] -0.00877068557919695M1[t] + 0.0465721040189127M2[t] + 0.101914893617021M3[t] + 0.09725768321513M4[t] + 0.0326004728132389M5[t] + 0.0479432624113475M6[t] + 0.103286052009456M7[t] + 0.138628841607565M8[t] + 0.0339716312056738M9[t] + 0.0293144208037825M10[t] -0.0353427895981086M11[t] + 0.00465721040189126t + e[t]

\begin{tabular}{lllllllll}
\hline
Multiple Linear Regression - Estimated Regression Equation \tabularnewline
Consumptieprijsindex[t] =  +  2.37191489361702 -1.09893617021277Dumivariabele[t] -0.00877068557919695M1[t] +  0.0465721040189127M2[t] +  0.101914893617021M3[t] +  0.09725768321513M4[t] +  0.0326004728132389M5[t] +  0.0479432624113475M6[t] +  0.103286052009456M7[t] +  0.138628841607565M8[t] +  0.0339716312056738M9[t] +  0.0293144208037825M10[t] -0.0353427895981086M11[t] +  0.00465721040189126t  + e[t] \tabularnewline
\hline
\end{tabular}
%Source: https://freestatistics.org/blog/index.php?pk=24946&T=1

[TABLE]
[ROW][C]Multiple Linear Regression - Estimated Regression Equation[/C][/ROW]
[ROW][C]Consumptieprijsindex[t] =  +  2.37191489361702 -1.09893617021277Dumivariabele[t] -0.00877068557919695M1[t] +  0.0465721040189127M2[t] +  0.101914893617021M3[t] +  0.09725768321513M4[t] +  0.0326004728132389M5[t] +  0.0479432624113475M6[t] +  0.103286052009456M7[t] +  0.138628841607565M8[t] +  0.0339716312056738M9[t] +  0.0293144208037825M10[t] -0.0353427895981086M11[t] +  0.00465721040189126t  + e[t][/C][/ROW]
[/TABLE]
Source: https://freestatistics.org/blog/index.php?pk=24946&T=1

Globally Unique Identifier (entire table): ba.freestatistics.org/blog/index.php?pk=24946&T=1

As an alternative you can also use a QR Code:  

The GUIDs for individual cells are displayed in the table below:

Multiple Linear Regression - Estimated Regression Equation
Consumptieprijsindex[t] = + 2.37191489361702 -1.09893617021277Dumivariabele[t] -0.00877068557919695M1[t] + 0.0465721040189127M2[t] + 0.101914893617021M3[t] + 0.09725768321513M4[t] + 0.0326004728132389M5[t] + 0.0479432624113475M6[t] + 0.103286052009456M7[t] + 0.138628841607565M8[t] + 0.0339716312056738M9[t] + 0.0293144208037825M10[t] -0.0353427895981086M11[t] + 0.00465721040189126t + e[t]


Multiple Linear Regression - Ordinary Least Squares
VariableParameterS.D.T-STATH0: parameter = 02-tail p-value1-tail p-value
(Intercept)2.371914893617020.19075112.434600
Dumivariabele-1.098936170212770.093299-11.778600
M1-0.008770685579196950.223545-0.03920.9688730.484437
M20.04657210401891270.2232040.20870.8356410.41782
M30.1019148936170210.2228950.45720.6496570.324828
M40.097257683215130.2226190.43690.6642420.332121
M50.03260047281323890.2223740.14660.8840870.442043
M60.04794326241134750.2221620.21580.8300950.415048
M70.1032860520094560.2219820.46530.6439190.32196
M80.1386288416075650.2218350.62490.5351130.267556
M90.03397163120567380.2217210.15320.8788960.439448
M100.02931442080378250.2216390.13230.8953540.447677
M11-0.03534278959810860.22159-0.15950.8739760.436988
t0.004657210401891260.0026931.72920.0904850.045242

\begin{tabular}{lllllllll}
\hline
Multiple Linear Regression - Ordinary Least Squares \tabularnewline
Variable & Parameter & S.D. & T-STATH0: parameter = 0 & 2-tail p-value & 1-tail p-value \tabularnewline
(Intercept) & 2.37191489361702 & 0.190751 & 12.4346 & 0 & 0 \tabularnewline
Dumivariabele & -1.09893617021277 & 0.093299 & -11.7786 & 0 & 0 \tabularnewline
M1 & -0.00877068557919695 & 0.223545 & -0.0392 & 0.968873 & 0.484437 \tabularnewline
M2 & 0.0465721040189127 & 0.223204 & 0.2087 & 0.835641 & 0.41782 \tabularnewline
M3 & 0.101914893617021 & 0.222895 & 0.4572 & 0.649657 & 0.324828 \tabularnewline
M4 & 0.09725768321513 & 0.222619 & 0.4369 & 0.664242 & 0.332121 \tabularnewline
M5 & 0.0326004728132389 & 0.222374 & 0.1466 & 0.884087 & 0.442043 \tabularnewline
M6 & 0.0479432624113475 & 0.222162 & 0.2158 & 0.830095 & 0.415048 \tabularnewline
M7 & 0.103286052009456 & 0.221982 & 0.4653 & 0.643919 & 0.32196 \tabularnewline
M8 & 0.138628841607565 & 0.221835 & 0.6249 & 0.535113 & 0.267556 \tabularnewline
M9 & 0.0339716312056738 & 0.221721 & 0.1532 & 0.878896 & 0.439448 \tabularnewline
M10 & 0.0293144208037825 & 0.221639 & 0.1323 & 0.895354 & 0.447677 \tabularnewline
M11 & -0.0353427895981086 & 0.22159 & -0.1595 & 0.873976 & 0.436988 \tabularnewline
t & 0.00465721040189126 & 0.002693 & 1.7292 & 0.090485 & 0.045242 \tabularnewline
\hline
\end{tabular}
%Source: https://freestatistics.org/blog/index.php?pk=24946&T=2

[TABLE]
[ROW][C]Multiple Linear Regression - Ordinary Least Squares[/C][/ROW]
[ROW][C]Variable[/C][C]Parameter[/C][C]S.D.[/C][C]T-STATH0: parameter = 0[/C][C]2-tail p-value[/C][C]1-tail p-value[/C][/ROW]
[ROW][C](Intercept)[/C][C]2.37191489361702[/C][C]0.190751[/C][C]12.4346[/C][C]0[/C][C]0[/C][/ROW]
[ROW][C]Dumivariabele[/C][C]-1.09893617021277[/C][C]0.093299[/C][C]-11.7786[/C][C]0[/C][C]0[/C][/ROW]
[ROW][C]M1[/C][C]-0.00877068557919695[/C][C]0.223545[/C][C]-0.0392[/C][C]0.968873[/C][C]0.484437[/C][/ROW]
[ROW][C]M2[/C][C]0.0465721040189127[/C][C]0.223204[/C][C]0.2087[/C][C]0.835641[/C][C]0.41782[/C][/ROW]
[ROW][C]M3[/C][C]0.101914893617021[/C][C]0.222895[/C][C]0.4572[/C][C]0.649657[/C][C]0.324828[/C][/ROW]
[ROW][C]M4[/C][C]0.09725768321513[/C][C]0.222619[/C][C]0.4369[/C][C]0.664242[/C][C]0.332121[/C][/ROW]
[ROW][C]M5[/C][C]0.0326004728132389[/C][C]0.222374[/C][C]0.1466[/C][C]0.884087[/C][C]0.442043[/C][/ROW]
[ROW][C]M6[/C][C]0.0479432624113475[/C][C]0.222162[/C][C]0.2158[/C][C]0.830095[/C][C]0.415048[/C][/ROW]
[ROW][C]M7[/C][C]0.103286052009456[/C][C]0.221982[/C][C]0.4653[/C][C]0.643919[/C][C]0.32196[/C][/ROW]
[ROW][C]M8[/C][C]0.138628841607565[/C][C]0.221835[/C][C]0.6249[/C][C]0.535113[/C][C]0.267556[/C][/ROW]
[ROW][C]M9[/C][C]0.0339716312056738[/C][C]0.221721[/C][C]0.1532[/C][C]0.878896[/C][C]0.439448[/C][/ROW]
[ROW][C]M10[/C][C]0.0293144208037825[/C][C]0.221639[/C][C]0.1323[/C][C]0.895354[/C][C]0.447677[/C][/ROW]
[ROW][C]M11[/C][C]-0.0353427895981086[/C][C]0.22159[/C][C]-0.1595[/C][C]0.873976[/C][C]0.436988[/C][/ROW]
[ROW][C]t[/C][C]0.00465721040189126[/C][C]0.002693[/C][C]1.7292[/C][C]0.090485[/C][C]0.045242[/C][/ROW]
[/TABLE]
Source: https://freestatistics.org/blog/index.php?pk=24946&T=2

Globally Unique Identifier (entire table): ba.freestatistics.org/blog/index.php?pk=24946&T=2

As an alternative you can also use a QR Code:  

The GUIDs for individual cells are displayed in the table below:

Multiple Linear Regression - Ordinary Least Squares
VariableParameterS.D.T-STATH0: parameter = 02-tail p-value1-tail p-value
(Intercept)2.371914893617020.19075112.434600
Dumivariabele-1.098936170212770.093299-11.778600
M1-0.008770685579196950.223545-0.03920.9688730.484437
M20.04657210401891270.2232040.20870.8356410.41782
M30.1019148936170210.2228950.45720.6496570.324828
M40.097257683215130.2226190.43690.6642420.332121
M50.03260047281323890.2223740.14660.8840870.442043
M60.04794326241134750.2221620.21580.8300950.415048
M70.1032860520094560.2219820.46530.6439190.32196
M80.1386288416075650.2218350.62490.5351130.267556
M90.03397163120567380.2217210.15320.8788960.439448
M100.02931442080378250.2216390.13230.8953540.447677
M11-0.03534278959810860.22159-0.15950.8739760.436988
t0.004657210401891260.0026931.72920.0904850.045242


Multiple Linear Regression - Regression Statistics
Multiple R0.876092023146262
R-squared0.76753723302051
Adjusted R-squared0.701841233656742
F-TEST (value)11.6831654964336
F-TEST (DF numerator)13
F-TEST (DF denominator)46
p-value1.46781253818062e-10
Multiple Linear Regression - Residual Statistics
Residual Standard Deviation0.350338367781153
Sum Squared Residuals5.64590070921986

\begin{tabular}{lllllllll}
\hline
Multiple Linear Regression - Regression Statistics \tabularnewline
Multiple R & 0.876092023146262 \tabularnewline
R-squared & 0.76753723302051 \tabularnewline
Adjusted R-squared & 0.701841233656742 \tabularnewline
F-TEST (value) & 11.6831654964336 \tabularnewline
F-TEST (DF numerator) & 13 \tabularnewline
F-TEST (DF denominator) & 46 \tabularnewline
p-value & 1.46781253818062e-10 \tabularnewline
Multiple Linear Regression - Residual Statistics \tabularnewline
Residual Standard Deviation & 0.350338367781153 \tabularnewline
Sum Squared Residuals & 5.64590070921986 \tabularnewline
\hline
\end{tabular}
%Source: https://freestatistics.org/blog/index.php?pk=24946&T=3

[TABLE]
[ROW][C]Multiple Linear Regression - Regression Statistics[/C][/ROW]
[ROW][C]Multiple R[/C][C]0.876092023146262[/C][/ROW]
[ROW][C]R-squared[/C][C]0.76753723302051[/C][/ROW]
[ROW][C]Adjusted R-squared[/C][C]0.701841233656742[/C][/ROW]
[ROW][C]F-TEST (value)[/C][C]11.6831654964336[/C][/ROW]
[ROW][C]F-TEST (DF numerator)[/C][C]13[/C][/ROW]
[ROW][C]F-TEST (DF denominator)[/C][C]46[/C][/ROW]
[ROW][C]p-value[/C][C]1.46781253818062e-10[/C][/ROW]
[ROW][C]Multiple Linear Regression - Residual Statistics[/C][/ROW]
[ROW][C]Residual Standard Deviation[/C][C]0.350338367781153[/C][/ROW]
[ROW][C]Sum Squared Residuals[/C][C]5.64590070921986[/C][/ROW]
[/TABLE]
Source: https://freestatistics.org/blog/index.php?pk=24946&T=3

Globally Unique Identifier (entire table): ba.freestatistics.org/blog/index.php?pk=24946&T=3

As an alternative you can also use a QR Code:  

The GUIDs for individual cells are displayed in the table below:

Multiple Linear Regression - Regression Statistics
Multiple R0.876092023146262
R-squared0.76753723302051
Adjusted R-squared0.701841233656742
F-TEST (value)11.6831654964336
F-TEST (DF numerator)13
F-TEST (DF denominator)46
p-value1.46781253818062e-10
Multiple Linear Regression - Residual Statistics
Residual Standard Deviation0.350338367781153
Sum Squared Residuals5.64590070921986


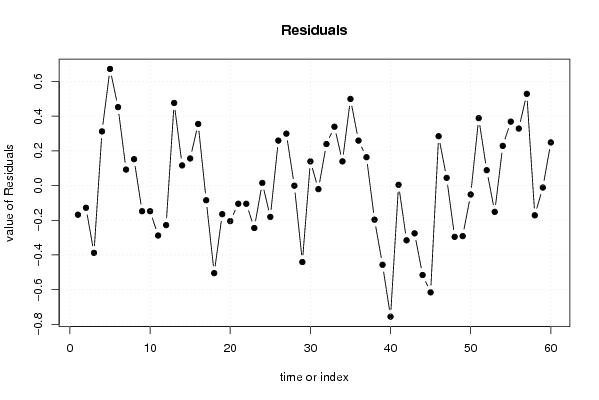
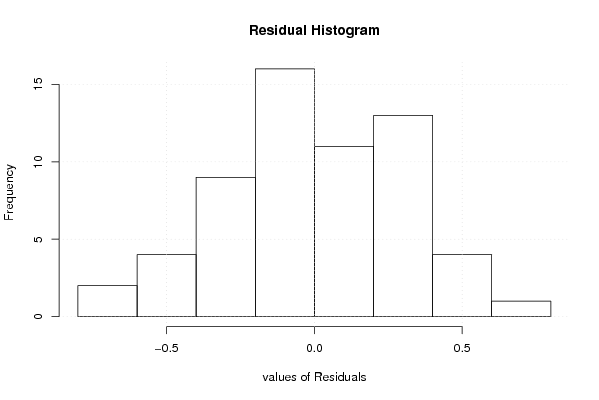
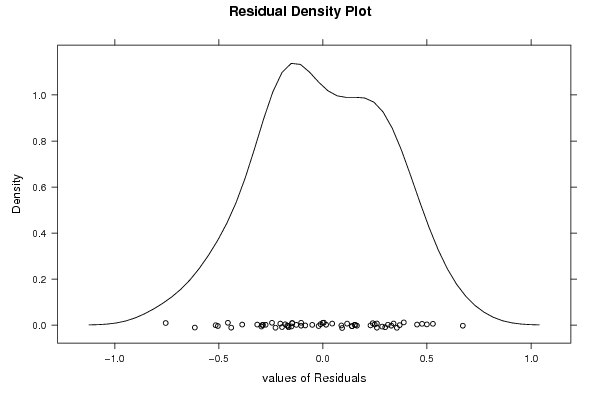
Multiple Linear Regression - Actuals, Interpolation, and Residuals
Time or IndexActualsInterpolationForecastResidualsPrediction Error
12.22.36780141843972-0.167801418439719
22.32.42780141843972-0.127801418439716
32.12.48780141843972-0.387801418439716
42.82.487801418439720.312198581560284
53.12.427801418439720.672198581560284
62.92.447801418439720.452198581560284
72.62.507801418439720.092198581560284
82.72.547801418439720.152198581560284
92.32.44780141843972-0.147801418439716
102.32.44780141843972-0.147801418439716
112.12.38780141843972-0.287801418439716
122.22.42780141843972-0.227801418439716
132.92.423687943262410.47631205673759
142.62.483687943262410.116312056737589
152.72.543687943262410.156312056737589
161.81.444751773049650.355248226950355
171.31.38475177304965-0.0847517730496454
180.91.40475177304965-0.504751773049646
191.31.46475177304965-0.164751773049645
201.31.50475177304965-0.204751773049645
211.31.40475177304965-0.104751773049645
221.31.40475177304965-0.104751773049645
231.11.34475177304965-0.244751773049645
241.41.384751773049650.0152482269503545
251.21.38063829787234-0.18063829787234
261.71.440638297872340.259361702127659
271.81.500638297872340.299361702127659
281.51.50063829787234-0.000638297872340376
2911.44063829787234-0.440638297872341
301.61.460638297872340.139361702127660
311.51.52063829787234-0.0206382978723406
321.81.560638297872340.239361702127659
331.81.460638297872340.339361702127659
341.61.460638297872340.139361702127660
351.91.400638297872340.499361702127659
361.71.440638297872340.259361702127660
371.61.436524822695030.163475177304965
381.31.49652482269504-0.196524822695036
391.11.55652482269504-0.456524822695036
401.92.6554609929078-0.755460992907802
412.62.59546099290780.00453900709219863
422.32.6154609929078-0.315460992907801
432.42.6754609929078-0.275460992907802
442.22.7154609929078-0.515460992907801
4522.6154609929078-0.615460992907801
462.92.61546099290780.284539007092199
472.62.55546099290780.0445390070921986
482.32.5954609929078-0.295460992907802
492.32.59134751773050-0.291347517730496
502.62.65134751773050-0.0513475177304965
513.12.711347517730500.388652482269503
522.82.711347517730500.0886524822695034
532.52.65134751773050-0.151347517730497
542.92.671347517730500.228652482269504
553.12.731347517730500.368652482269504
563.12.771347517730500.328652482269503
573.22.671347517730500.528652482269503
582.52.67134751773050-0.171347517730496
592.62.61134751773050-0.0113475177304964
602.92.651347517730500.248652482269503

\begin{tabular}{lllllllll}
\hline
Multiple Linear Regression - Actuals, Interpolation, and Residuals \tabularnewline
Time or Index & Actuals & InterpolationForecast & ResidualsPrediction Error \tabularnewline
1 & 2.2 & 2.36780141843972 & -0.167801418439719 \tabularnewline
2 & 2.3 & 2.42780141843972 & -0.127801418439716 \tabularnewline
3 & 2.1 & 2.48780141843972 & -0.387801418439716 \tabularnewline
4 & 2.8 & 2.48780141843972 & 0.312198581560284 \tabularnewline
5 & 3.1 & 2.42780141843972 & 0.672198581560284 \tabularnewline
6 & 2.9 & 2.44780141843972 & 0.452198581560284 \tabularnewline
7 & 2.6 & 2.50780141843972 & 0.092198581560284 \tabularnewline
8 & 2.7 & 2.54780141843972 & 0.152198581560284 \tabularnewline
9 & 2.3 & 2.44780141843972 & -0.147801418439716 \tabularnewline
10 & 2.3 & 2.44780141843972 & -0.147801418439716 \tabularnewline
11 & 2.1 & 2.38780141843972 & -0.287801418439716 \tabularnewline
12 & 2.2 & 2.42780141843972 & -0.227801418439716 \tabularnewline
13 & 2.9 & 2.42368794326241 & 0.47631205673759 \tabularnewline
14 & 2.6 & 2.48368794326241 & 0.116312056737589 \tabularnewline
15 & 2.7 & 2.54368794326241 & 0.156312056737589 \tabularnewline
16 & 1.8 & 1.44475177304965 & 0.355248226950355 \tabularnewline
17 & 1.3 & 1.38475177304965 & -0.0847517730496454 \tabularnewline
18 & 0.9 & 1.40475177304965 & -0.504751773049646 \tabularnewline
19 & 1.3 & 1.46475177304965 & -0.164751773049645 \tabularnewline
20 & 1.3 & 1.50475177304965 & -0.204751773049645 \tabularnewline
21 & 1.3 & 1.40475177304965 & -0.104751773049645 \tabularnewline
22 & 1.3 & 1.40475177304965 & -0.104751773049645 \tabularnewline
23 & 1.1 & 1.34475177304965 & -0.244751773049645 \tabularnewline
24 & 1.4 & 1.38475177304965 & 0.0152482269503545 \tabularnewline
25 & 1.2 & 1.38063829787234 & -0.18063829787234 \tabularnewline
26 & 1.7 & 1.44063829787234 & 0.259361702127659 \tabularnewline
27 & 1.8 & 1.50063829787234 & 0.299361702127659 \tabularnewline
28 & 1.5 & 1.50063829787234 & -0.000638297872340376 \tabularnewline
29 & 1 & 1.44063829787234 & -0.440638297872341 \tabularnewline
30 & 1.6 & 1.46063829787234 & 0.139361702127660 \tabularnewline
31 & 1.5 & 1.52063829787234 & -0.0206382978723406 \tabularnewline
32 & 1.8 & 1.56063829787234 & 0.239361702127659 \tabularnewline
33 & 1.8 & 1.46063829787234 & 0.339361702127659 \tabularnewline
34 & 1.6 & 1.46063829787234 & 0.139361702127660 \tabularnewline
35 & 1.9 & 1.40063829787234 & 0.499361702127659 \tabularnewline
36 & 1.7 & 1.44063829787234 & 0.259361702127660 \tabularnewline
37 & 1.6 & 1.43652482269503 & 0.163475177304965 \tabularnewline
38 & 1.3 & 1.49652482269504 & -0.196524822695036 \tabularnewline
39 & 1.1 & 1.55652482269504 & -0.456524822695036 \tabularnewline
40 & 1.9 & 2.6554609929078 & -0.755460992907802 \tabularnewline
41 & 2.6 & 2.5954609929078 & 0.00453900709219863 \tabularnewline
42 & 2.3 & 2.6154609929078 & -0.315460992907801 \tabularnewline
43 & 2.4 & 2.6754609929078 & -0.275460992907802 \tabularnewline
44 & 2.2 & 2.7154609929078 & -0.515460992907801 \tabularnewline
45 & 2 & 2.6154609929078 & -0.615460992907801 \tabularnewline
46 & 2.9 & 2.6154609929078 & 0.284539007092199 \tabularnewline
47 & 2.6 & 2.5554609929078 & 0.0445390070921986 \tabularnewline
48 & 2.3 & 2.5954609929078 & -0.295460992907802 \tabularnewline
49 & 2.3 & 2.59134751773050 & -0.291347517730496 \tabularnewline
50 & 2.6 & 2.65134751773050 & -0.0513475177304965 \tabularnewline
51 & 3.1 & 2.71134751773050 & 0.388652482269503 \tabularnewline
52 & 2.8 & 2.71134751773050 & 0.0886524822695034 \tabularnewline
53 & 2.5 & 2.65134751773050 & -0.151347517730497 \tabularnewline
54 & 2.9 & 2.67134751773050 & 0.228652482269504 \tabularnewline
55 & 3.1 & 2.73134751773050 & 0.368652482269504 \tabularnewline
56 & 3.1 & 2.77134751773050 & 0.328652482269503 \tabularnewline
57 & 3.2 & 2.67134751773050 & 0.528652482269503 \tabularnewline
58 & 2.5 & 2.67134751773050 & -0.171347517730496 \tabularnewline
59 & 2.6 & 2.61134751773050 & -0.0113475177304964 \tabularnewline
60 & 2.9 & 2.65134751773050 & 0.248652482269503 \tabularnewline
\hline
\end{tabular}
%Source: https://freestatistics.org/blog/index.php?pk=24946&T=4

[TABLE]
[ROW][C]Multiple Linear Regression - Actuals, Interpolation, and Residuals[/C][/ROW]
[ROW][C]Time or Index[/C][C]Actuals[/C][C]InterpolationForecast[/C][C]ResidualsPrediction Error[/C][/ROW]
[ROW][C]1[/C][C]2.2[/C][C]2.36780141843972[/C][C]-0.167801418439719[/C][/ROW]
[ROW][C]2[/C][C]2.3[/C][C]2.42780141843972[/C][C]-0.127801418439716[/C][/ROW]
[ROW][C]3[/C][C]2.1[/C][C]2.48780141843972[/C][C]-0.387801418439716[/C][/ROW]
[ROW][C]4[/C][C]2.8[/C][C]2.48780141843972[/C][C]0.312198581560284[/C][/ROW]
[ROW][C]5[/C][C]3.1[/C][C]2.42780141843972[/C][C]0.672198581560284[/C][/ROW]
[ROW][C]6[/C][C]2.9[/C][C]2.44780141843972[/C][C]0.452198581560284[/C][/ROW]
[ROW][C]7[/C][C]2.6[/C][C]2.50780141843972[/C][C]0.092198581560284[/C][/ROW]
[ROW][C]8[/C][C]2.7[/C][C]2.54780141843972[/C][C]0.152198581560284[/C][/ROW]
[ROW][C]9[/C][C]2.3[/C][C]2.44780141843972[/C][C]-0.147801418439716[/C][/ROW]
[ROW][C]10[/C][C]2.3[/C][C]2.44780141843972[/C][C]-0.147801418439716[/C][/ROW]
[ROW][C]11[/C][C]2.1[/C][C]2.38780141843972[/C][C]-0.287801418439716[/C][/ROW]
[ROW][C]12[/C][C]2.2[/C][C]2.42780141843972[/C][C]-0.227801418439716[/C][/ROW]
[ROW][C]13[/C][C]2.9[/C][C]2.42368794326241[/C][C]0.47631205673759[/C][/ROW]
[ROW][C]14[/C][C]2.6[/C][C]2.48368794326241[/C][C]0.116312056737589[/C][/ROW]
[ROW][C]15[/C][C]2.7[/C][C]2.54368794326241[/C][C]0.156312056737589[/C][/ROW]
[ROW][C]16[/C][C]1.8[/C][C]1.44475177304965[/C][C]0.355248226950355[/C][/ROW]
[ROW][C]17[/C][C]1.3[/C][C]1.38475177304965[/C][C]-0.0847517730496454[/C][/ROW]
[ROW][C]18[/C][C]0.9[/C][C]1.40475177304965[/C][C]-0.504751773049646[/C][/ROW]
[ROW][C]19[/C][C]1.3[/C][C]1.46475177304965[/C][C]-0.164751773049645[/C][/ROW]
[ROW][C]20[/C][C]1.3[/C][C]1.50475177304965[/C][C]-0.204751773049645[/C][/ROW]
[ROW][C]21[/C][C]1.3[/C][C]1.40475177304965[/C][C]-0.104751773049645[/C][/ROW]
[ROW][C]22[/C][C]1.3[/C][C]1.40475177304965[/C][C]-0.104751773049645[/C][/ROW]
[ROW][C]23[/C][C]1.1[/C][C]1.34475177304965[/C][C]-0.244751773049645[/C][/ROW]
[ROW][C]24[/C][C]1.4[/C][C]1.38475177304965[/C][C]0.0152482269503545[/C][/ROW]
[ROW][C]25[/C][C]1.2[/C][C]1.38063829787234[/C][C]-0.18063829787234[/C][/ROW]
[ROW][C]26[/C][C]1.7[/C][C]1.44063829787234[/C][C]0.259361702127659[/C][/ROW]
[ROW][C]27[/C][C]1.8[/C][C]1.50063829787234[/C][C]0.299361702127659[/C][/ROW]
[ROW][C]28[/C][C]1.5[/C][C]1.50063829787234[/C][C]-0.000638297872340376[/C][/ROW]
[ROW][C]29[/C][C]1[/C][C]1.44063829787234[/C][C]-0.440638297872341[/C][/ROW]
[ROW][C]30[/C][C]1.6[/C][C]1.46063829787234[/C][C]0.139361702127660[/C][/ROW]
[ROW][C]31[/C][C]1.5[/C][C]1.52063829787234[/C][C]-0.0206382978723406[/C][/ROW]
[ROW][C]32[/C][C]1.8[/C][C]1.56063829787234[/C][C]0.239361702127659[/C][/ROW]
[ROW][C]33[/C][C]1.8[/C][C]1.46063829787234[/C][C]0.339361702127659[/C][/ROW]
[ROW][C]34[/C][C]1.6[/C][C]1.46063829787234[/C][C]0.139361702127660[/C][/ROW]
[ROW][C]35[/C][C]1.9[/C][C]1.40063829787234[/C][C]0.499361702127659[/C][/ROW]
[ROW][C]36[/C][C]1.7[/C][C]1.44063829787234[/C][C]0.259361702127660[/C][/ROW]
[ROW][C]37[/C][C]1.6[/C][C]1.43652482269503[/C][C]0.163475177304965[/C][/ROW]
[ROW][C]38[/C][C]1.3[/C][C]1.49652482269504[/C][C]-0.196524822695036[/C][/ROW]
[ROW][C]39[/C][C]1.1[/C][C]1.55652482269504[/C][C]-0.456524822695036[/C][/ROW]
[ROW][C]40[/C][C]1.9[/C][C]2.6554609929078[/C][C]-0.755460992907802[/C][/ROW]
[ROW][C]41[/C][C]2.6[/C][C]2.5954609929078[/C][C]0.00453900709219863[/C][/ROW]
[ROW][C]42[/C][C]2.3[/C][C]2.6154609929078[/C][C]-0.315460992907801[/C][/ROW]
[ROW][C]43[/C][C]2.4[/C][C]2.6754609929078[/C][C]-0.275460992907802[/C][/ROW]
[ROW][C]44[/C][C]2.2[/C][C]2.7154609929078[/C][C]-0.515460992907801[/C][/ROW]
[ROW][C]45[/C][C]2[/C][C]2.6154609929078[/C][C]-0.615460992907801[/C][/ROW]
[ROW][C]46[/C][C]2.9[/C][C]2.6154609929078[/C][C]0.284539007092199[/C][/ROW]
[ROW][C]47[/C][C]2.6[/C][C]2.5554609929078[/C][C]0.0445390070921986[/C][/ROW]
[ROW][C]48[/C][C]2.3[/C][C]2.5954609929078[/C][C]-0.295460992907802[/C][/ROW]
[ROW][C]49[/C][C]2.3[/C][C]2.59134751773050[/C][C]-0.291347517730496[/C][/ROW]
[ROW][C]50[/C][C]2.6[/C][C]2.65134751773050[/C][C]-0.0513475177304965[/C][/ROW]
[ROW][C]51[/C][C]3.1[/C][C]2.71134751773050[/C][C]0.388652482269503[/C][/ROW]
[ROW][C]52[/C][C]2.8[/C][C]2.71134751773050[/C][C]0.0886524822695034[/C][/ROW]
[ROW][C]53[/C][C]2.5[/C][C]2.65134751773050[/C][C]-0.151347517730497[/C][/ROW]
[ROW][C]54[/C][C]2.9[/C][C]2.67134751773050[/C][C]0.228652482269504[/C][/ROW]
[ROW][C]55[/C][C]3.1[/C][C]2.73134751773050[/C][C]0.368652482269504[/C][/ROW]
[ROW][C]56[/C][C]3.1[/C][C]2.77134751773050[/C][C]0.328652482269503[/C][/ROW]
[ROW][C]57[/C][C]3.2[/C][C]2.67134751773050[/C][C]0.528652482269503[/C][/ROW]
[ROW][C]58[/C][C]2.5[/C][C]2.67134751773050[/C][C]-0.171347517730496[/C][/ROW]
[ROW][C]59[/C][C]2.6[/C][C]2.61134751773050[/C][C]-0.0113475177304964[/C][/ROW]
[ROW][C]60[/C][C]2.9[/C][C]2.65134751773050[/C][C]0.248652482269503[/C][/ROW]
[/TABLE]
Source: https://freestatistics.org/blog/index.php?pk=24946&T=4

Globally Unique Identifier (entire table): ba.freestatistics.org/blog/index.php?pk=24946&T=4

As an alternative you can also use a QR Code:  

The GUIDs for individual cells are displayed in the table below:

Multiple Linear Regression - Actuals, Interpolation, and Residuals
Time or IndexActualsInterpolationForecastResidualsPrediction Error
12.22.36780141843972-0.167801418439719
22.32.42780141843972-0.127801418439716
32.12.48780141843972-0.387801418439716
42.82.487801418439720.312198581560284
53.12.427801418439720.672198581560284
62.92.447801418439720.452198581560284
72.62.507801418439720.092198581560284
82.72.547801418439720.152198581560284
92.32.44780141843972-0.147801418439716
102.32.44780141843972-0.147801418439716
112.12.38780141843972-0.287801418439716
122.22.42780141843972-0.227801418439716
132.92.423687943262410.47631205673759
142.62.483687943262410.116312056737589
152.72.543687943262410.156312056737589
161.81.444751773049650.355248226950355
171.31.38475177304965-0.0847517730496454
180.91.40475177304965-0.504751773049646
191.31.46475177304965-0.164751773049645
201.31.50475177304965-0.204751773049645
211.31.40475177304965-0.104751773049645
221.31.40475177304965-0.104751773049645
231.11.34475177304965-0.244751773049645
241.41.384751773049650.0152482269503545
251.21.38063829787234-0.18063829787234
261.71.440638297872340.259361702127659
271.81.500638297872340.299361702127659
281.51.50063829787234-0.000638297872340376
2911.44063829787234-0.440638297872341
301.61.460638297872340.139361702127660
311.51.52063829787234-0.0206382978723406
321.81.560638297872340.239361702127659
331.81.460638297872340.339361702127659
341.61.460638297872340.139361702127660
351.91.400638297872340.499361702127659
361.71.440638297872340.259361702127660
371.61.436524822695030.163475177304965
381.31.49652482269504-0.196524822695036
391.11.55652482269504-0.456524822695036
401.92.6554609929078-0.755460992907802
412.62.59546099290780.00453900709219863
422.32.6154609929078-0.315460992907801
432.42.6754609929078-0.275460992907802
442.22.7154609929078-0.515460992907801
4522.6154609929078-0.615460992907801
462.92.61546099290780.284539007092199
472.62.55546099290780.0445390070921986
482.32.5954609929078-0.295460992907802
492.32.59134751773050-0.291347517730496
502.62.65134751773050-0.0513475177304965
513.12.711347517730500.388652482269503
522.82.711347517730500.0886524822695034
532.52.65134751773050-0.151347517730497
542.92.671347517730500.228652482269504
553.12.731347517730500.368652482269504
563.12.771347517730500.328652482269503
573.22.671347517730500.528652482269503
582.52.67134751773050-0.171347517730496
592.62.61134751773050-0.0113475177304964
602.92.651347517730500.248652482269503


Parameters (Session):
par1 = 1 ; par2 = Include Monthly Dummies ; par3 = Linear Trend ;
Parameters (R input):
par1 = 1 ; par2 = Include Monthly Dummies ; par3 = Linear Trend ;
R code (references can be found in the software module):
library(lattice)
par1 <- as.numeric(par1)
x <- t(y)
k <- length(x[1,])
n <- length(x[,1])
x1 <- cbind(x[,par1], x[,1:k!=par1])
mycolnames <- c(colnames(x)[par1], colnames(x)[1:k!=par1])
colnames(x1) <- mycolnames #colnames(x)[par1]
x <- x1
if (par3 == 'First Differences'){
x2 <- array(0, dim=c(n-1,k), dimnames=list(1:(n-1), paste('(1-B)',colnames(x),sep='')))
for (i in 1:n-1) {
for (j in 1:k) {
x2[i,j] <- x[i+1,j] - x[i,j]
}
}
x <- x2
}
if (par2 == 'Include Monthly Dummies'){
x2 <- array(0, dim=c(n,11), dimnames=list(1:n, paste('M', seq(1:11), sep ='')))
for (i in 1:11){
x2[seq(i,n,12),i] <- 1
}
x <- cbind(x, x2)
}
if (par2 == 'Include Quarterly Dummies'){
x2 <- array(0, dim=c(n,3), dimnames=list(1:n, paste('Q', seq(1:3), sep ='')))
for (i in 1:3){
x2[seq(i,n,4),i] <- 1
}
x <- cbind(x, x2)
}
k <- length(x[1,])
if (par3 == 'Linear Trend'){
x <- cbind(x, c(1:n))
colnames(x)[k+1] <- 't'
}
x
k <- length(x[1,])
df <- as.data.frame(x)
(mylm <- lm(df))
(mysum <- summary(mylm))
bitmap(file='test0.png')
plot(x[,1], type='l', main='Actuals and Interpolation', ylab='value of Actuals and Interpolation (dots)', xlab='time or index')
points(x[,1]-mysum$resid)
grid()
dev.off()
bitmap(file='test1.png')
plot(mysum$resid, type='b', pch=19, main='Residuals', ylab='value of Residuals', xlab='time or index')
grid()
dev.off()
bitmap(file='test2.png')
hist(mysum$resid, main='Residual Histogram', xlab='values of Residuals')
grid()
dev.off()
bitmap(file='test3.png')
densityplot(~mysum$resid,col='black',main='Residual Density Plot', xlab='values of Residuals')
dev.off()
bitmap(file='test4.png')
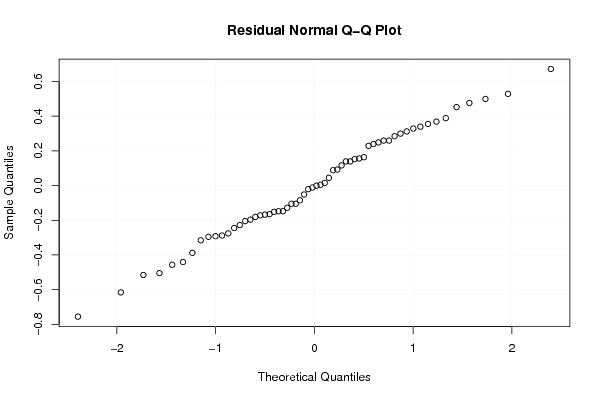
qqnorm(mysum$resid, main='Residual Normal Q-Q Plot')
grid()
dev.off()
(myerror <- as.ts(mysum$resid))
bitmap(file='test5.png')
dum <- cbind(lag(myerror,k=1),myerror)
dum
dum1 <- dum[2:length(myerror),]
dum1
z <- as.data.frame(dum1)
z
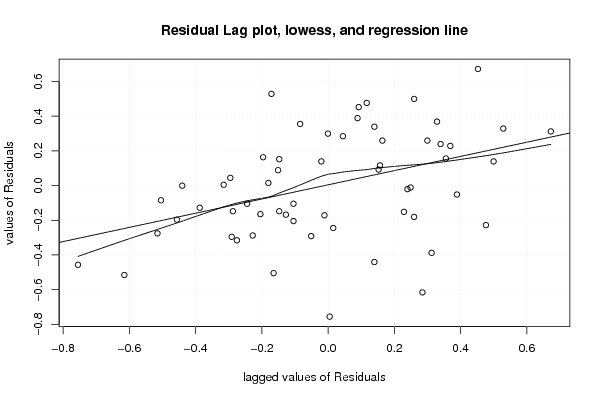
plot(z,main=paste('Residual Lag plot, lowess, and regression line'), ylab='values of Residuals', xlab='lagged values of Residuals')
lines(lowess(z))
abline(lm(z))
grid()
dev.off()
bitmap(file='test6.png')
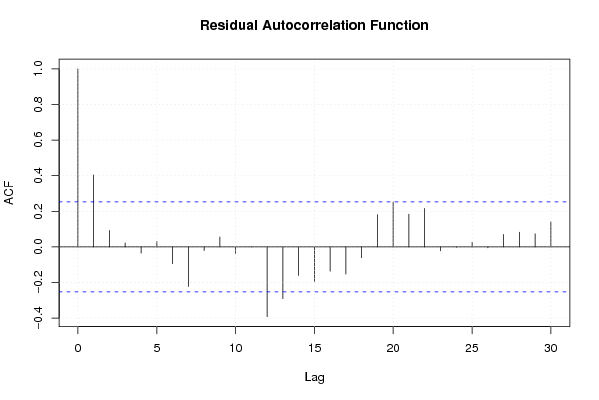
acf(mysum$resid, lag.max=length(mysum$resid)/2, main='Residual Autocorrelation Function')
grid()
dev.off()
bitmap(file='test7.png')
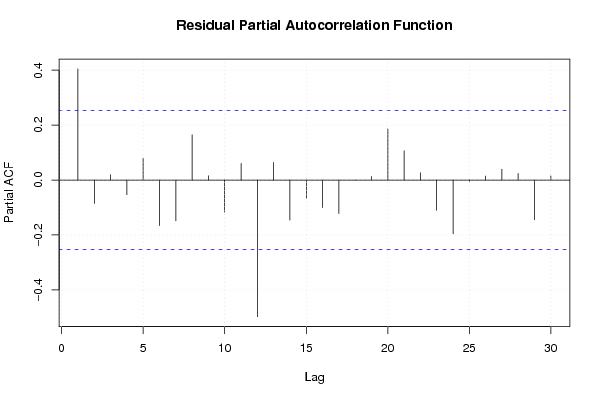
pacf(mysum$resid, lag.max=length(mysum$resid)/2, main='Residual Partial Autocorrelation Function')
grid()
dev.off()
bitmap(file='test8.png')
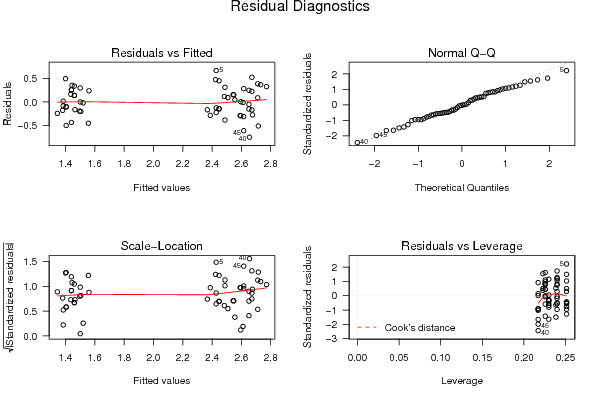
opar <- par(mfrow = c(2,2), oma = c(0, 0, 1.1, 0))
plot(mylm, las = 1, sub='Residual Diagnostics')
par(opar)
dev.off()
load(file='createtable')
a<-table.start()
a<-table.row.start(a)
a<-table.element(a, 'Multiple Linear Regression - Estimated Regression Equation', 1, TRUE)
a<-table.row.end(a)
myeq <- colnames(x)[1]
myeq <- paste(myeq, '[t] = ', sep='')
for (i in 1:k){
if (mysum$coefficients[i,1] > 0) myeq <- paste(myeq, '+', '')
myeq <- paste(myeq, mysum$coefficients[i,1], sep=' ')
if (rownames(mysum$coefficients)[i] != '(Intercept)') {
myeq <- paste(myeq, rownames(mysum$coefficients)[i], sep='')
if (rownames(mysum$coefficients)[i] != 't') myeq <- paste(myeq, '[t]', sep='')
}
}
myeq <- paste(myeq, ' + e[t]')
a<-table.row.start(a)
a<-table.element(a, myeq)
a<-table.row.end(a)
a<-table.end(a)
table.save(a,file='mytable1.tab')
a<-table.start()
a<-table.row.start(a)
a<-table.element(a,hyperlink('ols1.htm','Multiple Linear Regression - Ordinary Least Squares',''), 6, TRUE)
a<-table.row.end(a)
a<-table.row.start(a)
a<-table.element(a,'Variable',header=TRUE)
a<-table.element(a,'Parameter',header=TRUE)
a<-table.element(a,'S.D.',header=TRUE)
a<-table.element(a,'T-STAT
H0: parameter = 0',header=TRUE)
a<-table.element(a,'2-tail p-value',header=TRUE)
a<-table.element(a,'1-tail p-value',header=TRUE)
a<-table.row.end(a)
for (i in 1:k){
a<-table.row.start(a)
a<-table.element(a,rownames(mysum$coefficients)[i],header=TRUE)
a<-table.element(a,mysum$coefficients[i,1])
a<-table.element(a, round(mysum$coefficients[i,2],6))
a<-table.element(a, round(mysum$coefficients[i,3],4))
a<-table.element(a, round(mysum$coefficients[i,4],6))
a<-table.element(a, round(mysum$coefficients[i,4]/2,6))
a<-table.row.end(a)
}
a<-table.end(a)
table.save(a,file='mytable2.tab')
a<-table.start()
a<-table.row.start(a)
a<-table.element(a, 'Multiple Linear Regression - Regression Statistics', 2, TRUE)
a<-table.row.end(a)
a<-table.row.start(a)
a<-table.element(a, 'Multiple R',1,TRUE)
a<-table.element(a, sqrt(mysum$r.squared))
a<-table.row.end(a)
a<-table.row.start(a)
a<-table.element(a, 'R-squared',1,TRUE)
a<-table.element(a, mysum$r.squared)
a<-table.row.end(a)
a<-table.row.start(a)
a<-table.element(a, 'Adjusted R-squared',1,TRUE)
a<-table.element(a, mysum$adj.r.squared)
a<-table.row.end(a)
a<-table.row.start(a)
a<-table.element(a, 'F-TEST (value)',1,TRUE)
a<-table.element(a, mysum$fstatistic[1])
a<-table.row.end(a)
a<-table.row.start(a)
a<-table.element(a, 'F-TEST (DF numerator)',1,TRUE)
a<-table.element(a, mysum$fstatistic[2])
a<-table.row.end(a)
a<-table.row.start(a)
a<-table.element(a, 'F-TEST (DF denominator)',1,TRUE)
a<-table.element(a, mysum$fstatistic[3])
a<-table.row.end(a)
a<-table.row.start(a)
a<-table.element(a, 'p-value',1,TRUE)
a<-table.element(a, 1-pf(mysum$fstatistic[1],mysum$fstatistic[2],mysum$fstatistic[3]))
a<-table.row.end(a)
a<-table.row.start(a)
a<-table.element(a, 'Multiple Linear Regression - Residual Statistics', 2, TRUE)
a<-table.row.end(a)
a<-table.row.start(a)
a<-table.element(a, 'Residual Standard Deviation',1,TRUE)
a<-table.element(a, mysum$sigma)
a<-table.row.end(a)
a<-table.row.start(a)
a<-table.element(a, 'Sum Squared Residuals',1,TRUE)
a<-table.element(a, sum(myerror*myerror))
a<-table.row.end(a)
a<-table.end(a)
table.save(a,file='mytable3.tab')
a<-table.start()
a<-table.row.start(a)
a<-table.element(a, 'Multiple Linear Regression - Actuals, Interpolation, and Residuals', 4, TRUE)
a<-table.row.end(a)
a<-table.row.start(a)
a<-table.element(a, 'Time or Index', 1, TRUE)
a<-table.element(a, 'Actuals', 1, TRUE)
a<-table.element(a, 'Interpolation
Forecast', 1, TRUE)
a<-table.element(a, 'Residuals
Prediction Error', 1, TRUE)
a<-table.row.end(a)
for (i in 1:n) {
a<-table.row.start(a)
a<-table.element(a,i, 1, TRUE)
a<-table.element(a,x[i])
a<-table.element(a,x[i]-mysum$resid[i])
a<-table.element(a,mysum$resid[i])
a<-table.row.end(a)
}
a<-table.end(a)
table.save(a,file='mytable4.tab')