Free Statistics

of Irreproducible Research!

Author's title

Author*The author of this computation has been verified*
R Software Modulerwasp_hierarchicalclustering.wasp
Title produced by softwareHierarchical Clustering
Date of computationThu, 13 Nov 2008 10:31:34 -0700
Cite this page as followsStatistical Computations at FreeStatistics.org, Office for Research Development and Education, URL https://freestatistics.org/blog/index.php?v=date/2008/Nov/13/t1226597564ngdrtus1roqrl7f.htm/, Retrieved Mon, 20 May 2024 10:07:26 +0000
Statistical Computations at FreeStatistics.org, Office for Research Development and Education, URL https://freestatistics.org/blog/index.php?pk=24725, Retrieved Mon, 20 May 2024 10:07:26 +0000
QR Codes:

Original text written by user:
IsPrivate?No (this computation is public)
User-defined keywords
Estimated Impact151
Family? (F = Feedback message, R = changed R code, M = changed R Module, P = changed Parameters, D = changed Data)
F       [Hierarchical Clustering] [EDA various q2] [2008-11-13 17:31:34] [3452c99afdd85d4fde81272403cd85da] [Current]
Feedback Forum
2008-11-20 14:42:22 [Gert-Jan Geudens] [reply
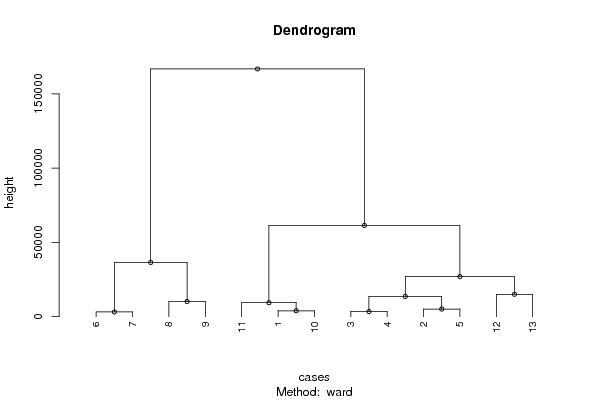
De student heeft geen conslusie gegeven. Via deze dendrogram of we de perioden in groepen kunnen indelen die gelijk zijn. Uit deze dendrogram merken we op dat de maanden 6,7,8 en 9 zich in dezelfde cluster bevinden en ze dus ongeveer hetzelfde zijn. De andere maanden bevinden zich in de andere cluster. we zouden wel willen opmerken dat de tijdreeksen van de student misschien niet zo goed geschikt zijn aangezien we hier over 13 maanden beschikken, waarvan 3 voor 2007 en 10 voor 2008. Het had beter geweest als de student gewoon bv de 12 maanden van 2006 en van 2007 gekozen had. Dan krijg je zeker geen vertekend beeld.
2008-11-24 20:14:17 [94a54c888ac7f7d6874c3108eb0e1808] [reply
De student heeft geen conclusie gegeven. Via een dendrogram kunnen we de perioden in groepen kunnen indelen die gelijk zijn. We merken inderdaad op dat de maanden 6,7,8 en 9 zich in dezelfde cluster bevinden en ze dus ongeveer hetzelfde zijn.

Post a new message
Dataseries X:
114971	307836	104263	527070
105531	300074	104241	509846
104919	304198	105141	514258
104782	306122	106018	516922
101281	300414	105866	507561
94545	292133	105944	492622
93248	290616	106379	490243
84031	280244	105082	469357
87486	285179	104915	477580
115867	305486	107026	528379
120327	305957	107306	533590
117008	293886	107051	517945
108811	289441	107922	506174


Summary of computational transaction
Raw Inputview raw input (R code)
Raw Outputview raw output of R engine
Computing time4 seconds
R Server'George Udny Yule' @ 72.249.76.132

\begin{tabular}{lllllllll}
\hline
Summary of computational transaction \tabularnewline
Raw Input & view raw input (R code)  \tabularnewline
Raw Output & view raw output of R engine  \tabularnewline
Computing time & 4 seconds \tabularnewline
R Server & 'George Udny Yule' @ 72.249.76.132 \tabularnewline
\hline
\end{tabular}
%Source: https://freestatistics.org/blog/index.php?pk=24725&T=0

[TABLE]
[ROW][C]Summary of computational transaction[/C][/ROW]
[ROW][C]Raw Input[/C][C]view raw input (R code) [/C][/ROW]
[ROW][C]Raw Output[/C][C]view raw output of R engine [/C][/ROW]
[ROW][C]Computing time[/C][C]4 seconds[/C][/ROW]
[ROW][C]R Server[/C][C]'George Udny Yule' @ 72.249.76.132[/C][/ROW]
[/TABLE]
Source: https://freestatistics.org/blog/index.php?pk=24725&T=0

Globally Unique Identifier (entire table): ba.freestatistics.org/blog/index.php?pk=24725&T=0

As an alternative you can also use a QR Code:  

The GUIDs for individual cells are displayed in the table below:

Summary of computational transaction
Raw Inputview raw input (R code)
Raw Outputview raw output of R engine
Computing time4 seconds
R Server'George Udny Yule' @ 72.249.76.132


Summary of Dendrogram
LabelHeight
13135.66005810579
23403.9051103108
33958.90969838919
45102.93542973062
59377.26049019384
610194.9432563404
713593.0808194382
815042.0715328707
926944.0007404107
1036502.2418324199
1161401.769795981
12166718.916901293

\begin{tabular}{lllllllll}
\hline
Summary of Dendrogram \tabularnewline
Label & Height \tabularnewline
1 & 3135.66005810579 \tabularnewline
2 & 3403.9051103108 \tabularnewline
3 & 3958.90969838919 \tabularnewline
4 & 5102.93542973062 \tabularnewline
5 & 9377.26049019384 \tabularnewline
6 & 10194.9432563404 \tabularnewline
7 & 13593.0808194382 \tabularnewline
8 & 15042.0715328707 \tabularnewline
9 & 26944.0007404107 \tabularnewline
10 & 36502.2418324199 \tabularnewline
11 & 61401.769795981 \tabularnewline
12 & 166718.916901293 \tabularnewline
\hline
\end{tabular}
%Source: https://freestatistics.org/blog/index.php?pk=24725&T=1

[TABLE]
[ROW][C]Summary of Dendrogram[/C][/ROW]
[ROW][C]Label[/C][C]Height[/C][/ROW]
[ROW][C]1[/C][C]3135.66005810579[/C][/ROW]
[ROW][C]2[/C][C]3403.9051103108[/C][/ROW]
[ROW][C]3[/C][C]3958.90969838919[/C][/ROW]
[ROW][C]4[/C][C]5102.93542973062[/C][/ROW]
[ROW][C]5[/C][C]9377.26049019384[/C][/ROW]
[ROW][C]6[/C][C]10194.9432563404[/C][/ROW]
[ROW][C]7[/C][C]13593.0808194382[/C][/ROW]
[ROW][C]8[/C][C]15042.0715328707[/C][/ROW]
[ROW][C]9[/C][C]26944.0007404107[/C][/ROW]
[ROW][C]10[/C][C]36502.2418324199[/C][/ROW]
[ROW][C]11[/C][C]61401.769795981[/C][/ROW]
[ROW][C]12[/C][C]166718.916901293[/C][/ROW]
[/TABLE]
Source: https://freestatistics.org/blog/index.php?pk=24725&T=1

Globally Unique Identifier (entire table): ba.freestatistics.org/blog/index.php?pk=24725&T=1

As an alternative you can also use a QR Code:  

The GUIDs for individual cells are displayed in the table below:

Summary of Dendrogram
LabelHeight
13135.66005810579
23403.9051103108
33958.90969838919
45102.93542973062
59377.26049019384
610194.9432563404
713593.0808194382
815042.0715328707
926944.0007404107
1036502.2418324199
1161401.769795981
12166718.916901293


Parameters (Session):
par1 = ward ; par2 = ALL ; par3 = FALSE ; par4 = FALSE ;
Parameters (R input):
par1 = ward ; par2 = ALL ; par3 = FALSE ; par4 = FALSE ;
R code (references can be found in the software module):
par3 <- as.logical(par3)
par4 <- as.logical(par4)
if (par3 == 'TRUE'){
dum = xlab
xlab = ylab
ylab = dum
}
x <- t(y)
hc <- hclust(dist(x),method=par1)
d <- as.dendrogram(hc)
str(d)
mysub <- paste('Method: ',par1)
bitmap(file='test1.png')
if (par4 == 'TRUE'){
plot(d,main=main,ylab=ylab,xlab=xlab,horiz=par3, nodePar=list(pch = c(1,NA), cex=0.8, lab.cex = 0.8),type='t',center=T, sub=mysub)
} else {
plot(d,main=main,ylab=ylab,xlab=xlab,horiz=par3, nodePar=list(pch = c(1,NA), cex=0.8, lab.cex = 0.8), sub=mysub)
}
dev.off()
if (par2 != 'ALL'){
if (par3 == 'TRUE'){
ylab = 'cluster'
} else {
xlab = 'cluster'
}
par2 <- as.numeric(par2)
memb <- cutree(hc, k = par2)
cent <- NULL
for(k in 1:par2){
cent <- rbind(cent, colMeans(x[memb == k, , drop = FALSE]))
}
hc1 <- hclust(dist(cent),method=par1, members = table(memb))
de <- as.dendrogram(hc1)
bitmap(file='test2.png')
if (par4 == 'TRUE'){
plot(de,main=main,ylab=ylab,xlab=xlab,horiz=par3, nodePar=list(pch = c(1,NA), cex=0.8, lab.cex = 0.8),type='t',center=T, sub=mysub)
} else {
plot(de,main=main,ylab=ylab,xlab=xlab,horiz=par3, nodePar=list(pch = c(1,NA), cex=0.8, lab.cex = 0.8), sub=mysub)
}
dev.off()
str(de)
}
load(file='createtable')
a<-table.start()
a<-table.row.start(a)
a<-table.element(a,'Summary of Dendrogram',2,TRUE)
a<-table.row.end(a)
a<-table.row.start(a)
a<-table.element(a,'Label',header=TRUE)
a<-table.element(a,'Height',header=TRUE)
a<-table.row.end(a)
num <- length(x[,1])-1
for (i in 1:num)
{
a<-table.row.start(a)
a<-table.element(a,hc$labels[i])
a<-table.element(a,hc$height[i])
a<-table.row.end(a)
}
a<-table.end(a)
table.save(a,file='mytable1.tab')
if (par2 != 'ALL'){
a<-table.start()
a<-table.row.start(a)
a<-table.element(a,'Summary of Cut Dendrogram',2,TRUE)
a<-table.row.end(a)
a<-table.row.start(a)
a<-table.element(a,'Label',header=TRUE)
a<-table.element(a,'Height',header=TRUE)
a<-table.row.end(a)
num <- par2-1
for (i in 1:num)
{
a<-table.row.start(a)
a<-table.element(a,i)
a<-table.element(a,hc1$height[i])
a<-table.row.end(a)
}
a<-table.end(a)
table.save(a,file='mytable2.tab')
}