Free Statistics

of Irreproducible Research!

Author's title

Author*The author of this computation has been verified*
R Software Modulerwasp_cloud.wasp
Title produced by softwareTrivariate Scatterplots
Date of computationWed, 12 Nov 2008 04:59:59 -0700
Cite this page as followsStatistical Computations at FreeStatistics.org, Office for Research Development and Education, URL https://freestatistics.org/blog/index.php?v=date/2008/Nov/12/t12264913249189fajfogvs2jp.htm/, Retrieved Mon, 20 May 2024 11:18:00 +0000
Statistical Computations at FreeStatistics.org, Office for Research Development and Education, URL https://freestatistics.org/blog/index.php?pk=24138, Retrieved Mon, 20 May 2024 11:18:00 +0000
QR Codes:

Original text written by user:
IsPrivate?No (this computation is public)
User-defined keywords
Estimated Impact152
Family? (F = Feedback message, R = changed R code, M = changed R Module, P = changed Parameters, D = changed Data)
F       [Trivariate Scatterplots] [Trivariate Correl...] [2008-11-12 11:59:59] [c5d6d05aee6be5527ac4a30a8c3b8fe5] [Current]
Feedback Forum
2008-11-18 13:33:46 [Julie Govaerts] [reply
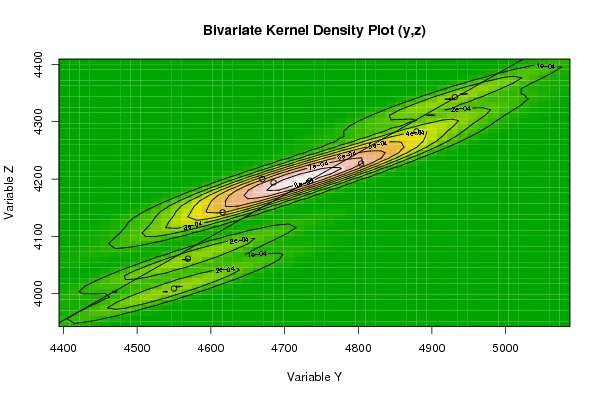
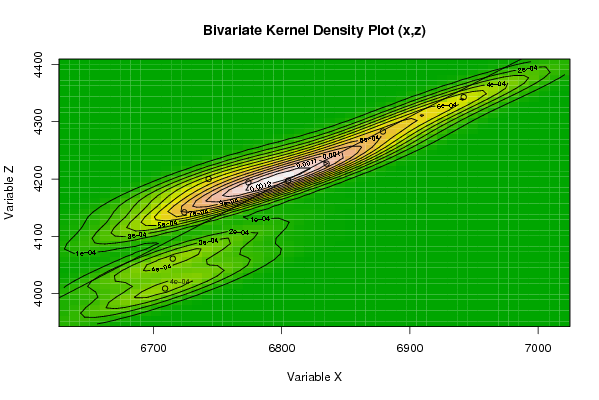
1) bibariate kernell density plot
een punten wolk en er wordt ook een lijn getekend zo dicht mogelijk bij de puntenwolk
bevatten clusters = grotere groepen van gegevens --> onderzoeken welk deel van je tijdsreeks verantwoordelijk is voor een bepaalde puntenwolk
bv cirkelvormig = een correlatie van 0
wordt meer gebruikt om te verkennen

uit de kernell density plot kunnen we afleiden dat er een positief verband bestaat tussen XenZ, YenZ en XenY (niet perfect)

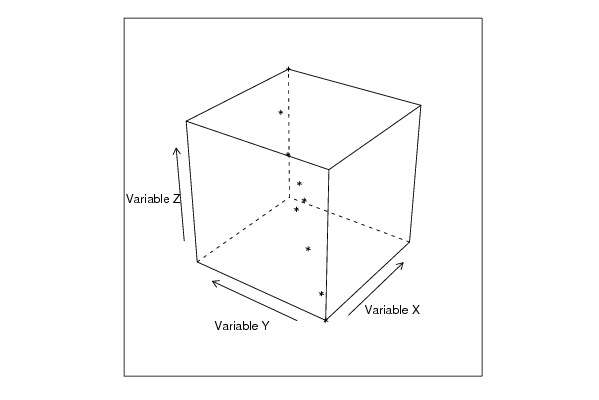
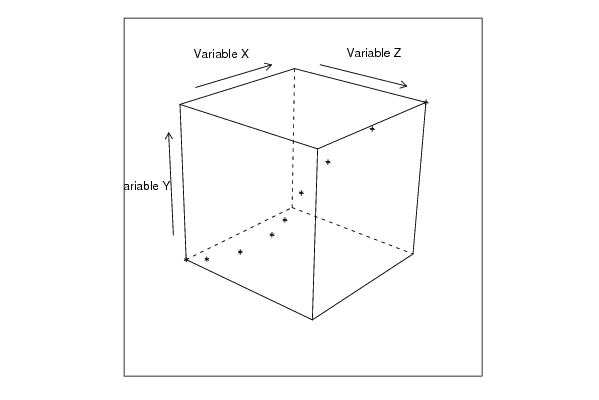
2)trivariate scatterplot --> 3dimensioneel het verband tussen 3 variabelen tonen, kan makkelijk vanuit verschillende perspectieven bekeken worden = invalshoeken en zo andere dingen ontdekken
het nadeel is dat de driedimensionele kubus geprojecteerd wordt op een tweedimensioneel scherm -> het zou ideaal zijn moesten we de kubus dus echt in zijn driedimensionale vorm zien want nu vallen er gegevens weg = worden vertekend
2008-11-22 14:29:31 [c00776cbed2786c9c4960950021bd861] [reply
Trivariate scatterplot:
De 3 variabelen correleren inderdaad positief. Je kan dit goed zien in de trivariate scatterplot omdat de punten ongeveer op een rechte liggen, wat wijst op een hoge correlatie.
In de kubussen (3-dimensionaal)kunnen we vanuit verschillende perpectieven zien hoe de 3 variabelen gelijktijdig zijn gecorreleerd. De punten liggen ongeveer op een rechte (wel af en toe een uitschieter).
Bivariate density plot:
Hierdoor worden er weer 3-dimensies gesuggereerd door de hoogtelijnen.
De grootste concentratie van de punten ligt altijd zeer dicht bij de regressielijn, wat weer kan wijzen op een hoge correlatie!
Dit had dus nog handig kunnen zijn voor je conclusie.
2008-11-24 21:51:44 [Erik Geysen] [reply
We willen het verband tussen 3 variabelen tegelijkertijd. Men gaat de 3D kubus projecteren op een plat scherm (2D). Er gaat dan echter informatie verloren.
Als je de rotatie van de 3D kubus verandert kan je eventueel andere verbanden waarnemen. De 2D scatterplots zijn dus de projecties van de 3D kubus. Zoals al gezegd gaat er dan steeds 1 dimensie verloren. Toch kunnen we hier nuttige informatie uithalen.
De punten v alle variabelen liggen bijna op een rechte lijn wat wilt zeggen dat er voor deze variabelen wel degelijk een positief verband bestaat.

Post a new message
Dataseries X:
6942
6879
6835
6805
6774
6743
6724
6715
6709
Dataseries Y:
4931
4879
4804
4735
4685
4670
4616
4569
4550
Dataseries Z:
4343
4283
4227
4197
4194
4200
4142
4061
4009


Summary of computational transaction
Raw Inputview raw input (R code)
Raw Outputview raw output of R engine
Computing time7 seconds
R Server'George Udny Yule' @ 72.249.76.132

\begin{tabular}{lllllllll}
\hline
Summary of computational transaction \tabularnewline
Raw Input & view raw input (R code)  \tabularnewline
Raw Output & view raw output of R engine  \tabularnewline
Computing time & 7 seconds \tabularnewline
R Server & 'George Udny Yule' @ 72.249.76.132 \tabularnewline
\hline
\end{tabular}
%Source: https://freestatistics.org/blog/index.php?pk=24138&T=0

[TABLE]
[ROW][C]Summary of computational transaction[/C][/ROW]
[ROW][C]Raw Input[/C][C]view raw input (R code) [/C][/ROW]
[ROW][C]Raw Output[/C][C]view raw output of R engine [/C][/ROW]
[ROW][C]Computing time[/C][C]7 seconds[/C][/ROW]
[ROW][C]R Server[/C][C]'George Udny Yule' @ 72.249.76.132[/C][/ROW]
[/TABLE]
Source: https://freestatistics.org/blog/index.php?pk=24138&T=0

Globally Unique Identifier (entire table): ba.freestatistics.org/blog/index.php?pk=24138&T=0

As an alternative you can also use a QR Code:  

The GUIDs for individual cells are displayed in the table below:

Summary of computational transaction
Raw Inputview raw input (R code)
Raw Outputview raw output of R engine
Computing time7 seconds
R Server'George Udny Yule' @ 72.249.76.132


Parameters (Session):
par1 = 50 ; par2 = 50 ; par3 = Y ; par4 = Y ; par5 = Variable X ; par6 = Variable Y ; par7 = Variable Z ;
Parameters (R input):
par1 = 50 ; par2 = 50 ; par3 = Y ; par4 = Y ; par5 = Variable X ; par6 = Variable Y ; par7 = Variable Z ;
R code (references can be found in the software module):
x <- array(x,dim=c(length(x),1))
colnames(x) <- par5
y <- array(y,dim=c(length(y),1))
colnames(y) <- par6
z <- array(z,dim=c(length(z),1))
colnames(z) <- par7
d <- data.frame(cbind(z,y,x))
colnames(d) <- list(par7,par6,par5)
par1 <- as.numeric(par1)
par2 <- as.numeric(par2)
if (par1>500) par1 <- 500
if (par2>500) par2 <- 500
if (par1<10) par1 <- 10
if (par2<10) par2 <- 10
library(GenKern)
library(lattice)
panel.hist <- function(x, ...)
{
usr <- par('usr'); on.exit(par(usr))
par(usr = c(usr[1:2], 0, 1.5) )
h <- hist(x, plot = FALSE)
breaks <- h$breaks; nB <- length(breaks)
y <- h$counts; y <- y/max(y)
rect(breaks[-nB], 0, breaks[-1], y, col='black', ...)
}
bitmap(file='cloud1.png')
cloud(z~x*y, screen = list(x=-45, y=45, z=35),xlab=par5,ylab=par6,zlab=par7)
dev.off()
bitmap(file='cloud2.png')
cloud(z~x*y, screen = list(x=35, y=45, z=25),xlab=par5,ylab=par6,zlab=par7)
dev.off()
bitmap(file='cloud3.png')
cloud(z~x*y, screen = list(x=35, y=-25, z=90),xlab=par5,ylab=par6,zlab=par7)
dev.off()
bitmap(file='pairs.png')
pairs(d,diag.panel=panel.hist)
dev.off()
x <- as.vector(x)
y <- as.vector(y)
z <- as.vector(z)
bitmap(file='bidensity1.png')
op <- KernSur(x,y, xgridsize=par1, ygridsize=par2, correlation=cor(x,y), xbandwidth=dpik(x), ybandwidth=dpik(y))
image(op$xords, op$yords, op$zden, col=terrain.colors(100), axes=TRUE,main='Bivariate Kernel Density Plot (x,y)',xlab=par5,ylab=par6)
if (par3=='Y') contour(op$xords, op$yords, op$zden, add=TRUE)
if (par4=='Y') points(x,y)
(r<-lm(y ~ x))
abline(r)
box()
dev.off()
bitmap(file='bidensity2.png')
op <- KernSur(y,z, xgridsize=par1, ygridsize=par2, correlation=cor(y,z), xbandwidth=dpik(y), ybandwidth=dpik(z))
op
image(op$xords, op$yords, op$zden, col=terrain.colors(100), axes=TRUE,main='Bivariate Kernel Density Plot (y,z)',xlab=par6,ylab=par7)
if (par3=='Y') contour(op$xords, op$yords, op$zden, add=TRUE)
if (par4=='Y') points(y,z)
(r<-lm(z ~ y))
abline(r)
box()
dev.off()
bitmap(file='bidensity3.png')
op <- KernSur(x,z, xgridsize=par1, ygridsize=par2, correlation=cor(x,z), xbandwidth=dpik(x), ybandwidth=dpik(z))
op
image(op$xords, op$yords, op$zden, col=terrain.colors(100), axes=TRUE,main='Bivariate Kernel Density Plot (x,z)',xlab=par5,ylab=par7)
if (par3=='Y') contour(op$xords, op$yords, op$zden, add=TRUE)
if (par4=='Y') points(x,z)
(r<-lm(z ~ x))
abline(r)
box()
dev.off()