Free Statistics

of Irreproducible Research!

Author's title

Author*The author of this computation has been verified*
R Software Modulerwasp_hierarchicalclustering.wasp
Title produced by softwareHierarchical Clustering
Date of computationTue, 11 Nov 2008 06:21:01 -0700
Cite this page as followsStatistical Computations at FreeStatistics.org, Office for Research Development and Education, URL https://freestatistics.org/blog/index.php?v=date/2008/Nov/11/t1226409743g4yutym1pwafxle.htm/, Retrieved Mon, 20 May 2024 03:44:44 +0000
Statistical Computations at FreeStatistics.org, Office for Research Development and Education, URL https://freestatistics.org/blog/index.php?pk=23449, Retrieved Mon, 20 May 2024 03:44:44 +0000
QR Codes:

Original text written by user:
IsPrivate?No (this computation is public)
User-defined keywords
Estimated Impact120
Family? (F = Feedback message, R = changed R code, M = changed R Module, P = changed Parameters, D = changed Data)
-       [Hierarchical Clustering] [Hierarchical clus...] [2008-11-11 13:21:01] [02e7fb326979b65614900650d62c19a6] [Current]
Feedback Forum

Post a new message
Dataseries X:
2333.3
2282.2
2458.2
2345.5
2065.2
2332.5
2077.5
1691.4
2381.9
2526
2212.1
2459.9
2178.8
2318.2
2661.8
2407.9
2040.6
2601.6
2106.3
1829.9
2546.1
2363
2435.8
2668
2316.9
2324.2
2610.8
2413.2
2345.2
2590.8
2132.1
1990.7
2641.7
2437.1
2649.2
2819.4
2405.6
2451.3
2878.5
2534.1
2670.6
2909.7
2261.8
2135.3
2870.4
2803.2
2775.1
2633.7
2930.6
2779.7
3039.2
2752.7
2743.1
2914
2711.9
2295.8
2840.6
3230.5
2761.1
2769.6


Summary of computational transaction
Raw Inputview raw input (R code)
Raw Outputview raw output of R engine
Computing time2 seconds
R Server'Sir Ronald Aylmer Fisher' @ 193.190.124.24

\begin{tabular}{lllllllll}
\hline
Summary of computational transaction \tabularnewline
Raw Input & view raw input (R code)  \tabularnewline
Raw Output & view raw output of R engine  \tabularnewline
Computing time & 2 seconds \tabularnewline
R Server & 'Sir Ronald Aylmer Fisher' @ 193.190.124.24 \tabularnewline
\hline
\end{tabular}
%Source: https://freestatistics.org/blog/index.php?pk=23449&T=0

[TABLE]
[ROW][C]Summary of computational transaction[/C][/ROW]
[ROW][C]Raw Input[/C][C]view raw input (R code) [/C][/ROW]
[ROW][C]Raw Output[/C][C]view raw output of R engine [/C][/ROW]
[ROW][C]Computing time[/C][C]2 seconds[/C][/ROW]
[ROW][C]R Server[/C][C]'Sir Ronald Aylmer Fisher' @ 193.190.124.24[/C][/ROW]
[/TABLE]
Source: https://freestatistics.org/blog/index.php?pk=23449&T=0

Globally Unique Identifier (entire table): ba.freestatistics.org/blog/index.php?pk=23449&T=0

As an alternative you can also use a QR Code:  

The GUIDs for individual cells are displayed in the table below:

Summary of computational transaction
Raw Inputview raw input (R code)
Raw Outputview raw output of R engine
Computing time2 seconds
R Server'Sir Ronald Aylmer Fisher' @ 193.190.124.24


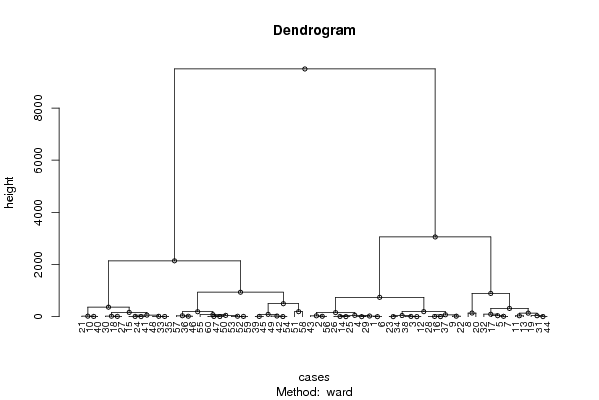
Summary of Dendrogram
LabelHeight
10.300000000000182
20.800000000000182
31.29999999999973
41.29999999999973
51.70000000000027
62.30000000000018
72.59999999999991
83.20000000000027
94.30000000000018
104.59999999999991
117.5
127.83333333333303
138.09999999999991
148.09999999999991
158.40000000000009
168.43333333333324
178.86666666666664
189.13333333333306
199.20000000000027
209.76666666666627
2112.3000000000002
2213.1666666666667
2313.6000000000004
2415.5999999999999
2516.2000000000003
2617.4666666666664
2718.7000000000000
2818.9000000000001
2923.5666666666666
3024.3499999999995
3131.733333333333
3233.2999999999997
3333.6666666666665
3435.4666666666664
3536.8999999999999
3642.6733333333335
3748.7666666666667
3849.9023809523815
3959.6000000000008
4072.0866666666664
4176.2238095238092
4288.753333333333
4393.2999999999998
44134.673333333333
45138.5
46156.500952380952
47163.955555555555
48188.916190476191
49191.3
50192.420000000001
51315.304444444445
52364.044444444445
53496.894285714286
54740.35
55890.5101010101
56937.092773109244
572140.33455037187
583055.65029325513
599498.20688542825

\begin{tabular}{lllllllll}
\hline
Summary of Dendrogram \tabularnewline
Label & Height \tabularnewline
1 & 0.300000000000182 \tabularnewline
2 & 0.800000000000182 \tabularnewline
3 & 1.29999999999973 \tabularnewline
4 & 1.29999999999973 \tabularnewline
5 & 1.70000000000027 \tabularnewline
6 & 2.30000000000018 \tabularnewline
7 & 2.59999999999991 \tabularnewline
8 & 3.20000000000027 \tabularnewline
9 & 4.30000000000018 \tabularnewline
10 & 4.59999999999991 \tabularnewline
11 & 7.5 \tabularnewline
12 & 7.83333333333303 \tabularnewline
13 & 8.09999999999991 \tabularnewline
14 & 8.09999999999991 \tabularnewline
15 & 8.40000000000009 \tabularnewline
16 & 8.43333333333324 \tabularnewline
17 & 8.86666666666664 \tabularnewline
18 & 9.13333333333306 \tabularnewline
19 & 9.20000000000027 \tabularnewline
20 & 9.76666666666627 \tabularnewline
21 & 12.3000000000002 \tabularnewline
22 & 13.1666666666667 \tabularnewline
23 & 13.6000000000004 \tabularnewline
24 & 15.5999999999999 \tabularnewline
25 & 16.2000000000003 \tabularnewline
26 & 17.4666666666664 \tabularnewline
27 & 18.7000000000000 \tabularnewline
28 & 18.9000000000001 \tabularnewline
29 & 23.5666666666666 \tabularnewline
30 & 24.3499999999995 \tabularnewline
31 & 31.733333333333 \tabularnewline
32 & 33.2999999999997 \tabularnewline
33 & 33.6666666666665 \tabularnewline
34 & 35.4666666666664 \tabularnewline
35 & 36.8999999999999 \tabularnewline
36 & 42.6733333333335 \tabularnewline
37 & 48.7666666666667 \tabularnewline
38 & 49.9023809523815 \tabularnewline
39 & 59.6000000000008 \tabularnewline
40 & 72.0866666666664 \tabularnewline
41 & 76.2238095238092 \tabularnewline
42 & 88.753333333333 \tabularnewline
43 & 93.2999999999998 \tabularnewline
44 & 134.673333333333 \tabularnewline
45 & 138.5 \tabularnewline
46 & 156.500952380952 \tabularnewline
47 & 163.955555555555 \tabularnewline
48 & 188.916190476191 \tabularnewline
49 & 191.3 \tabularnewline
50 & 192.420000000001 \tabularnewline
51 & 315.304444444445 \tabularnewline
52 & 364.044444444445 \tabularnewline
53 & 496.894285714286 \tabularnewline
54 & 740.35 \tabularnewline
55 & 890.5101010101 \tabularnewline
56 & 937.092773109244 \tabularnewline
57 & 2140.33455037187 \tabularnewline
58 & 3055.65029325513 \tabularnewline
59 & 9498.20688542825 \tabularnewline
\hline
\end{tabular}
%Source: https://freestatistics.org/blog/index.php?pk=23449&T=1

[TABLE]
[ROW][C]Summary of Dendrogram[/C][/ROW]
[ROW][C]Label[/C][C]Height[/C][/ROW]
[ROW][C]1[/C][C]0.300000000000182[/C][/ROW]
[ROW][C]2[/C][C]0.800000000000182[/C][/ROW]
[ROW][C]3[/C][C]1.29999999999973[/C][/ROW]
[ROW][C]4[/C][C]1.29999999999973[/C][/ROW]
[ROW][C]5[/C][C]1.70000000000027[/C][/ROW]
[ROW][C]6[/C][C]2.30000000000018[/C][/ROW]
[ROW][C]7[/C][C]2.59999999999991[/C][/ROW]
[ROW][C]8[/C][C]3.20000000000027[/C][/ROW]
[ROW][C]9[/C][C]4.30000000000018[/C][/ROW]
[ROW][C]10[/C][C]4.59999999999991[/C][/ROW]
[ROW][C]11[/C][C]7.5[/C][/ROW]
[ROW][C]12[/C][C]7.83333333333303[/C][/ROW]
[ROW][C]13[/C][C]8.09999999999991[/C][/ROW]
[ROW][C]14[/C][C]8.09999999999991[/C][/ROW]
[ROW][C]15[/C][C]8.40000000000009[/C][/ROW]
[ROW][C]16[/C][C]8.43333333333324[/C][/ROW]
[ROW][C]17[/C][C]8.86666666666664[/C][/ROW]
[ROW][C]18[/C][C]9.13333333333306[/C][/ROW]
[ROW][C]19[/C][C]9.20000000000027[/C][/ROW]
[ROW][C]20[/C][C]9.76666666666627[/C][/ROW]
[ROW][C]21[/C][C]12.3000000000002[/C][/ROW]
[ROW][C]22[/C][C]13.1666666666667[/C][/ROW]
[ROW][C]23[/C][C]13.6000000000004[/C][/ROW]
[ROW][C]24[/C][C]15.5999999999999[/C][/ROW]
[ROW][C]25[/C][C]16.2000000000003[/C][/ROW]
[ROW][C]26[/C][C]17.4666666666664[/C][/ROW]
[ROW][C]27[/C][C]18.7000000000000[/C][/ROW]
[ROW][C]28[/C][C]18.9000000000001[/C][/ROW]
[ROW][C]29[/C][C]23.5666666666666[/C][/ROW]
[ROW][C]30[/C][C]24.3499999999995[/C][/ROW]
[ROW][C]31[/C][C]31.733333333333[/C][/ROW]
[ROW][C]32[/C][C]33.2999999999997[/C][/ROW]
[ROW][C]33[/C][C]33.6666666666665[/C][/ROW]
[ROW][C]34[/C][C]35.4666666666664[/C][/ROW]
[ROW][C]35[/C][C]36.8999999999999[/C][/ROW]
[ROW][C]36[/C][C]42.6733333333335[/C][/ROW]
[ROW][C]37[/C][C]48.7666666666667[/C][/ROW]
[ROW][C]38[/C][C]49.9023809523815[/C][/ROW]
[ROW][C]39[/C][C]59.6000000000008[/C][/ROW]
[ROW][C]40[/C][C]72.0866666666664[/C][/ROW]
[ROW][C]41[/C][C]76.2238095238092[/C][/ROW]
[ROW][C]42[/C][C]88.753333333333[/C][/ROW]
[ROW][C]43[/C][C]93.2999999999998[/C][/ROW]
[ROW][C]44[/C][C]134.673333333333[/C][/ROW]
[ROW][C]45[/C][C]138.5[/C][/ROW]
[ROW][C]46[/C][C]156.500952380952[/C][/ROW]
[ROW][C]47[/C][C]163.955555555555[/C][/ROW]
[ROW][C]48[/C][C]188.916190476191[/C][/ROW]
[ROW][C]49[/C][C]191.3[/C][/ROW]
[ROW][C]50[/C][C]192.420000000001[/C][/ROW]
[ROW][C]51[/C][C]315.304444444445[/C][/ROW]
[ROW][C]52[/C][C]364.044444444445[/C][/ROW]
[ROW][C]53[/C][C]496.894285714286[/C][/ROW]
[ROW][C]54[/C][C]740.35[/C][/ROW]
[ROW][C]55[/C][C]890.5101010101[/C][/ROW]
[ROW][C]56[/C][C]937.092773109244[/C][/ROW]
[ROW][C]57[/C][C]2140.33455037187[/C][/ROW]
[ROW][C]58[/C][C]3055.65029325513[/C][/ROW]
[ROW][C]59[/C][C]9498.20688542825[/C][/ROW]
[/TABLE]
Source: https://freestatistics.org/blog/index.php?pk=23449&T=1

Globally Unique Identifier (entire table): ba.freestatistics.org/blog/index.php?pk=23449&T=1

As an alternative you can also use a QR Code:  

The GUIDs for individual cells are displayed in the table below:

Summary of Dendrogram
LabelHeight
10.300000000000182
20.800000000000182
31.29999999999973
41.29999999999973
51.70000000000027
62.30000000000018
72.59999999999991
83.20000000000027
94.30000000000018
104.59999999999991
117.5
127.83333333333303
138.09999999999991
148.09999999999991
158.40000000000009
168.43333333333324
178.86666666666664
189.13333333333306
199.20000000000027
209.76666666666627
2112.3000000000002
2213.1666666666667
2313.6000000000004
2415.5999999999999
2516.2000000000003
2617.4666666666664
2718.7000000000000
2818.9000000000001
2923.5666666666666
3024.3499999999995
3131.733333333333
3233.2999999999997
3333.6666666666665
3435.4666666666664
3536.8999999999999
3642.6733333333335
3748.7666666666667
3849.9023809523815
3959.6000000000008
4072.0866666666664
4176.2238095238092
4288.753333333333
4393.2999999999998
44134.673333333333
45138.5
46156.500952380952
47163.955555555555
48188.916190476191
49191.3
50192.420000000001
51315.304444444445
52364.044444444445
53496.894285714286
54740.35
55890.5101010101
56937.092773109244
572140.33455037187
583055.65029325513
599498.20688542825


Parameters (Session):
par1 = ward ; par2 = ALL ; par3 = FALSE ; par4 = FALSE ;
Parameters (R input):
par1 = ward ; par2 = ALL ; par3 = FALSE ; par4 = FALSE ;
R code (references can be found in the software module):
par3 <- as.logical(par3)
par4 <- as.logical(par4)
if (par3 == 'TRUE'){
dum = xlab
xlab = ylab
ylab = dum
}
x <- t(y)
hc <- hclust(dist(x),method=par1)
d <- as.dendrogram(hc)
str(d)
mysub <- paste('Method: ',par1)
bitmap(file='test1.png')
if (par4 == 'TRUE'){
plot(d,main=main,ylab=ylab,xlab=xlab,horiz=par3, nodePar=list(pch = c(1,NA), cex=0.8, lab.cex = 0.8),type='t',center=T, sub=mysub)
} else {
plot(d,main=main,ylab=ylab,xlab=xlab,horiz=par3, nodePar=list(pch = c(1,NA), cex=0.8, lab.cex = 0.8), sub=mysub)
}
dev.off()
if (par2 != 'ALL'){
if (par3 == 'TRUE'){
ylab = 'cluster'
} else {
xlab = 'cluster'
}
par2 <- as.numeric(par2)
memb <- cutree(hc, k = par2)
cent <- NULL
for(k in 1:par2){
cent <- rbind(cent, colMeans(x[memb == k, , drop = FALSE]))
}
hc1 <- hclust(dist(cent),method=par1, members = table(memb))
de <- as.dendrogram(hc1)
bitmap(file='test2.png')
if (par4 == 'TRUE'){
plot(de,main=main,ylab=ylab,xlab=xlab,horiz=par3, nodePar=list(pch = c(1,NA), cex=0.8, lab.cex = 0.8),type='t',center=T, sub=mysub)
} else {
plot(de,main=main,ylab=ylab,xlab=xlab,horiz=par3, nodePar=list(pch = c(1,NA), cex=0.8, lab.cex = 0.8), sub=mysub)
}
dev.off()
str(de)
}
load(file='createtable')
a<-table.start()
a<-table.row.start(a)
a<-table.element(a,'Summary of Dendrogram',2,TRUE)
a<-table.row.end(a)
a<-table.row.start(a)
a<-table.element(a,'Label',header=TRUE)
a<-table.element(a,'Height',header=TRUE)
a<-table.row.end(a)
num <- length(x[,1])-1
for (i in 1:num)
{
a<-table.row.start(a)
a<-table.element(a,hc$labels[i])
a<-table.element(a,hc$height[i])
a<-table.row.end(a)
}
a<-table.end(a)
table.save(a,file='mytable1.tab')
if (par2 != 'ALL'){
a<-table.start()
a<-table.row.start(a)
a<-table.element(a,'Summary of Cut Dendrogram',2,TRUE)
a<-table.row.end(a)
a<-table.row.start(a)
a<-table.element(a,'Label',header=TRUE)
a<-table.element(a,'Height',header=TRUE)
a<-table.row.end(a)
num <- par2-1
for (i in 1:num)
{
a<-table.row.start(a)
a<-table.element(a,i)
a<-table.element(a,hc1$height[i])
a<-table.row.end(a)
}
a<-table.end(a)
table.save(a,file='mytable2.tab')
}