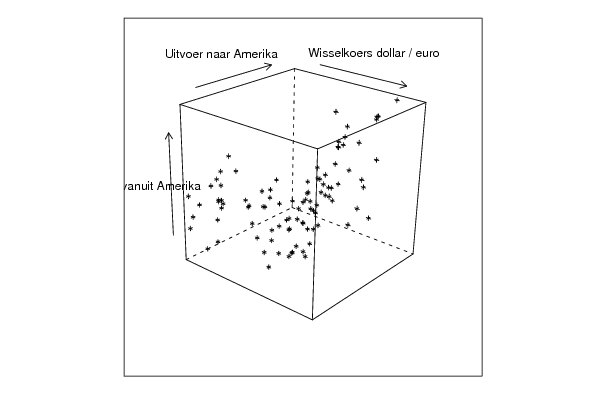
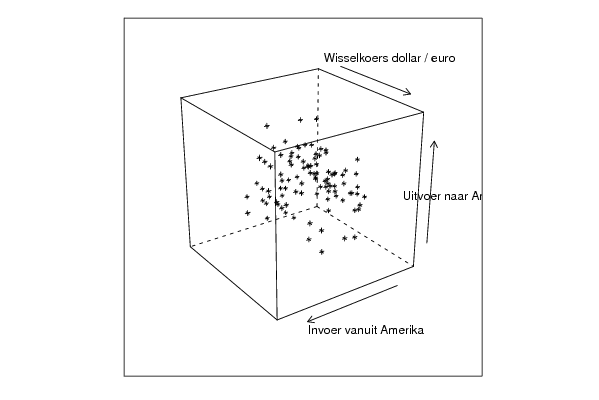
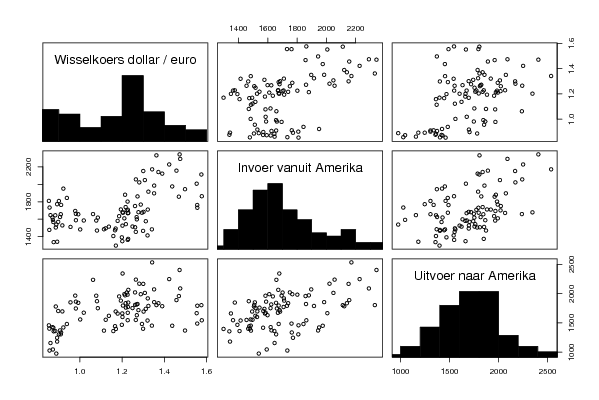
Free Statistics

of Irreproducible Research!

Author's title

Author*The author of this computation has been verified*
R Software Modulerwasp_cloud.wasp
Title produced by softwareTrivariate Scatterplots
Date of computationTue, 11 Nov 2008 06:04:21 -0700
Cite this page as followsStatistical Computations at FreeStatistics.org, Office for Research Development and Education, URL https://freestatistics.org/blog/index.php?v=date/2008/Nov/11/t1226408702j338rtn3ijdg0uf.htm/, Retrieved Mon, 20 May 2024 05:23:05 +0000
Statistical Computations at FreeStatistics.org, Office for Research Development and Education, URL https://freestatistics.org/blog/index.php?pk=23432, Retrieved Mon, 20 May 2024 05:23:05 +0000
QR Codes:

Original text written by user:
IsPrivate?No (this computation is public)
User-defined keywords
Estimated Impact118
Family? (F = Feedback message, R = changed R code, M = changed R Module, P = changed Parameters, D = changed Data)
F       [Trivariate Scatterplots] [Various EDA Topic...] [2008-11-11 13:04:21] [620b6ad5c4696049e39cb73ce029682c] [Current]
Feedback Forum
2008-11-14 10:21:17 [Ciska Tanghe] [reply
Kijken we naar de vierde grafiek bij deze methode dan zien we een weergave van histogrammen en scatterplots. Kijken we naar de scatterplots boven de hoofddiagonaal, dan zien we dat deze alle drie puntenwolken vertonen. De scatterplot van de invoer vanuit Amerika en de uitvoer naar Amerika vertoont enigszins nog een patroon als je een rechte zou tekenen. Bij de andere twee scatterplots is er zo goed als geen patroon snel terug te vinden.

Post a new message
Dataseries X:
1045,9
1401,9
1027,6
1703,8
1481,3
1422,7
1304,7
1246,1
1417,8
1459,1
1156,4
1304,5
1336,9
1372,3
975,5
1180,8
1361,3
1428,1
1355,9
1781,2
1697
1852
1844,1
1967,2
1747,1
1863,9
1559,3
1675
2237,5
1965,2
1871,5
1752,2
1360,7
1444,3
1621,6
1368
1553,9
1695,3
1397,1
1848,4
1809,2
1551,1
1546,6
1467,9
1662,4
1972,3
1673,5
1762
2019,8
1754,3
1400,4
1453,6
1740,9
1694,6
1541,2
1482,3
1632,1
1837,3
1797
2066,2
1983,8
1601,7
1660,3
1954
1991,9
1881,4
2345,5
1773,1
1719,2
2240,9
1816,4
2171,3
1823,3
2022,5
1991
1920
2168,4
2013,5
1790,8
1855,7
2074
2535,8
1837,2
1805,1
1785,7
2250
1959,7
1890,8
2405,7
2090,3
1666,5
1803,5
1793,8
1488,8
1545
1369,9
1451,6
Dataseries Y:
1593
1477,9
1733,7
1569,7
1843,7
1950,3
1657,5
1772,1
1568,3
1809,8
1646,7
1808,5
1763,9
1625,5
1538,8
1342,4
1645,1
1619,9
1338,1
1505,5
1529,1
1511,9
1656,7
1694,4
1662,3
1588,7
1483,3
1585,6
1658,9
1584,4
1470,6
1618,7
1407,6
1473,9
1515,3
1485,4
1496,1
1493,5
1298,4
1375,3
1507,9
1455,3
1363,3
1392,8
1348,8
1880,3
1669,2
1543,6
1701,2
1516,5
1466,8
1484,1
1577,2
1684,5
1414,7
1674,5
1598,7
1739,1
1674,6
1671,8
1802
1526,8
1580,9
1634,8
1610,3
1712
1678,8
1708,1
1680,6
2056
1624
2021,4
1861,1
1750,8
1767,5
1710,3
2151,5
2047,9
1915,4
1984,7
1896,5
2170,8
2139,9
2330,5
2121,8
2226,8
1857,9
2155,9
2341,7
2290,2
2006,5
2111,9
1731,3
1762,2
1863,2
1943,5
1975,2
Dataseries Z:
0,8721
0,8552
0,8564
0,8973
0,9383
0,9217
0,9095
0,892
0,8742
0,8532
0,8607
0,9005
0,9111
0,9059
0,8883
0,8924
0,8833
0,87
0,8758
0,8858
0,917
0,9554
0,9922
0,9778
0,9808
0,9811
1,0014
1,0183
1,0622
1,0773
1,0807
1,0848
1,1582
1,1663
1,1372
1,1139
1,1222
1,1692
1,1702
1,2286
1,2613
1,2646
1,2262
1,1985
1,2007
1,2138
1,2266
1,2176
1,2218
1,249
1,2991
1,3408
1,3119
1,3014
1,3201
1,2938
1,2694
1,2165
1,2037
1,2292
1,2256
1,2015
1,1786
1,1856
1,2103
1,1938
1,202
1,2271
1,277
1,265
1,2684
1,2811
1,2727
1,2611
1,2881
1,3213
1,2999
1,3074
1,3242
1,3516
1,3511
1,3419
1,3716
1,3622
1,3896
1,4227
1,4684
1,457
1,4718
1,4748
1,5527
1,575
1,5557
1,5553
1,577
1,4975
1,4369


Summary of computational transaction
Raw Inputview raw input (R code)
Raw Outputview raw output of R engine
Computing time5 seconds
R Server'Sir Ronald Aylmer Fisher' @ 193.190.124.24

\begin{tabular}{lllllllll}
\hline
Summary of computational transaction \tabularnewline
Raw Input & view raw input (R code)  \tabularnewline
Raw Output & view raw output of R engine  \tabularnewline
Computing time & 5 seconds \tabularnewline
R Server & 'Sir Ronald Aylmer Fisher' @ 193.190.124.24 \tabularnewline
\hline
\end{tabular}
%Source: https://freestatistics.org/blog/index.php?pk=23432&T=0

[TABLE]
[ROW][C]Summary of computational transaction[/C][/ROW]
[ROW][C]Raw Input[/C][C]view raw input (R code) [/C][/ROW]
[ROW][C]Raw Output[/C][C]view raw output of R engine [/C][/ROW]
[ROW][C]Computing time[/C][C]5 seconds[/C][/ROW]
[ROW][C]R Server[/C][C]'Sir Ronald Aylmer Fisher' @ 193.190.124.24[/C][/ROW]
[/TABLE]
Source: https://freestatistics.org/blog/index.php?pk=23432&T=0

Globally Unique Identifier (entire table): ba.freestatistics.org/blog/index.php?pk=23432&T=0

As an alternative you can also use a QR Code:  

The GUIDs for individual cells are displayed in the table below:

Summary of computational transaction
Raw Inputview raw input (R code)
Raw Outputview raw output of R engine
Computing time5 seconds
R Server'Sir Ronald Aylmer Fisher' @ 193.190.124.24


Parameters (Session):
par1 = 50 ; par2 = 50 ; par3 = Y ; par4 = Y ; par5 = Uitvoer naar Amerika ; par6 = Invoer vanuit Amerika ; par7 = Wisselkoers dollar / euro ;
Parameters (R input):
par1 = 50 ; par2 = 50 ; par3 = Y ; par4 = Y ; par5 = Uitvoer naar Amerika ; par6 = Invoer vanuit Amerika ; par7 = Wisselkoers dollar / euro ;
R code (references can be found in the software module):
x <- array(x,dim=c(length(x),1))
colnames(x) <- par5
y <- array(y,dim=c(length(y),1))
colnames(y) <- par6
z <- array(z,dim=c(length(z),1))
colnames(z) <- par7
d <- data.frame(cbind(z,y,x))
colnames(d) <- list(par7,par6,par5)
par1 <- as.numeric(par1)
par2 <- as.numeric(par2)
if (par1>500) par1 <- 500
if (par2>500) par2 <- 500
if (par1<10) par1 <- 10
if (par2<10) par2 <- 10
library(GenKern)
library(lattice)
panel.hist <- function(x, ...)
{
usr <- par('usr'); on.exit(par(usr))
par(usr = c(usr[1:2], 0, 1.5) )
h <- hist(x, plot = FALSE)
breaks <- h$breaks; nB <- length(breaks)
y <- h$counts; y <- y/max(y)
rect(breaks[-nB], 0, breaks[-1], y, col='black', ...)
}
bitmap(file='cloud1.png')
cloud(z~x*y, screen = list(x=-45, y=45, z=35),xlab=par5,ylab=par6,zlab=par7)
dev.off()
bitmap(file='cloud2.png')
cloud(z~x*y, screen = list(x=35, y=45, z=25),xlab=par5,ylab=par6,zlab=par7)
dev.off()
bitmap(file='cloud3.png')
cloud(z~x*y, screen = list(x=35, y=-25, z=90),xlab=par5,ylab=par6,zlab=par7)
dev.off()
bitmap(file='pairs.png')
pairs(d,diag.panel=panel.hist)
dev.off()
x <- as.vector(x)
y <- as.vector(y)
z <- as.vector(z)
bitmap(file='bidensity1.png')
op <- KernSur(x,y, xgridsize=par1, ygridsize=par2, correlation=cor(x,y), xbandwidth=dpik(x), ybandwidth=dpik(y))
image(op$xords, op$yords, op$zden, col=terrain.colors(100), axes=TRUE,main='Bivariate Kernel Density Plot (x,y)',xlab=par5,ylab=par6)
if (par3=='Y') contour(op$xords, op$yords, op$zden, add=TRUE)
if (par4=='Y') points(x,y)
(r<-lm(y ~ x))
abline(r)
box()
dev.off()
bitmap(file='bidensity2.png')
op <- KernSur(y,z, xgridsize=par1, ygridsize=par2, correlation=cor(y,z), xbandwidth=dpik(y), ybandwidth=dpik(z))
op
image(op$xords, op$yords, op$zden, col=terrain.colors(100), axes=TRUE,main='Bivariate Kernel Density Plot (y,z)',xlab=par6,ylab=par7)
if (par3=='Y') contour(op$xords, op$yords, op$zden, add=TRUE)
if (par4=='Y') points(y,z)
(r<-lm(z ~ y))
abline(r)
box()
dev.off()
bitmap(file='bidensity3.png')
op <- KernSur(x,z, xgridsize=par1, ygridsize=par2, correlation=cor(x,z), xbandwidth=dpik(x), ybandwidth=dpik(z))
op
image(op$xords, op$yords, op$zden, col=terrain.colors(100), axes=TRUE,main='Bivariate Kernel Density Plot (x,z)',xlab=par5,ylab=par7)
if (par3=='Y') contour(op$xords, op$yords, op$zden, add=TRUE)
if (par4=='Y') points(x,z)
(r<-lm(z ~ x))
abline(r)
box()
dev.off()