Free Statistics

of Irreproducible Research!

Author's title

Author*The author of this computation has been verified*
R Software Modulerwasp_cloud.wasp
Title produced by softwareTrivariate Scatterplots
Date of computationSat, 08 Nov 2008 05:37:06 -0700
Cite this page as followsStatistical Computations at FreeStatistics.org, Office for Research Development and Education, URL https://freestatistics.org/blog/index.php?v=date/2008/Nov/08/t12261479108o596v8ae7aayzm.htm/, Retrieved Mon, 20 May 2024 12:11:31 +0000
Statistical Computations at FreeStatistics.org, Office for Research Development and Education, URL https://freestatistics.org/blog/index.php?pk=22586, Retrieved Mon, 20 May 2024 12:11:31 +0000
QR Codes:

Original text written by user:
IsPrivate?No (this computation is public)
User-defined keywords
Estimated Impact188
Family? (F = Feedback message, R = changed R code, M = changed R Module, P = changed Parameters, D = changed Data)
F       [Trivariate Scatterplots] [Q1 Trivariate Sca...] [2008-11-08 12:37:06] [d7f41258beeebb8716e3f5d39f3cdc01] [Current]
Feedback Forum
2008-11-14 13:08:28 [Dana Molenberghs] [reply
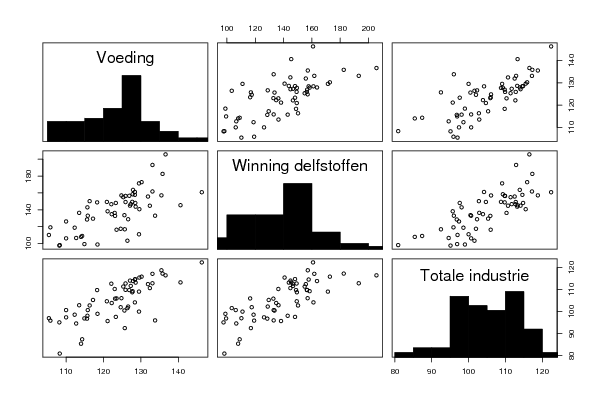
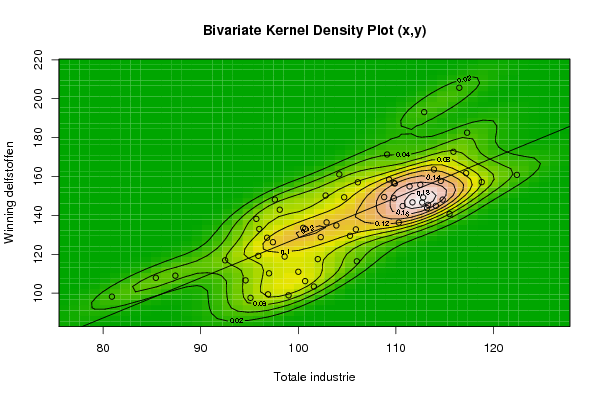
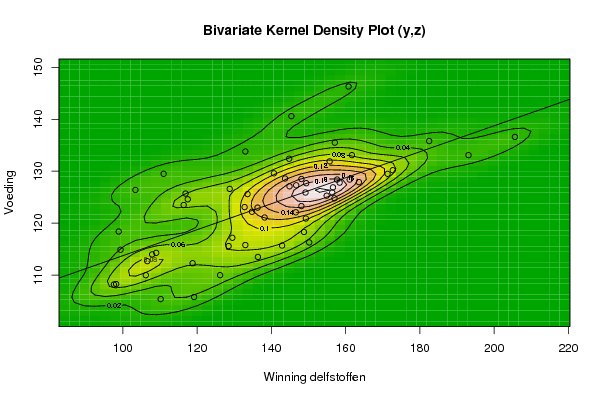
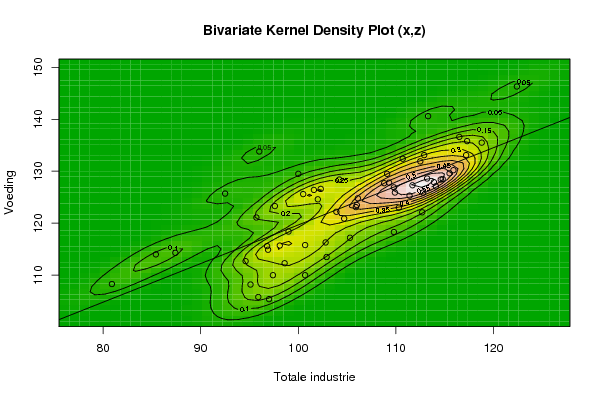
Je kan best vanaf de 4de de correlatie gaan bestuderen. Omdat de bovensten een vertekend beeld geven. Bij de bivariate kernel density gaan we kijken waar de dichtheid het grootst is (waar er veel punten liggen), het is dan heel waarschijnlijk dat hier nog meer observaties in de buurt komen te liggen.
2008-11-20 12:35:36 [Evelien Blockx] [reply
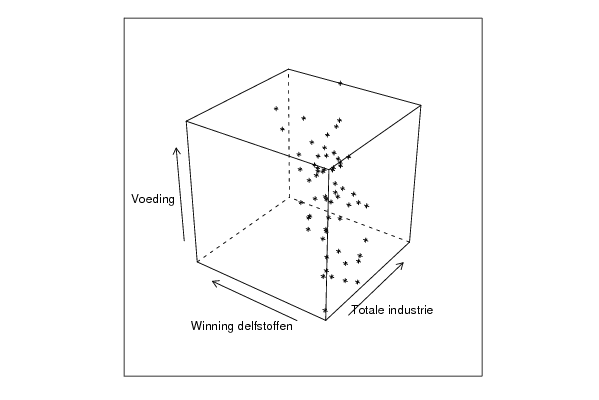
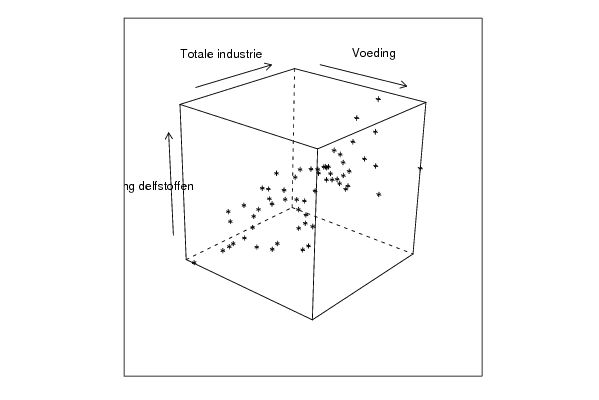
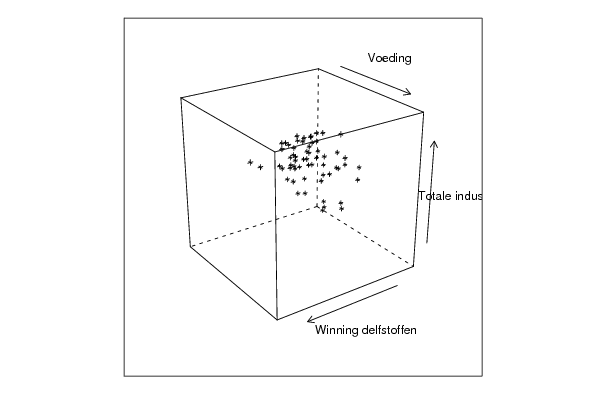
Je kan inderdaad best naar de Bivariate Kernel Density Plots kijken. De kubussen geven een driedimensionale weergave, en het is zeer moeilijk om er een patroon in te zoeken op een tweedimensionaal scherm. Ook de grafieken die erop volgen kunnen een vertekend beeld geven.

Op de Bivariate Kernel Density Plots kan je alweer heel wat aflezen (zie feedback eerste berekening van Q 1: http://www.freestatistics.org/blog/index.php?v=date/2008/Nov/08/t1226147351l50ddyh8gzr14w4.htm)

Het voordeel is dat je hier 3 Bivariate Kernel Density Plots tegelijk kan maken. Je hoeft dus niet drie keer 2 tijdreeksen in te geven.
2008-11-23 21:26:41 [Isabel Wilms] [reply
Trivariate scatterplots: op deze 3D-kubussen is het moeilijk om een verband af te lezen. op de 2D-scatterplot kunnen we dit wel,deze lees je gewoon hetzelfde af als anders.

Post a new message
Dataseries X:
109,8
111,7
98,6
96,9
95,1
97
112,7
102,9
97,4
111,4
87,4
96,8
114,1
110,3
103,9
101,6
94,6
95,9
104,7
102,8
98,1
113,9
80,9
95,7
113,2
105,9
108,8
102,3
99
100,7
115,5
100,7
109,9
114,6
85,4
100,5
114,8
116,5
112,9
102
106
105,3
118,8
106,1
109,3
117,2
92,5
104,2
112,5
122,4
113,3
100
110,7
112,8
109,8
117,3
109,1
115,9
96
97,6
Dataseries Y:
148,8
146,7
118,8
99,4
97,6
110,2
146,6
136,4
126,2
154,9
109
128,5
144,9
136,3
134,8
103,4
106,6
119,2
149,3
150,2
142,9
163,6
98,2
138,2
143,7
132,8
149,4
128,8
98,9
106,2
140,7
133
156,4
157,7
107,9
133,6
148,1
205,6
193,1
117,5
116,4
129,5
157,1
157
158,4
161,7
116,9
161,1
155,7
160,8
145,4
111
144,8
149,2
156,6
182,5
171,3
172,7
133
148,1
Dataseries Z:
118,3
127,3
112,3
114,9
108,2
105,4
122,1
113,5
110
125,3
114,3
115,6
127,1
123
122,2
126,4
112,7
105,8
120,9
116,3
115,7
127,9
108,3
121,1
128,6
123,1
127,7
126,6
118,4
110
129,6
115,8
125,9
128,4
114
125,6
128,5
136,6
133,1
124,6
123,5
117,2
135,5
124,8
127,8
133,1
125,7
128,4
131,9
146,3
140,6
129,5
132,4
125,9
126,9
135,8
129,5
130,2
133,8
123,3


Summary of computational transaction
Raw Inputview raw input (R code)
Raw Outputview raw output of R engine
Computing time5 seconds
R Server'Sir Ronald Aylmer Fisher' @ 193.190.124.24

\begin{tabular}{lllllllll}
\hline
Summary of computational transaction \tabularnewline
Raw Input & view raw input (R code)  \tabularnewline
Raw Output & view raw output of R engine  \tabularnewline
Computing time & 5 seconds \tabularnewline
R Server & 'Sir Ronald Aylmer Fisher' @ 193.190.124.24 \tabularnewline
\hline
\end{tabular}
%Source: https://freestatistics.org/blog/index.php?pk=22586&T=0

[TABLE]
[ROW][C]Summary of computational transaction[/C][/ROW]
[ROW][C]Raw Input[/C][C]view raw input (R code) [/C][/ROW]
[ROW][C]Raw Output[/C][C]view raw output of R engine [/C][/ROW]
[ROW][C]Computing time[/C][C]5 seconds[/C][/ROW]
[ROW][C]R Server[/C][C]'Sir Ronald Aylmer Fisher' @ 193.190.124.24[/C][/ROW]
[/TABLE]
Source: https://freestatistics.org/blog/index.php?pk=22586&T=0

Globally Unique Identifier (entire table): ba.freestatistics.org/blog/index.php?pk=22586&T=0

As an alternative you can also use a QR Code:  

The GUIDs for individual cells are displayed in the table below:

Summary of computational transaction
Raw Inputview raw input (R code)
Raw Outputview raw output of R engine
Computing time5 seconds
R Server'Sir Ronald Aylmer Fisher' @ 193.190.124.24


Parameters (Session):
par1 = 50 ; par2 = 50 ; par3 = Y ; par4 = Y ; par5 = Totale industrie ; par6 = Winning delfstoffen ; par7 = Voeding ;
Parameters (R input):
par1 = 50 ; par2 = 50 ; par3 = Y ; par4 = Y ; par5 = Totale industrie ; par6 = Winning delfstoffen ; par7 = Voeding ;
R code (references can be found in the software module):
x <- array(x,dim=c(length(x),1))
colnames(x) <- par5
y <- array(y,dim=c(length(y),1))
colnames(y) <- par6
z <- array(z,dim=c(length(z),1))
colnames(z) <- par7
d <- data.frame(cbind(z,y,x))
colnames(d) <- list(par7,par6,par5)
par1 <- as.numeric(par1)
par2 <- as.numeric(par2)
if (par1>500) par1 <- 500
if (par2>500) par2 <- 500
if (par1<10) par1 <- 10
if (par2<10) par2 <- 10
library(GenKern)
library(lattice)
panel.hist <- function(x, ...)
{
usr <- par('usr'); on.exit(par(usr))
par(usr = c(usr[1:2], 0, 1.5) )
h <- hist(x, plot = FALSE)
breaks <- h$breaks; nB <- length(breaks)
y <- h$counts; y <- y/max(y)
rect(breaks[-nB], 0, breaks[-1], y, col='black', ...)
}
bitmap(file='cloud1.png')
cloud(z~x*y, screen = list(x=-45, y=45, z=35),xlab=par5,ylab=par6,zlab=par7)
dev.off()
bitmap(file='cloud2.png')
cloud(z~x*y, screen = list(x=35, y=45, z=25),xlab=par5,ylab=par6,zlab=par7)
dev.off()
bitmap(file='cloud3.png')
cloud(z~x*y, screen = list(x=35, y=-25, z=90),xlab=par5,ylab=par6,zlab=par7)
dev.off()
bitmap(file='pairs.png')
pairs(d,diag.panel=panel.hist)
dev.off()
x <- as.vector(x)
y <- as.vector(y)
z <- as.vector(z)
bitmap(file='bidensity1.png')
op <- KernSur(x,y, xgridsize=par1, ygridsize=par2, correlation=cor(x,y), xbandwidth=dpik(x), ybandwidth=dpik(y))
image(op$xords, op$yords, op$zden, col=terrain.colors(100), axes=TRUE,main='Bivariate Kernel Density Plot (x,y)',xlab=par5,ylab=par6)
if (par3=='Y') contour(op$xords, op$yords, op$zden, add=TRUE)
if (par4=='Y') points(x,y)
(r<-lm(y ~ x))
abline(r)
box()
dev.off()
bitmap(file='bidensity2.png')
op <- KernSur(y,z, xgridsize=par1, ygridsize=par2, correlation=cor(y,z), xbandwidth=dpik(y), ybandwidth=dpik(z))
op
image(op$xords, op$yords, op$zden, col=terrain.colors(100), axes=TRUE,main='Bivariate Kernel Density Plot (y,z)',xlab=par6,ylab=par7)
if (par3=='Y') contour(op$xords, op$yords, op$zden, add=TRUE)
if (par4=='Y') points(y,z)
(r<-lm(z ~ y))
abline(r)
box()
dev.off()
bitmap(file='bidensity3.png')
op <- KernSur(x,z, xgridsize=par1, ygridsize=par2, correlation=cor(x,z), xbandwidth=dpik(x), ybandwidth=dpik(z))
op
image(op$xords, op$yords, op$zden, col=terrain.colors(100), axes=TRUE,main='Bivariate Kernel Density Plot (x,z)',xlab=par5,ylab=par7)
if (par3=='Y') contour(op$xords, op$yords, op$zden, add=TRUE)
if (par4=='Y') points(x,z)
(r<-lm(z ~ x))
abline(r)
box()
dev.off()