Free Statistics

of Irreproducible Research!

Author's title

Author*The author of this computation has been verified*
R Software Modulerwasp_cloud.wasp
Title produced by softwareTrivariate Scatterplots
Date of computationSat, 08 Nov 2008 05:14:33 -0700
Cite this page as followsStatistical Computations at FreeStatistics.org, Office for Research Development and Education, URL https://freestatistics.org/blog/index.php?v=date/2008/Nov/08/t1226146541ts9vhb78s9eaaiw.htm/, Retrieved Mon, 20 May 2024 08:38:54 +0000
Statistical Computations at FreeStatistics.org, Office for Research Development and Education, URL https://freestatistics.org/blog/index.php?pk=22581, Retrieved Mon, 20 May 2024 08:38:54 +0000
QR Codes:

Original text written by user:
IsPrivate?No (this computation is public)
User-defined keywords
Estimated Impact212
Family? (F = Feedback message, R = changed R code, M = changed R Module, P = changed Parameters, D = changed Data)
F       [Trivariate Scatterplots] [Trivariate Scater...] [2008-11-08 12:14:33] [00a0a665d7a07edd2e460056b0c0c354] [Current]
F         [Trivariate Scatterplots] [trivariate scatte...] [2008-11-09 16:39:36] [8d78428855b119373cac369316c08983]
Feedback Forum
2008-11-21 21:28:32 [Kim Wester] [reply
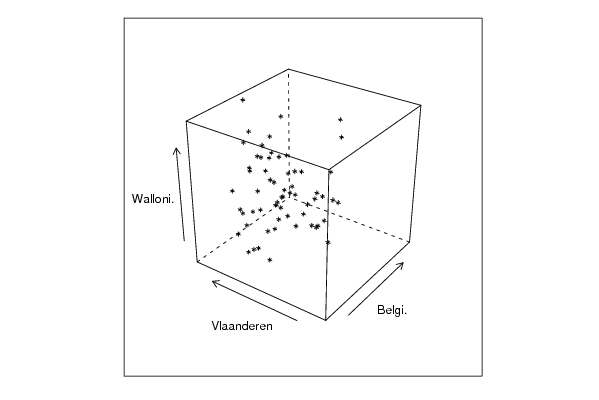
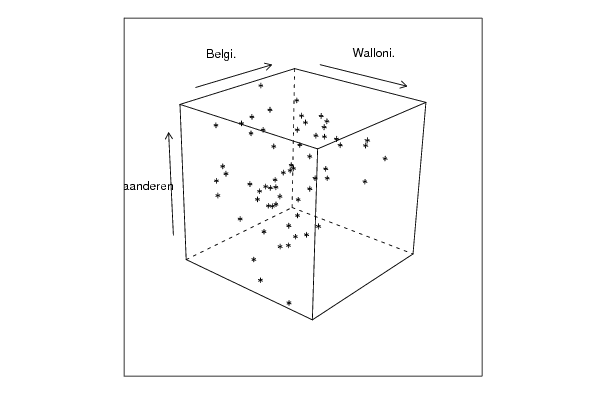
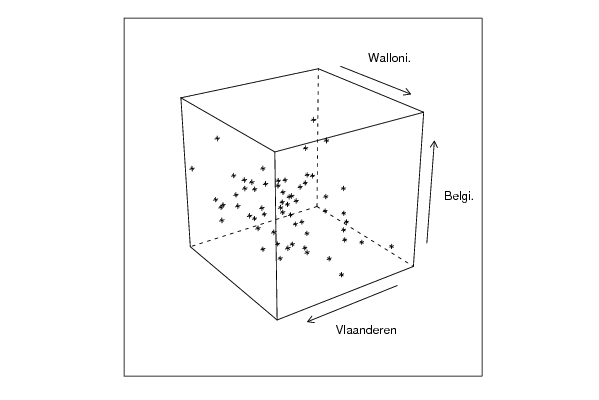
De trivariate scatterplots geven een vertekend beeld omdat je een 3d voorstelling op een 2d scherm ziet.
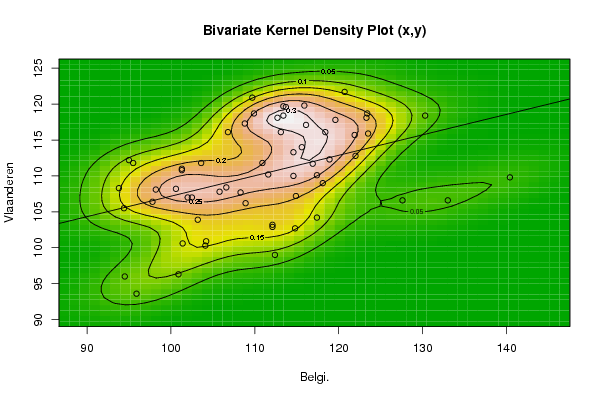
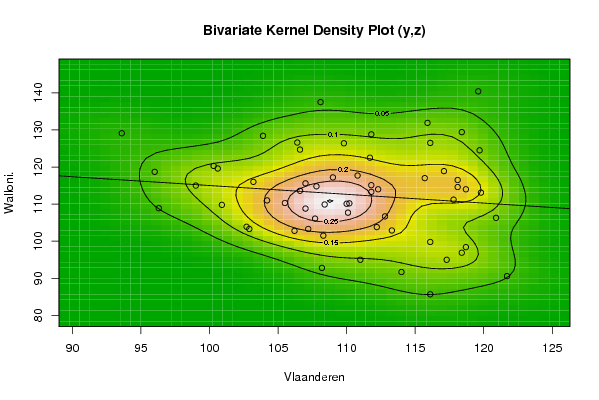
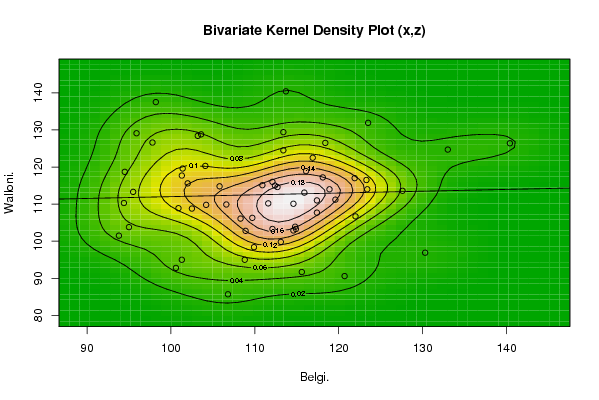
De Bivariate Density Plots geven voor alle gecombineerde reeksen slechts 1 cluster aan.
2008-11-23 10:48:17 [Inge Meelberghs] [reply
Bij het interpreteren van de kubus moet je opletten! Hoe je deze ook bekijkt, er zal altijd vertekening zijn. Dit komt doordat de kubus een 3D figuur is dat op een 2D scherm wordt afgebeeld. Het is dus heel moeilijk om hier inzicht in te krijgen.

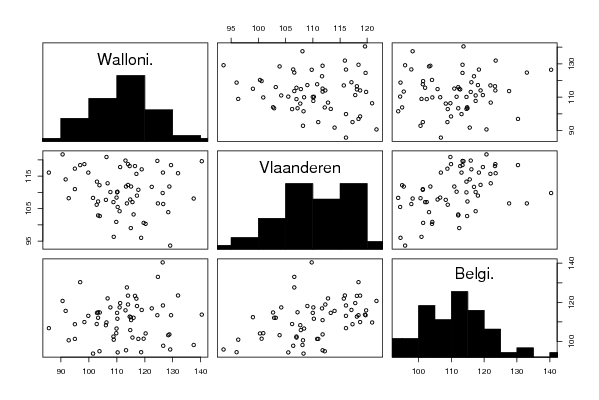
De trivariate scatterplots geeft een projectie van bovenstaande kubussen weer. Net als de kubus geeft ook deze grafiek een vertekend beeld omdat de scaterplots 2 dimensionseel zijn en er met de derde variable hier dus geen rekening wordt gehouden.

Je kan dus best de bivariate scatter plot gebruiken. Door gebruik van deze grafiek kan je op een makkelijke manier twee variabelen met elkaar vergelijken. Bij deze techniek wordt gebruik gemaakt van hoogtelijnen die punten van gelijke dichtheid met elkaar verbinden . Op de grafiek kan je zien dat er verschillende zones voorkomen door de kleurverandering. De rode zone duidt op een sterke correlatie, de groene en de gele duiden op een eerdere zwakke correlatie.
2008-11-23 17:28:31 [Michaël De Kuyer] [reply
Aan de hand van de geproduceerde grafieken kan vastgesteld worden dat er een zeer beperkte samenhang is tussen de tijdreeksen. Dit ziet men op de tabel die eveneens in het document staat.

Zoals Inge zegt is een 3D-afbeelding moeilijk te interpreteren. Daarom is het dus zinvol om een interpretatie te doen van de bivariate scatter plots.
2008-11-24 12:04:49 [Bonifer Spillemaeckers] [reply
Inge geeft hier opnieuw een goede uitleg. Bij deze plots moet je inderdaad goed opletten met de kubussen. Deze geven eigenlijk een vertekend beeld, omdat ze driedimensionaal gepresenteerd worden. Het is moeilijk te zien hoe de verhouding is tussen de afstanden van de punten. Je kan hiervoor beter gaan kijken naar plots die tweedimensionaal gepresenteerd worden. Zo kan je te weten of er al dan niet een verband bestaat tussen bepaalde data.

Post a new message
Dataseries X:
116.1
102.5
102.0
101.3
100.6
100.9
104.2
108.3
108.9
109.9
106.8
112.7
113.4
101.3
97.8
95.0
93.8
94.5
101.4
105.8
106.6
109.7
108.8
113.4
113.7
103.6
98.2
95.5
94.4
95.9
103.2
104.1
127.6
130.3
133.0
140.4
123.5
116.9
115.9
113.1
112.1
112.4
118.9
117.4
115.6
120.7
114.9
122.0
119.6
114.6
118.4
110.9
111.6
114.6
112.1
117.4
114.8
123.4
118.1
121.9
123.3
Dataseries Y:
117.1
107.0
107.0
111.0
108.2
96.3
100.9
107.7
106.2
118.7
116.1
118.1
118.4
110.8
106.4
112.2
108.3
96.0
100.6
107.8
108.4
120.9
117.3
119.7
119.6
111.8
108.1
111.8
105.5
93.6
103.9
100.3
106.6
118.4
106.6
109.8
115.9
111.7
119.8
116.1
103.2
99.0
112.3
104.2
114.0
121.7
107.2
112.8
117.8
113.3
116.1
111.8
110.2
110.0
102.9
110.1
102.7
118.7
109.0
115.7
118.1
Dataseries Z:
118.9
108.8
115.6
95.0
92.8
108.9
109.8
106.1
102.8
98.4
85.7
114.6
129.4
117.7
126.6
103.8
101.5
118.7
119.6
114.8
109.9
106.3
95.0
124.5
140.4
128.8
137.5
113.3
110.3
129.1
128.4
120.3
113.6
96.9
124.7
126.4
131.9
122.5
113.1
99.8
116.0
115.0
114.0
111.0
91.7
90.6
103.3
106.7
111.2
102.9
126.5
115.1
110.2
110.1
103.3
107.7
103.9
114.0
117.2
117.0
116.5


Summary of computational transaction
Raw Inputview raw input (R code)
Raw Outputview raw output of R engine
Computing time5 seconds
R Server'Herman Ole Andreas Wold' @ 193.190.124.10:1001

\begin{tabular}{lllllllll}
\hline
Summary of computational transaction \tabularnewline
Raw Input & view raw input (R code)  \tabularnewline
Raw Output & view raw output of R engine  \tabularnewline
Computing time & 5 seconds \tabularnewline
R Server & 'Herman Ole Andreas Wold' @ 193.190.124.10:1001 \tabularnewline
\hline
\end{tabular}
%Source: https://freestatistics.org/blog/index.php?pk=22581&T=0

[TABLE]
[ROW][C]Summary of computational transaction[/C][/ROW]
[ROW][C]Raw Input[/C][C]view raw input (R code) [/C][/ROW]
[ROW][C]Raw Output[/C][C]view raw output of R engine [/C][/ROW]
[ROW][C]Computing time[/C][C]5 seconds[/C][/ROW]
[ROW][C]R Server[/C][C]'Herman Ole Andreas Wold' @ 193.190.124.10:1001[/C][/ROW]
[/TABLE]
Source: https://freestatistics.org/blog/index.php?pk=22581&T=0

Globally Unique Identifier (entire table): ba.freestatistics.org/blog/index.php?pk=22581&T=0

As an alternative you can also use a QR Code:  

The GUIDs for individual cells are displayed in the table below:

Summary of computational transaction
Raw Inputview raw input (R code)
Raw Outputview raw output of R engine
Computing time5 seconds
R Server'Herman Ole Andreas Wold' @ 193.190.124.10:1001


Parameters (Session):
par1 = 50 ; par2 = 50 ; par3 = Y ; par4 = Y ; par5 = België ; par6 = Vlaanderen ; par7 = Wallonië ;
Parameters (R input):
par1 = 50 ; par2 = 50 ; par3 = Y ; par4 = Y ; par5 = België ; par6 = Vlaanderen ; par7 = Wallonië ;
R code (references can be found in the software module):
x <- array(x,dim=c(length(x),1))
colnames(x) <- par5
y <- array(y,dim=c(length(y),1))
colnames(y) <- par6
z <- array(z,dim=c(length(z),1))
colnames(z) <- par7
d <- data.frame(cbind(z,y,x))
colnames(d) <- list(par7,par6,par5)
par1 <- as.numeric(par1)
par2 <- as.numeric(par2)
if (par1>500) par1 <- 500
if (par2>500) par2 <- 500
if (par1<10) par1 <- 10
if (par2<10) par2 <- 10
library(GenKern)
library(lattice)
panel.hist <- function(x, ...)
{
usr <- par('usr'); on.exit(par(usr))
par(usr = c(usr[1:2], 0, 1.5) )
h <- hist(x, plot = FALSE)
breaks <- h$breaks; nB <- length(breaks)
y <- h$counts; y <- y/max(y)
rect(breaks[-nB], 0, breaks[-1], y, col='black', ...)
}
bitmap(file='cloud1.png')
cloud(z~x*y, screen = list(x=-45, y=45, z=35),xlab=par5,ylab=par6,zlab=par7)
dev.off()
bitmap(file='cloud2.png')
cloud(z~x*y, screen = list(x=35, y=45, z=25),xlab=par5,ylab=par6,zlab=par7)
dev.off()
bitmap(file='cloud3.png')
cloud(z~x*y, screen = list(x=35, y=-25, z=90),xlab=par5,ylab=par6,zlab=par7)
dev.off()
bitmap(file='pairs.png')
pairs(d,diag.panel=panel.hist)
dev.off()
x <- as.vector(x)
y <- as.vector(y)
z <- as.vector(z)
bitmap(file='bidensity1.png')
op <- KernSur(x,y, xgridsize=par1, ygridsize=par2, correlation=cor(x,y), xbandwidth=dpik(x), ybandwidth=dpik(y))
image(op$xords, op$yords, op$zden, col=terrain.colors(100), axes=TRUE,main='Bivariate Kernel Density Plot (x,y)',xlab=par5,ylab=par6)
if (par3=='Y') contour(op$xords, op$yords, op$zden, add=TRUE)
if (par4=='Y') points(x,y)
(r<-lm(y ~ x))
abline(r)
box()
dev.off()
bitmap(file='bidensity2.png')
op <- KernSur(y,z, xgridsize=par1, ygridsize=par2, correlation=cor(y,z), xbandwidth=dpik(y), ybandwidth=dpik(z))
op
image(op$xords, op$yords, op$zden, col=terrain.colors(100), axes=TRUE,main='Bivariate Kernel Density Plot (y,z)',xlab=par6,ylab=par7)
if (par3=='Y') contour(op$xords, op$yords, op$zden, add=TRUE)
if (par4=='Y') points(y,z)
(r<-lm(z ~ y))
abline(r)
box()
dev.off()
bitmap(file='bidensity3.png')
op <- KernSur(x,z, xgridsize=par1, ygridsize=par2, correlation=cor(x,z), xbandwidth=dpik(x), ybandwidth=dpik(z))
op
image(op$xords, op$yords, op$zden, col=terrain.colors(100), axes=TRUE,main='Bivariate Kernel Density Plot (x,z)',xlab=par5,ylab=par7)
if (par3=='Y') contour(op$xords, op$yords, op$zden, add=TRUE)
if (par4=='Y') points(x,z)
(r<-lm(z ~ x))
abline(r)
box()
dev.off()