Free Statistics

of Irreproducible Research!

Author's title

Author*The author of this computation has been verified*
R Software Modulerwasp_bootstrapplot.wasp
Title produced by softwareBlocked Bootstrap Plot - Central Tendency
Date of computationTue, 04 Nov 2008 05:56:00 -0700
Cite this page as followsStatistical Computations at FreeStatistics.org, Office for Research Development and Education, URL https://freestatistics.org/blog/index.php?v=date/2008/Nov/04/t1225803462n0mr5d0vn9csiob.htm/, Retrieved Mon, 20 May 2024 11:40:25 +0000
Statistical Computations at FreeStatistics.org, Office for Research Development and Education, URL https://freestatistics.org/blog/index.php?pk=21522, Retrieved Mon, 20 May 2024 11:40:25 +0000
QR Codes:

Original text written by user:
IsPrivate?No (this computation is public)
User-defined keywordsmidrange
Estimated Impact146
Family? (F = Feedback message, R = changed R code, M = changed R Module, P = changed Parameters, D = changed Data)
F     [Blocked Bootstrap Plot - Central Tendency] [workshop 3] [2007-10-26 12:36:24] [e9ffc5de6f8a7be62f22b142b5b6b1a8]
F    D    [Blocked Bootstrap Plot - Central Tendency] [midrange] [2008-11-04 12:56:00] [35c75b0726318bf2908e4a56ed2df1a9] [Current]
Feedback Forum
2008-11-10 16:36:51 [Liese Drijkoningen] [reply
Aan deze opgave kan ik het volgende nog toevoegen:
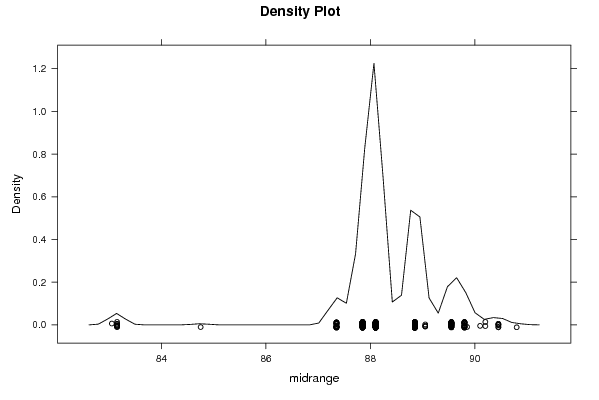
De midrange heeft dus duidelijk de kleinste spreiding, maar het heeft wel veel outliers. Dit wil zeggen dat als je een fout maakt, deze direct groot is. Het risico dat je neemt heeft dus een grote impact indien het fout gaat. Je dus ook het gemiddelde kunnen gebruiken, deze spreiding is groter, maar het heeft wel minder outliers. Je moet dus een afweging maken van wat belangrijk is.
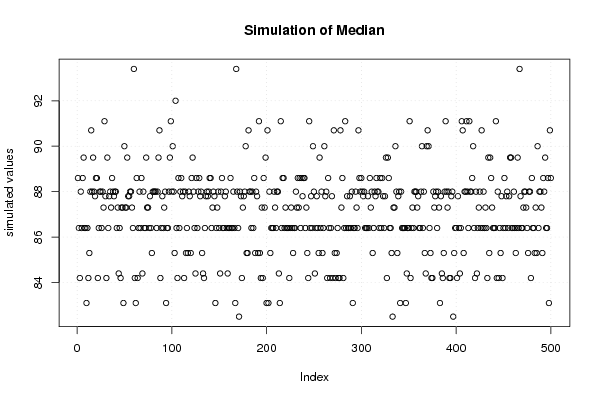
Verder moet ik nog vermelden dat de bootstrap simulation niets te maken heeft met de data-set. Het vertegenwoordigt alle puntjes uit de simulatie ('simulation of midrange':deze gaf de student ook weer. In deze grafiek zie je een duidelijk lineair verband wat niet het geval is bij het gemiddelde)
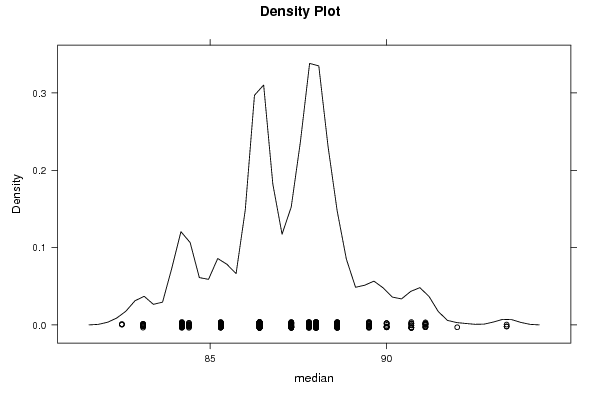
Tenslotte zou het nuttig kunnen zijn om het density plot ook weer te geven. dit geeft weer hoe de verdeling in elkaar zit.

Post a new message
Dataseries X:
109.20
88.60
94.30
98.30
86.40
80.60
104.10
108.20
93.40
71.90
94.10
94.90
96.40
91.10
84.40
86.40
88.00
75.10
109.70
103.00
82.10
68.00
96.40
94.30
90.00
88.00
76.10
82.50
81.40
66.50
97.20
94.10
80.70
70.50
87.80
89.50
99.60
84.20
75.10
92.00
80.80
73.10
99.80
90.00
83.10
72.40
78.80
87.30
91.00
80.10
73.60
86.40
74.50
71.20
92.40
81.50
85.30
69.90
84.20
90.70
100.30


Summary of computational transaction
Raw Inputview raw input (R code)
Raw Outputview raw output of R engine
Computing time3 seconds
R Server'Gwilym Jenkins' @ 72.249.127.135

\begin{tabular}{lllllllll}
\hline
Summary of computational transaction \tabularnewline
Raw Input & view raw input (R code)  \tabularnewline
Raw Output & view raw output of R engine  \tabularnewline
Computing time & 3 seconds \tabularnewline
R Server & 'Gwilym Jenkins' @ 72.249.127.135 \tabularnewline
\hline
\end{tabular}
%Source: https://freestatistics.org/blog/index.php?pk=21522&T=0

[TABLE]
[ROW][C]Summary of computational transaction[/C][/ROW]
[ROW][C]Raw Input[/C][C]view raw input (R code) [/C][/ROW]
[ROW][C]Raw Output[/C][C]view raw output of R engine [/C][/ROW]
[ROW][C]Computing time[/C][C]3 seconds[/C][/ROW]
[ROW][C]R Server[/C][C]'Gwilym Jenkins' @ 72.249.127.135[/C][/ROW]
[/TABLE]
Source: https://freestatistics.org/blog/index.php?pk=21522&T=0

Globally Unique Identifier (entire table): ba.freestatistics.org/blog/index.php?pk=21522&T=0

As an alternative you can also use a QR Code:  

The GUIDs for individual cells are displayed in the table below:

Summary of computational transaction
Raw Inputview raw input (R code)
Raw Outputview raw output of R engine
Computing time3 seconds
R Server'Gwilym Jenkins' @ 72.249.127.135


Estimation Results of Blocked Bootstrap
statisticQ1EstimateQ3S.D.IQR
mean85.717213114754186.893442622950887.93606557377051.639572287055462.21885245901639
median86.487.3881.862191384768761.59999999999999
midrange88.188.188.851.009847599565750.75

\begin{tabular}{lllllllll}
\hline
Estimation Results of Blocked Bootstrap \tabularnewline
statistic & Q1 & Estimate & Q3 & S.D. & IQR \tabularnewline
mean & 85.7172131147541 & 86.8934426229508 & 87.9360655737705 & 1.63957228705546 & 2.21885245901639 \tabularnewline
median & 86.4 & 87.3 & 88 & 1.86219138476876 & 1.59999999999999 \tabularnewline
midrange & 88.1 & 88.1 & 88.85 & 1.00984759956575 & 0.75 \tabularnewline
\hline
\end{tabular}
%Source: https://freestatistics.org/blog/index.php?pk=21522&T=1

[TABLE]
[ROW][C]Estimation Results of Blocked Bootstrap[/C][/ROW]
[ROW][C]statistic[/C][C]Q1[/C][C]Estimate[/C][C]Q3[/C][C]S.D.[/C][C]IQR[/C][/ROW]
[ROW][C]mean[/C][C]85.7172131147541[/C][C]86.8934426229508[/C][C]87.9360655737705[/C][C]1.63957228705546[/C][C]2.21885245901639[/C][/ROW]
[ROW][C]median[/C][C]86.4[/C][C]87.3[/C][C]88[/C][C]1.86219138476876[/C][C]1.59999999999999[/C][/ROW]
[ROW][C]midrange[/C][C]88.1[/C][C]88.1[/C][C]88.85[/C][C]1.00984759956575[/C][C]0.75[/C][/ROW]
[/TABLE]
Source: https://freestatistics.org/blog/index.php?pk=21522&T=1

Globally Unique Identifier (entire table): ba.freestatistics.org/blog/index.php?pk=21522&T=1

As an alternative you can also use a QR Code:  

The GUIDs for individual cells are displayed in the table below:

Estimation Results of Blocked Bootstrap
statisticQ1EstimateQ3S.D.IQR
mean85.717213114754186.893442622950887.93606557377051.639572287055462.21885245901639
median86.487.3881.862191384768761.59999999999999
midrange88.188.188.851.009847599565750.75


Parameters (Session):
par1 = 500 ; par2 = 12 ;
Parameters (R input):
par1 = 500 ; par2 = 12 ;
R code (references can be found in the software module):
par1 <- as.numeric(par1)
par2 <- as.numeric(par2)
if (par1 < 10) par1 = 10
if (par1 > 5000) par1 = 5000
if (par2 < 3) par2 = 3
if (par2 > length(x)) par2 = length(x)
library(lattice)
library(boot)
boot.stat <- function(s)
{
s.mean <- mean(s)
s.median <- median(s)
s.midrange <- (max(s) + min(s)) / 2
c(s.mean, s.median, s.midrange)
}
(r <- tsboot(x, boot.stat, R=par1, l=12, sim='fixed'))
bitmap(file='plot1.png')
plot(r$t[,1],type='p',ylab='simulated values',main='Simulation of Mean')
grid()
dev.off()
bitmap(file='plot2.png')
plot(r$t[,2],type='p',ylab='simulated values',main='Simulation of Median')
grid()
dev.off()
bitmap(file='plot3.png')
plot(r$t[,3],type='p',ylab='simulated values',main='Simulation of Midrange')
grid()
dev.off()
bitmap(file='plot4.png')
densityplot(~r$t[,1],col='black',main='Density Plot',xlab='mean')
dev.off()
bitmap(file='plot5.png')
densityplot(~r$t[,2],col='black',main='Density Plot',xlab='median')
dev.off()
bitmap(file='plot6.png')
densityplot(~r$t[,3],col='black',main='Density Plot',xlab='midrange')
dev.off()
z <- data.frame(cbind(r$t[,1],r$t[,2],r$t[,3]))
colnames(z) <- list('mean','median','midrange')
bitmap(file='plot7.png')
boxplot(z,notch=TRUE,ylab='simulated values',main='Bootstrap Simulation - Central Tendency')
grid()
dev.off()
load(file='createtable')
a<-table.start()
a<-table.row.start(a)
a<-table.element(a,'Estimation Results of Blocked Bootstrap',6,TRUE)
a<-table.row.end(a)
a<-table.row.start(a)
a<-table.element(a,'statistic',header=TRUE)
a<-table.element(a,'Q1',header=TRUE)
a<-table.element(a,'Estimate',header=TRUE)
a<-table.element(a,'Q3',header=TRUE)
a<-table.element(a,'S.D.',header=TRUE)
a<-table.element(a,'IQR',header=TRUE)
a<-table.row.end(a)
a<-table.row.start(a)
a<-table.element(a,'mean',header=TRUE)
q1 <- quantile(r$t[,1],0.25)[[1]]
q3 <- quantile(r$t[,1],0.75)[[1]]
a<-table.element(a,q1)
a<-table.element(a,r$t0[1])
a<-table.element(a,q3)
a<-table.element(a,sqrt(var(r$t[,1])))
a<-table.element(a,q3-q1)
a<-table.row.end(a)
a<-table.row.start(a)
a<-table.element(a,'median',header=TRUE)
q1 <- quantile(r$t[,2],0.25)[[1]]
q3 <- quantile(r$t[,2],0.75)[[1]]
a<-table.element(a,q1)
a<-table.element(a,r$t0[2])
a<-table.element(a,q3)
a<-table.element(a,sqrt(var(r$t[,2])))
a<-table.element(a,q3-q1)
a<-table.row.end(a)
a<-table.row.start(a)
a<-table.element(a,'midrange',header=TRUE)
q1 <- quantile(r$t[,3],0.25)[[1]]
q3 <- quantile(r$t[,3],0.75)[[1]]
a<-table.element(a,q1)
a<-table.element(a,r$t0[3])
a<-table.element(a,q3)
a<-table.element(a,sqrt(var(r$t[,3])))
a<-table.element(a,q3-q1)
a<-table.row.end(a)
a<-table.end(a)
table.save(a,file='mytable.tab')