Free Statistics

of Irreproducible Research!

Author's title

Author*Unverified author*
R Software Modulerwasp_exponentialsmoothing.wasp
Title produced by softwareExponential Smoothing
Date of computationFri, 09 May 2008 07:04:50 -0600
Cite this page as followsStatistical Computations at FreeStatistics.org, Office for Research Development and Education, URL https://freestatistics.org/blog/index.php?v=date/2008/May/09/t12103383444hutps2o3fhhiv8.htm/, Retrieved Sun, 05 May 2024 18:44:31 +0000
Statistical Computations at FreeStatistics.org, Office for Research Development and Education, URL https://freestatistics.org/blog/index.php?pk=12155, Retrieved Sun, 05 May 2024 18:44:31 +0000
QR Codes:

Original text written by user:
IsPrivate?No (this computation is public)
User-defined keywordsexponential smoothing triple additive onderzoek tijdsreeks
Estimated Impact202
Family? (F = Feedback message, R = changed R code, M = changed R Module, P = changed Parameters, D = changed Data)
-     [Exponential Smoothing] [HPC Retail Sales] [2008-03-10 17:43:04] [74be16979710d4c4e7c6647856088456]
-   PD    [Exponential Smoothing] [exponential smoot...] [2008-05-09 13:04:50] [d41d8cd98f00b204e9800998ecf8427e] [Current]
Feedback Forum

Post a new message
Dataseries X:
56421
53152
53536
52408
41454
38271
35306
26414
31917
38030
27534
18387
50556
43901
48572
43899
37532
40357
35489
29027
34485
42598
30306
26451
47460
50104
61465
53726
39477
43895
31481
29896
33842
39120
33702
25094
51442
45594
52518
48564
41745
49585
32747
33379
35645
37034
35681
20972
58552
54955
65540
51570
51145
46641
35704
33253
35193
41668
34865
21210
56126
49231
59723
48103
47472
50497
40059
34149
36860
46356
36577


Summary of computational transaction
Raw Inputview raw input (R code)
Raw Outputview raw output of R engine
Computing time39 seconds
R Server'Sir Ronald Aylmer Fisher' @ 193.190.124.24

\begin{tabular}{lllllllll}
\hline
Summary of computational transaction \tabularnewline
Raw Input & view raw input (R code)  \tabularnewline
Raw Output & view raw output of R engine  \tabularnewline
Computing time & 39 seconds \tabularnewline
R Server & 'Sir Ronald Aylmer Fisher' @ 193.190.124.24 \tabularnewline
\hline
\end{tabular}
%Source: https://freestatistics.org/blog/index.php?pk=12155&T=0

[TABLE]
[ROW][C]Summary of computational transaction[/C][/ROW]
[ROW][C]Raw Input[/C][C]view raw input (R code) [/C][/ROW]
[ROW][C]Raw Output[/C][C]view raw output of R engine [/C][/ROW]
[ROW][C]Computing time[/C][C]39 seconds[/C][/ROW]
[ROW][C]R Server[/C][C]'Sir Ronald Aylmer Fisher' @ 193.190.124.24[/C][/ROW]
[/TABLE]
Source: https://freestatistics.org/blog/index.php?pk=12155&T=0

Globally Unique Identifier (entire table): ba.freestatistics.org/blog/index.php?pk=12155&T=0

As an alternative you can also use a QR Code:  

The GUIDs for individual cells are displayed in the table below:

Summary of computational transaction
Raw Inputview raw input (R code)
Raw Outputview raw output of R engine
Computing time39 seconds
R Server'Sir Ronald Aylmer Fisher' @ 193.190.124.24


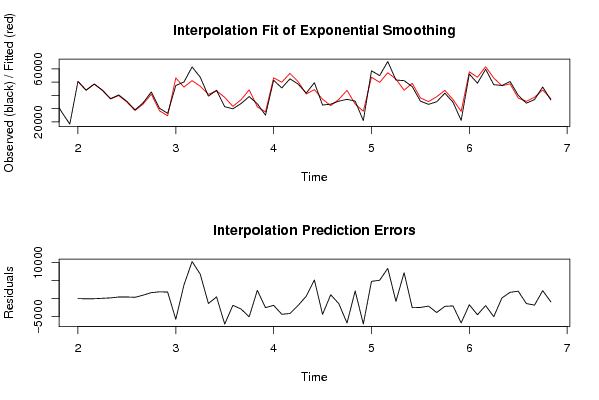
Estimated Parameters of Exponential Smoothing
ParameterValue
alpha0.0512572023237067
beta0.000425534174426851
gamma0.368605978861188

\begin{tabular}{lllllllll}
\hline
Estimated Parameters of Exponential Smoothing \tabularnewline
Parameter & Value \tabularnewline
alpha & 0.0512572023237067 \tabularnewline
beta & 0.000425534174426851 \tabularnewline
gamma & 0.368605978861188 \tabularnewline
\hline
\end{tabular}
%Source: https://freestatistics.org/blog/index.php?pk=12155&T=1

[TABLE]
[ROW][C]Estimated Parameters of Exponential Smoothing[/C][/ROW]
[ROW][C]Parameter[/C][C]Value[/C][/ROW]
[ROW][C]alpha[/C][C]0.0512572023237067[/C][/ROW]
[ROW][C]beta[/C][C]0.000425534174426851[/C][/ROW]
[ROW][C]gamma[/C][C]0.368605978861188[/C][/ROW]
[/TABLE]
Source: https://freestatistics.org/blog/index.php?pk=12155&T=1

Globally Unique Identifier (entire table): ba.freestatistics.org/blog/index.php?pk=12155&T=1

As an alternative you can also use a QR Code:  

The GUIDs for individual cells are displayed in the table below:

Estimated Parameters of Exponential Smoothing
ParameterValue
alpha0.0512572023237067
beta0.000425534174426851
gamma0.368605978861188


Interpolation Forecasts of Exponential Smoothing
tObservedFittedResiduals
135055650513.913472222342.0865277777484
144390143931.2207583048-30.2207583047857
154857248571.44611602930.553883970744209
164389943787.7905745671111.209425432884
173753237307.3093522476224.690647752417
184035739878.9830941168478.016905883196
193548935015.1520576101473.847942389897
202902728634.6593337898392.340666210152
213448533503.7889993038981.211000696247
224259840907.12391256631690.87608743375
233030628398.03782029561907.9621797044
242645124599.16223632681851.83776367317
254746053185.4184385894-5725.41843858944
265010446281.86421886073822.1357811393
276146551130.448299632110334.5517003679
285372646915.54301190386810.45698809622
293947740818.6392113461-1341.63921134615
304389543399.0913610341495.908638965913
313148138535.1926514143-7054.19265141433
322989631740.6385184796-1844.63851847958
333384236701.3022621247-2859.30226212471
343912044156.1382214801-5036.13822148014
353370231378.19156247652323.80843752350
362509427581.0424649268-2487.04246492677
375144253294.9844857149-1852.9844857149
384559449928.8458265112-4334.84582651125
395251856636.6482653981-4118.64826539807
404856450448.0286568094-1884.02865680936
414174541053.9275843732691.072415626775
424958544380.5739933985204.42600660197
433274737117.1504914113-4370.1504914113
443337932281.56920649231097.43079350767
453564537037.8103717844-1392.81037178441
463703443806.1958880827-6772.19588808271
473568133512.73706438892168.26293561106
482097228024.8078272187-7052.80782721868
495855253725.96602166374826.03397833632
505495549833.89016534235121.10983465765
516554057101.84398602258438.15601397752
525157052338.4574206109-768.457420610925
535114543902.23867172697242.76132827312
544664149143.3811748049-2502.38117480495
553570438136.7130716856-2432.71307168563
563325335312.6935494424-2059.69354944235
573519339036.3464977483-3843.34649774835
584166843797.9388594345-2129.93885943446
593486536869.170106547-2004.17010654703
602121027942.7138847405-6732.71388474049
615612657814.5247119142-1688.52471191416
624923153691.6491642271-4460.64916422707
635972361628.1982867365-1905.19828673649
644810353114.4667700857-5011.46677008567
654747247261.7842746308210.215725369184
665049748733.70845710131763.29154289868
674005937969.38981067052089.61018932947
683414935507.0592861287-1358.0592861287
693686038642.3638867948-1782.36388679480
704635644108.29423540962247.70576459042
713657737447.4877720114-870.487772011438

\begin{tabular}{lllllllll}
\hline
Interpolation Forecasts of Exponential Smoothing \tabularnewline
t & Observed & Fitted & Residuals \tabularnewline
13 & 50556 & 50513.9134722223 & 42.0865277777484 \tabularnewline
14 & 43901 & 43931.2207583048 & -30.2207583047857 \tabularnewline
15 & 48572 & 48571.4461160293 & 0.553883970744209 \tabularnewline
16 & 43899 & 43787.7905745671 & 111.209425432884 \tabularnewline
17 & 37532 & 37307.3093522476 & 224.690647752417 \tabularnewline
18 & 40357 & 39878.9830941168 & 478.016905883196 \tabularnewline
19 & 35489 & 35015.1520576101 & 473.847942389897 \tabularnewline
20 & 29027 & 28634.6593337898 & 392.340666210152 \tabularnewline
21 & 34485 & 33503.7889993038 & 981.211000696247 \tabularnewline
22 & 42598 & 40907.1239125663 & 1690.87608743375 \tabularnewline
23 & 30306 & 28398.0378202956 & 1907.9621797044 \tabularnewline
24 & 26451 & 24599.1622363268 & 1851.83776367317 \tabularnewline
25 & 47460 & 53185.4184385894 & -5725.41843858944 \tabularnewline
26 & 50104 & 46281.8642188607 & 3822.1357811393 \tabularnewline
27 & 61465 & 51130.4482996321 & 10334.5517003679 \tabularnewline
28 & 53726 & 46915.5430119038 & 6810.45698809622 \tabularnewline
29 & 39477 & 40818.6392113461 & -1341.63921134615 \tabularnewline
30 & 43895 & 43399.0913610341 & 495.908638965913 \tabularnewline
31 & 31481 & 38535.1926514143 & -7054.19265141433 \tabularnewline
32 & 29896 & 31740.6385184796 & -1844.63851847958 \tabularnewline
33 & 33842 & 36701.3022621247 & -2859.30226212471 \tabularnewline
34 & 39120 & 44156.1382214801 & -5036.13822148014 \tabularnewline
35 & 33702 & 31378.1915624765 & 2323.80843752350 \tabularnewline
36 & 25094 & 27581.0424649268 & -2487.04246492677 \tabularnewline
37 & 51442 & 53294.9844857149 & -1852.9844857149 \tabularnewline
38 & 45594 & 49928.8458265112 & -4334.84582651125 \tabularnewline
39 & 52518 & 56636.6482653981 & -4118.64826539807 \tabularnewline
40 & 48564 & 50448.0286568094 & -1884.02865680936 \tabularnewline
41 & 41745 & 41053.9275843732 & 691.072415626775 \tabularnewline
42 & 49585 & 44380.573993398 & 5204.42600660197 \tabularnewline
43 & 32747 & 37117.1504914113 & -4370.1504914113 \tabularnewline
44 & 33379 & 32281.5692064923 & 1097.43079350767 \tabularnewline
45 & 35645 & 37037.8103717844 & -1392.81037178441 \tabularnewline
46 & 37034 & 43806.1958880827 & -6772.19588808271 \tabularnewline
47 & 35681 & 33512.7370643889 & 2168.26293561106 \tabularnewline
48 & 20972 & 28024.8078272187 & -7052.80782721868 \tabularnewline
49 & 58552 & 53725.9660216637 & 4826.03397833632 \tabularnewline
50 & 54955 & 49833.8901653423 & 5121.10983465765 \tabularnewline
51 & 65540 & 57101.8439860225 & 8438.15601397752 \tabularnewline
52 & 51570 & 52338.4574206109 & -768.457420610925 \tabularnewline
53 & 51145 & 43902.2386717269 & 7242.76132827312 \tabularnewline
54 & 46641 & 49143.3811748049 & -2502.38117480495 \tabularnewline
55 & 35704 & 38136.7130716856 & -2432.71307168563 \tabularnewline
56 & 33253 & 35312.6935494424 & -2059.69354944235 \tabularnewline
57 & 35193 & 39036.3464977483 & -3843.34649774835 \tabularnewline
58 & 41668 & 43797.9388594345 & -2129.93885943446 \tabularnewline
59 & 34865 & 36869.170106547 & -2004.17010654703 \tabularnewline
60 & 21210 & 27942.7138847405 & -6732.71388474049 \tabularnewline
61 & 56126 & 57814.5247119142 & -1688.52471191416 \tabularnewline
62 & 49231 & 53691.6491642271 & -4460.64916422707 \tabularnewline
63 & 59723 & 61628.1982867365 & -1905.19828673649 \tabularnewline
64 & 48103 & 53114.4667700857 & -5011.46677008567 \tabularnewline
65 & 47472 & 47261.7842746308 & 210.215725369184 \tabularnewline
66 & 50497 & 48733.7084571013 & 1763.29154289868 \tabularnewline
67 & 40059 & 37969.3898106705 & 2089.61018932947 \tabularnewline
68 & 34149 & 35507.0592861287 & -1358.0592861287 \tabularnewline
69 & 36860 & 38642.3638867948 & -1782.36388679480 \tabularnewline
70 & 46356 & 44108.2942354096 & 2247.70576459042 \tabularnewline
71 & 36577 & 37447.4877720114 & -870.487772011438 \tabularnewline
\hline
\end{tabular}
%Source: https://freestatistics.org/blog/index.php?pk=12155&T=2

[TABLE]
[ROW][C]Interpolation Forecasts of Exponential Smoothing[/C][/ROW]
[ROW][C]t[/C][C]Observed[/C][C]Fitted[/C][C]Residuals[/C][/ROW]
[ROW][C]13[/C][C]50556[/C][C]50513.9134722223[/C][C]42.0865277777484[/C][/ROW]
[ROW][C]14[/C][C]43901[/C][C]43931.2207583048[/C][C]-30.2207583047857[/C][/ROW]
[ROW][C]15[/C][C]48572[/C][C]48571.4461160293[/C][C]0.553883970744209[/C][/ROW]
[ROW][C]16[/C][C]43899[/C][C]43787.7905745671[/C][C]111.209425432884[/C][/ROW]
[ROW][C]17[/C][C]37532[/C][C]37307.3093522476[/C][C]224.690647752417[/C][/ROW]
[ROW][C]18[/C][C]40357[/C][C]39878.9830941168[/C][C]478.016905883196[/C][/ROW]
[ROW][C]19[/C][C]35489[/C][C]35015.1520576101[/C][C]473.847942389897[/C][/ROW]
[ROW][C]20[/C][C]29027[/C][C]28634.6593337898[/C][C]392.340666210152[/C][/ROW]
[ROW][C]21[/C][C]34485[/C][C]33503.7889993038[/C][C]981.211000696247[/C][/ROW]
[ROW][C]22[/C][C]42598[/C][C]40907.1239125663[/C][C]1690.87608743375[/C][/ROW]
[ROW][C]23[/C][C]30306[/C][C]28398.0378202956[/C][C]1907.9621797044[/C][/ROW]
[ROW][C]24[/C][C]26451[/C][C]24599.1622363268[/C][C]1851.83776367317[/C][/ROW]
[ROW][C]25[/C][C]47460[/C][C]53185.4184385894[/C][C]-5725.41843858944[/C][/ROW]
[ROW][C]26[/C][C]50104[/C][C]46281.8642188607[/C][C]3822.1357811393[/C][/ROW]
[ROW][C]27[/C][C]61465[/C][C]51130.4482996321[/C][C]10334.5517003679[/C][/ROW]
[ROW][C]28[/C][C]53726[/C][C]46915.5430119038[/C][C]6810.45698809622[/C][/ROW]
[ROW][C]29[/C][C]39477[/C][C]40818.6392113461[/C][C]-1341.63921134615[/C][/ROW]
[ROW][C]30[/C][C]43895[/C][C]43399.0913610341[/C][C]495.908638965913[/C][/ROW]
[ROW][C]31[/C][C]31481[/C][C]38535.1926514143[/C][C]-7054.19265141433[/C][/ROW]
[ROW][C]32[/C][C]29896[/C][C]31740.6385184796[/C][C]-1844.63851847958[/C][/ROW]
[ROW][C]33[/C][C]33842[/C][C]36701.3022621247[/C][C]-2859.30226212471[/C][/ROW]
[ROW][C]34[/C][C]39120[/C][C]44156.1382214801[/C][C]-5036.13822148014[/C][/ROW]
[ROW][C]35[/C][C]33702[/C][C]31378.1915624765[/C][C]2323.80843752350[/C][/ROW]
[ROW][C]36[/C][C]25094[/C][C]27581.0424649268[/C][C]-2487.04246492677[/C][/ROW]
[ROW][C]37[/C][C]51442[/C][C]53294.9844857149[/C][C]-1852.9844857149[/C][/ROW]
[ROW][C]38[/C][C]45594[/C][C]49928.8458265112[/C][C]-4334.84582651125[/C][/ROW]
[ROW][C]39[/C][C]52518[/C][C]56636.6482653981[/C][C]-4118.64826539807[/C][/ROW]
[ROW][C]40[/C][C]48564[/C][C]50448.0286568094[/C][C]-1884.02865680936[/C][/ROW]
[ROW][C]41[/C][C]41745[/C][C]41053.9275843732[/C][C]691.072415626775[/C][/ROW]
[ROW][C]42[/C][C]49585[/C][C]44380.573993398[/C][C]5204.42600660197[/C][/ROW]
[ROW][C]43[/C][C]32747[/C][C]37117.1504914113[/C][C]-4370.1504914113[/C][/ROW]
[ROW][C]44[/C][C]33379[/C][C]32281.5692064923[/C][C]1097.43079350767[/C][/ROW]
[ROW][C]45[/C][C]35645[/C][C]37037.8103717844[/C][C]-1392.81037178441[/C][/ROW]
[ROW][C]46[/C][C]37034[/C][C]43806.1958880827[/C][C]-6772.19588808271[/C][/ROW]
[ROW][C]47[/C][C]35681[/C][C]33512.7370643889[/C][C]2168.26293561106[/C][/ROW]
[ROW][C]48[/C][C]20972[/C][C]28024.8078272187[/C][C]-7052.80782721868[/C][/ROW]
[ROW][C]49[/C][C]58552[/C][C]53725.9660216637[/C][C]4826.03397833632[/C][/ROW]
[ROW][C]50[/C][C]54955[/C][C]49833.8901653423[/C][C]5121.10983465765[/C][/ROW]
[ROW][C]51[/C][C]65540[/C][C]57101.8439860225[/C][C]8438.15601397752[/C][/ROW]
[ROW][C]52[/C][C]51570[/C][C]52338.4574206109[/C][C]-768.457420610925[/C][/ROW]
[ROW][C]53[/C][C]51145[/C][C]43902.2386717269[/C][C]7242.76132827312[/C][/ROW]
[ROW][C]54[/C][C]46641[/C][C]49143.3811748049[/C][C]-2502.38117480495[/C][/ROW]
[ROW][C]55[/C][C]35704[/C][C]38136.7130716856[/C][C]-2432.71307168563[/C][/ROW]
[ROW][C]56[/C][C]33253[/C][C]35312.6935494424[/C][C]-2059.69354944235[/C][/ROW]
[ROW][C]57[/C][C]35193[/C][C]39036.3464977483[/C][C]-3843.34649774835[/C][/ROW]
[ROW][C]58[/C][C]41668[/C][C]43797.9388594345[/C][C]-2129.93885943446[/C][/ROW]
[ROW][C]59[/C][C]34865[/C][C]36869.170106547[/C][C]-2004.17010654703[/C][/ROW]
[ROW][C]60[/C][C]21210[/C][C]27942.7138847405[/C][C]-6732.71388474049[/C][/ROW]
[ROW][C]61[/C][C]56126[/C][C]57814.5247119142[/C][C]-1688.52471191416[/C][/ROW]
[ROW][C]62[/C][C]49231[/C][C]53691.6491642271[/C][C]-4460.64916422707[/C][/ROW]
[ROW][C]63[/C][C]59723[/C][C]61628.1982867365[/C][C]-1905.19828673649[/C][/ROW]
[ROW][C]64[/C][C]48103[/C][C]53114.4667700857[/C][C]-5011.46677008567[/C][/ROW]
[ROW][C]65[/C][C]47472[/C][C]47261.7842746308[/C][C]210.215725369184[/C][/ROW]
[ROW][C]66[/C][C]50497[/C][C]48733.7084571013[/C][C]1763.29154289868[/C][/ROW]
[ROW][C]67[/C][C]40059[/C][C]37969.3898106705[/C][C]2089.61018932947[/C][/ROW]
[ROW][C]68[/C][C]34149[/C][C]35507.0592861287[/C][C]-1358.0592861287[/C][/ROW]
[ROW][C]69[/C][C]36860[/C][C]38642.3638867948[/C][C]-1782.36388679480[/C][/ROW]
[ROW][C]70[/C][C]46356[/C][C]44108.2942354096[/C][C]2247.70576459042[/C][/ROW]
[ROW][C]71[/C][C]36577[/C][C]37447.4877720114[/C][C]-870.487772011438[/C][/ROW]
[/TABLE]
Source: https://freestatistics.org/blog/index.php?pk=12155&T=2

Globally Unique Identifier (entire table): ba.freestatistics.org/blog/index.php?pk=12155&T=2

As an alternative you can also use a QR Code:  

The GUIDs for individual cells are displayed in the table below:

Interpolation Forecasts of Exponential Smoothing
tObservedFittedResiduals
135055650513.913472222342.0865277777484
144390143931.2207583048-30.2207583047857
154857248571.44611602930.553883970744209
164389943787.7905745671111.209425432884
173753237307.3093522476224.690647752417
184035739878.9830941168478.016905883196
193548935015.1520576101473.847942389897
202902728634.6593337898392.340666210152
213448533503.7889993038981.211000696247
224259840907.12391256631690.87608743375
233030628398.03782029561907.9621797044
242645124599.16223632681851.83776367317
254746053185.4184385894-5725.41843858944
265010446281.86421886073822.1357811393
276146551130.448299632110334.5517003679
285372646915.54301190386810.45698809622
293947740818.6392113461-1341.63921134615
304389543399.0913610341495.908638965913
313148138535.1926514143-7054.19265141433
322989631740.6385184796-1844.63851847958
333384236701.3022621247-2859.30226212471
343912044156.1382214801-5036.13822148014
353370231378.19156247652323.80843752350
362509427581.0424649268-2487.04246492677
375144253294.9844857149-1852.9844857149
384559449928.8458265112-4334.84582651125
395251856636.6482653981-4118.64826539807
404856450448.0286568094-1884.02865680936
414174541053.9275843732691.072415626775
424958544380.5739933985204.42600660197
433274737117.1504914113-4370.1504914113
443337932281.56920649231097.43079350767
453564537037.8103717844-1392.81037178441
463703443806.1958880827-6772.19588808271
473568133512.73706438892168.26293561106
482097228024.8078272187-7052.80782721868
495855253725.96602166374826.03397833632
505495549833.89016534235121.10983465765
516554057101.84398602258438.15601397752
525157052338.4574206109-768.457420610925
535114543902.23867172697242.76132827312
544664149143.3811748049-2502.38117480495
553570438136.7130716856-2432.71307168563
563325335312.6935494424-2059.69354944235
573519339036.3464977483-3843.34649774835
584166843797.9388594345-2129.93885943446
593486536869.170106547-2004.17010654703
602121027942.7138847405-6732.71388474049
615612657814.5247119142-1688.52471191416
624923153691.6491642271-4460.64916422707
635972361628.1982867365-1905.19828673649
644810353114.4667700857-5011.46677008567
654747247261.7842746308210.215725369184
665049748733.70845710131763.29154289868
674005937969.38981067052089.61018932947
683414935507.0592861287-1358.0592861287
693686038642.3638867948-1782.36388679480
704635644108.29423540962247.70576459042
713657737447.4877720114-870.487772011438


Extrapolation Forecasts of Exponential Smoothing
tForecast95% Lower Bound95% Upper Bound
7226925.129492815819538.982034004534311.2769516272
7358905.820408657251509.968250331566301.6725669828
7453899.849991911546494.297610337861305.4023734853
7562958.61133311255543.363183489370373.8594827346
7653456.175611757746031.236128336360881.115095179
7749686.503473755342251.877069953957121.1298775567
7851690.827832016744246.518900538459135.136763495
7940950.252547472833496.265460420748404.2396345249
8037175.083681907929711.422790899944638.744572916
8140231.605241190932758.274877472847704.935604909
8247198.289412091839715.293886650854681.2849375327
8339331.782320164731839.125923841146824.4387164884

\begin{tabular}{lllllllll}
\hline
Extrapolation Forecasts of Exponential Smoothing \tabularnewline
t & Forecast & 95% Lower Bound & 95% Upper Bound \tabularnewline
72 & 26925.1294928158 & 19538.9820340045 & 34311.2769516272 \tabularnewline
73 & 58905.8204086572 & 51509.9682503315 & 66301.6725669828 \tabularnewline
74 & 53899.8499919115 & 46494.2976103378 & 61305.4023734853 \tabularnewline
75 & 62958.611333112 & 55543.3631834893 & 70373.8594827346 \tabularnewline
76 & 53456.1756117577 & 46031.2361283363 & 60881.115095179 \tabularnewline
77 & 49686.5034737553 & 42251.8770699539 & 57121.1298775567 \tabularnewline
78 & 51690.8278320167 & 44246.5189005384 & 59135.136763495 \tabularnewline
79 & 40950.2525474728 & 33496.2654604207 & 48404.2396345249 \tabularnewline
80 & 37175.0836819079 & 29711.4227908999 & 44638.744572916 \tabularnewline
81 & 40231.6052411909 & 32758.2748774728 & 47704.935604909 \tabularnewline
82 & 47198.2894120918 & 39715.2938866508 & 54681.2849375327 \tabularnewline
83 & 39331.7823201647 & 31839.1259238411 & 46824.4387164884 \tabularnewline
\hline
\end{tabular}
%Source: https://freestatistics.org/blog/index.php?pk=12155&T=3

[TABLE]
[ROW][C]Extrapolation Forecasts of Exponential Smoothing[/C][/ROW]
[ROW][C]t[/C][C]Forecast[/C][C]95% Lower Bound[/C][C]95% Upper Bound[/C][/ROW]
[ROW][C]72[/C][C]26925.1294928158[/C][C]19538.9820340045[/C][C]34311.2769516272[/C][/ROW]
[ROW][C]73[/C][C]58905.8204086572[/C][C]51509.9682503315[/C][C]66301.6725669828[/C][/ROW]
[ROW][C]74[/C][C]53899.8499919115[/C][C]46494.2976103378[/C][C]61305.4023734853[/C][/ROW]
[ROW][C]75[/C][C]62958.611333112[/C][C]55543.3631834893[/C][C]70373.8594827346[/C][/ROW]
[ROW][C]76[/C][C]53456.1756117577[/C][C]46031.2361283363[/C][C]60881.115095179[/C][/ROW]
[ROW][C]77[/C][C]49686.5034737553[/C][C]42251.8770699539[/C][C]57121.1298775567[/C][/ROW]
[ROW][C]78[/C][C]51690.8278320167[/C][C]44246.5189005384[/C][C]59135.136763495[/C][/ROW]
[ROW][C]79[/C][C]40950.2525474728[/C][C]33496.2654604207[/C][C]48404.2396345249[/C][/ROW]
[ROW][C]80[/C][C]37175.0836819079[/C][C]29711.4227908999[/C][C]44638.744572916[/C][/ROW]
[ROW][C]81[/C][C]40231.6052411909[/C][C]32758.2748774728[/C][C]47704.935604909[/C][/ROW]
[ROW][C]82[/C][C]47198.2894120918[/C][C]39715.2938866508[/C][C]54681.2849375327[/C][/ROW]
[ROW][C]83[/C][C]39331.7823201647[/C][C]31839.1259238411[/C][C]46824.4387164884[/C][/ROW]
[/TABLE]
Source: https://freestatistics.org/blog/index.php?pk=12155&T=3

Globally Unique Identifier (entire table): ba.freestatistics.org/blog/index.php?pk=12155&T=3

As an alternative you can also use a QR Code:  

The GUIDs for individual cells are displayed in the table below:

Extrapolation Forecasts of Exponential Smoothing
tForecast95% Lower Bound95% Upper Bound
7226925.129492815819538.982034004534311.2769516272
7358905.820408657251509.968250331566301.6725669828
7453899.849991911546494.297610337861305.4023734853
7562958.61133311255543.363183489370373.8594827346
7653456.175611757746031.236128336360881.115095179
7749686.503473755342251.877069953957121.1298775567
7851690.827832016744246.518900538459135.136763495
7940950.252547472833496.265460420748404.2396345249
8037175.083681907929711.422790899944638.744572916
8140231.605241190932758.274877472847704.935604909
8247198.289412091839715.293886650854681.2849375327
8339331.782320164731839.125923841146824.4387164884


Parameters (Session):
par1 = 12 ; par2 = Triple ; par3 = additive ;
Parameters (R input):
par1 = 12 ; par2 = Triple ; par3 = additive ;
R code (references can be found in the software module):
par1 <- as.numeric(par1)
if (par2 == 'Single') K <- 1
if (par2 == 'Double') K <- 2
if (par2 == 'Triple') K <- par1
nx <- length(x)
nxmK <- nx - K
x <- ts(x, frequency = par1)
if (par2 == 'Single') fit <- HoltWinters(x, gamma=0, beta=0)
if (par2 == 'Double') fit <- HoltWinters(x, gamma=0)
if (par2 == 'Triple') fit <- HoltWinters(x, seasonal=par3)
fit
myresid <- x - fit$fitted[,'xhat']
bitmap(file='test1.png')
op <- par(mfrow=c(2,1))
plot(fit,ylab='Observed (black) / Fitted (red)',main='Interpolation Fit of Exponential Smoothing')
plot(myresid,ylab='Residuals',main='Interpolation Prediction Errors')
par(op)
dev.off()
bitmap(file='test2.png')
p <- predict(fit, par1, prediction.interval=TRUE)
np <- length(p[,1])
plot(fit,p,ylab='Observed (black) / Fitted (red)',main='Extrapolation Fit of Exponential Smoothing')
dev.off()
bitmap(file='test3.png')
op <- par(mfrow = c(2,2))
acf(as.numeric(myresid),lag.max = nx/2,main='Residual ACF')
spectrum(myresid,main='Residals Periodogram')
cpgram(myresid,main='Residal Cumulative Periodogram')
qqnorm(myresid,main='Residual Normal QQ Plot')
qqline(myresid)
par(op)
dev.off()
load(file='createtable')
a<-table.start()
a<-table.row.start(a)
a<-table.element(a,'Estimated Parameters of Exponential Smoothing',2,TRUE)
a<-table.row.end(a)
a<-table.row.start(a)
a<-table.element(a,'Parameter',header=TRUE)
a<-table.element(a,'Value',header=TRUE)
a<-table.row.end(a)
a<-table.row.start(a)
a<-table.element(a,'alpha',header=TRUE)
a<-table.element(a,fit$alpha)
a<-table.row.end(a)
a<-table.row.start(a)
a<-table.element(a,'beta',header=TRUE)
a<-table.element(a,fit$beta)
a<-table.row.end(a)
a<-table.row.start(a)
a<-table.element(a,'gamma',header=TRUE)
a<-table.element(a,fit$gamma)
a<-table.row.end(a)
a<-table.end(a)
table.save(a,file='mytable.tab')
a<-table.start()
a<-table.row.start(a)
a<-table.element(a,'Interpolation Forecasts of Exponential Smoothing',4,TRUE)
a<-table.row.end(a)
a<-table.row.start(a)
a<-table.element(a,'t',header=TRUE)
a<-table.element(a,'Observed',header=TRUE)
a<-table.element(a,'Fitted',header=TRUE)
a<-table.element(a,'Residuals',header=TRUE)
a<-table.row.end(a)
for (i in 1:nxmK) {
a<-table.row.start(a)
a<-table.element(a,i+K,header=TRUE)
a<-table.element(a,x[i+K])
a<-table.element(a,fit$fitted[i,'xhat'])
a<-table.element(a,myresid[i])
a<-table.row.end(a)
}
a<-table.end(a)
table.save(a,file='mytable1.tab')
a<-table.start()
a<-table.row.start(a)
a<-table.element(a,'Extrapolation Forecasts of Exponential Smoothing',4,TRUE)
a<-table.row.end(a)
a<-table.row.start(a)
a<-table.element(a,'t',header=TRUE)
a<-table.element(a,'Forecast',header=TRUE)
a<-table.element(a,'95% Lower Bound',header=TRUE)
a<-table.element(a,'95% Upper Bound',header=TRUE)
a<-table.row.end(a)
for (i in 1:np) {
a<-table.row.start(a)
a<-table.element(a,nx+i,header=TRUE)
a<-table.element(a,p[i,'fit'])
a<-table.element(a,p[i,'lwr'])
a<-table.element(a,p[i,'upr'])
a<-table.row.end(a)
}
a<-table.end(a)
table.save(a,file='mytable2.tab')