Free Statistics

of Irreproducible Research!

Author's title

Author*Unverified author*
R Software Modulerwasp_multipleregression.wasp
Title produced by softwareMultiple Regression
Date of computationWed, 16 Jan 2008 14:13:03 -0700
Cite this page as followsStatistical Computations at FreeStatistics.org, Office for Research Development and Education, URL https://freestatistics.org/blog/index.php?v=date/2008/Jan/16/t1200517939xj6siqrf0o0xt2z.htm/, Retrieved Tue, 30 Apr 2024 14:34:22 +0000
Statistical Computations at FreeStatistics.org, Office for Research Development and Education, URL https://freestatistics.org/blog/index.php?pk=8010, Retrieved Tue, 30 Apr 2024 14:34:22 +0000
QR Codes:

Original text written by user:
IsPrivate?No (this computation is public)
User-defined keywords
Estimated Impact279
Family? (F = Feedback message, R = changed R code, M = changed R Module, P = changed Parameters, D = changed Data)
-       [Multiple Regression] [] [2008-01-16 21:13:03] [d41d8cd98f00b204e9800998ecf8427e] [Current]
-  M D    [Multiple Regression] [] [2010-11-23 08:14:49] [717f3d787904f94c39256c5c1fc72d4c]
Feedback Forum

Post a new message
Dataseries X:
281	0,88
295	0,87
294	0,88
302	0,89
314	0,92
321	0,96
313	0,99
310	0,98
319	0,98
316	0,98
319	1,00
333	1,02
356	1,06
358	1,08
340	1,08
328	1,08
355	1,16
356	1,17
351	1,14
359	1,11
378	1,12
378	1,17
389.	1,17
407	1,23
413	1,26
404	1,26
406	1,23
402	1,20
383	1,20
392	1,21
398	1,23
400	1,22
405	1,22
420	1,25
439	1,30
441	1,34
424	1,31
423	1,30
434	1,32
429	1,29
421	1,27
430	1,22
424	1,20
437	1,23
456	1,23
469	1,20
476	1,18
510	1,19
549	1,21
554	1,19
557	1,20
610	1,23
675	1,28
596	1,27
633	1,27
632	1,28
596	1,27
585	1,26
627	1,29
629	1,32


Summary of compuational transaction
Raw Inputview raw input (R code)
Raw Outputview raw output of R engine
Computing time6 seconds
R Server'George Udny Yule' @ 72.249.76.132

\begin{tabular}{lllllllll}
\hline
Summary of compuational transaction \tabularnewline
Raw Input & view raw input (R code)  \tabularnewline
Raw Output & view raw output of R engine  \tabularnewline
Computing time & 6 seconds \tabularnewline
R Server & 'George Udny Yule' @ 72.249.76.132 \tabularnewline
\hline
\end{tabular}
%Source: https://freestatistics.org/blog/index.php?pk=8010&T=0

[TABLE]
[ROW][C]Summary of compuational transaction[/C][/ROW]
[ROW][C]Raw Input[/C][C]view raw input (R code) [/C][/ROW]
[ROW][C]Raw Output[/C][C]view raw output of R engine [/C][/ROW]
[ROW][C]Computing time[/C][C]6 seconds[/C][/ROW]
[ROW][C]R Server[/C][C]'George Udny Yule' @ 72.249.76.132[/C][/ROW]
[/TABLE]
Source: https://freestatistics.org/blog/index.php?pk=8010&T=0

Globally Unique Identifier (entire table): ba.freestatistics.org/blog/index.php?pk=8010&T=0

As an alternative you can also use a QR Code:  

The GUIDs for individual cells are displayed in the table below:

Summary of compuational transaction
Raw Inputview raw input (R code)
Raw Outputview raw output of R engine
Computing time6 seconds
R Server'George Udny Yule' @ 72.249.76.132


Multiple Linear Regression - Estimated Regression Equation
Goud[t] = -241.289698329808 + 573.062017176642Dollar[t] + e[t]

\begin{tabular}{lllllllll}
\hline
Multiple Linear Regression - Estimated Regression Equation \tabularnewline
Goud[t] =  -241.289698329808 +  573.062017176642Dollar[t]  + e[t] \tabularnewline
\hline
\end{tabular}
%Source: https://freestatistics.org/blog/index.php?pk=8010&T=1

[TABLE]
[ROW][C]Multiple Linear Regression - Estimated Regression Equation[/C][/ROW]
[ROW][C]Goud[t] =  -241.289698329808 +  573.062017176642Dollar[t]  + e[t][/C][/ROW]
[/TABLE]
Source: https://freestatistics.org/blog/index.php?pk=8010&T=1

Globally Unique Identifier (entire table): ba.freestatistics.org/blog/index.php?pk=8010&T=1

As an alternative you can also use a QR Code:  

The GUIDs for individual cells are displayed in the table below:

Multiple Linear Regression - Estimated Regression Equation
Goud[t] = -241.289698329808 + 573.062017176642Dollar[t] + e[t]


Multiple Linear Regression - Ordinary Least Squares
VariableParameterS.D.T-STATH0: parameter = 02-tail p-value1-tail p-value
(Intercept)-241.28969832980887.736427-2.75020.0079310.003966
Dollar573.06201717664274.9207017.648900

\begin{tabular}{lllllllll}
\hline
Multiple Linear Regression - Ordinary Least Squares \tabularnewline
Variable & Parameter & S.D. & T-STATH0: parameter = 0 & 2-tail p-value & 1-tail p-value \tabularnewline
(Intercept) & -241.289698329808 & 87.736427 & -2.7502 & 0.007931 & 0.003966 \tabularnewline
Dollar & 573.062017176642 & 74.920701 & 7.6489 & 0 & 0 \tabularnewline
\hline
\end{tabular}
%Source: https://freestatistics.org/blog/index.php?pk=8010&T=2

[TABLE]
[ROW][C]Multiple Linear Regression - Ordinary Least Squares[/C][/ROW]
[ROW][C]Variable[/C][C]Parameter[/C][C]S.D.[/C][C]T-STATH0: parameter = 0[/C][C]2-tail p-value[/C][C]1-tail p-value[/C][/ROW]
[ROW][C](Intercept)[/C][C]-241.289698329808[/C][C]87.736427[/C][C]-2.7502[/C][C]0.007931[/C][C]0.003966[/C][/ROW]
[ROW][C]Dollar[/C][C]573.062017176642[/C][C]74.920701[/C][C]7.6489[/C][C]0[/C][C]0[/C][/ROW]
[/TABLE]
Source: https://freestatistics.org/blog/index.php?pk=8010&T=2

Globally Unique Identifier (entire table): ba.freestatistics.org/blog/index.php?pk=8010&T=2

As an alternative you can also use a QR Code:  

The GUIDs for individual cells are displayed in the table below:

Multiple Linear Regression - Ordinary Least Squares
VariableParameterS.D.T-STATH0: parameter = 02-tail p-value1-tail p-value
(Intercept)-241.28969832980887.736427-2.75020.0079310.003966
Dollar573.06201717664274.9207017.648900


Multiple Linear Regression - Regression Statistics
Multiple R0.708640310638407
R-squared0.502171089861698
Adjusted R-squared0.493587832790348
F-TEST (value)58.5058895110912
F-TEST (DF numerator)1
F-TEST (DF denominator)58
p-value2.37870834141063e-10
Multiple Linear Regression - Residual Statistics
Residual Standard Deviation73.615386839386
Sum Squared Residuals314315.060411722

\begin{tabular}{lllllllll}
\hline
Multiple Linear Regression - Regression Statistics \tabularnewline
Multiple R & 0.708640310638407 \tabularnewline
R-squared & 0.502171089861698 \tabularnewline
Adjusted R-squared & 0.493587832790348 \tabularnewline
F-TEST (value) & 58.5058895110912 \tabularnewline
F-TEST (DF numerator) & 1 \tabularnewline
F-TEST (DF denominator) & 58 \tabularnewline
p-value & 2.37870834141063e-10 \tabularnewline
Multiple Linear Regression - Residual Statistics \tabularnewline
Residual Standard Deviation & 73.615386839386 \tabularnewline
Sum Squared Residuals & 314315.060411722 \tabularnewline
\hline
\end{tabular}
%Source: https://freestatistics.org/blog/index.php?pk=8010&T=3

[TABLE]
[ROW][C]Multiple Linear Regression - Regression Statistics[/C][/ROW]
[ROW][C]Multiple R[/C][C]0.708640310638407[/C][/ROW]
[ROW][C]R-squared[/C][C]0.502171089861698[/C][/ROW]
[ROW][C]Adjusted R-squared[/C][C]0.493587832790348[/C][/ROW]
[ROW][C]F-TEST (value)[/C][C]58.5058895110912[/C][/ROW]
[ROW][C]F-TEST (DF numerator)[/C][C]1[/C][/ROW]
[ROW][C]F-TEST (DF denominator)[/C][C]58[/C][/ROW]
[ROW][C]p-value[/C][C]2.37870834141063e-10[/C][/ROW]
[ROW][C]Multiple Linear Regression - Residual Statistics[/C][/ROW]
[ROW][C]Residual Standard Deviation[/C][C]73.615386839386[/C][/ROW]
[ROW][C]Sum Squared Residuals[/C][C]314315.060411722[/C][/ROW]
[/TABLE]
Source: https://freestatistics.org/blog/index.php?pk=8010&T=3

Globally Unique Identifier (entire table): ba.freestatistics.org/blog/index.php?pk=8010&T=3

As an alternative you can also use a QR Code:  

The GUIDs for individual cells are displayed in the table below:

Multiple Linear Regression - Regression Statistics
Multiple R0.708640310638407
R-squared0.502171089861698
Adjusted R-squared0.493587832790348
F-TEST (value)58.5058895110912
F-TEST (DF numerator)1
F-TEST (DF denominator)58
p-value2.37870834141063e-10
Multiple Linear Regression - Residual Statistics
Residual Standard Deviation73.615386839386
Sum Squared Residuals314315.060411722


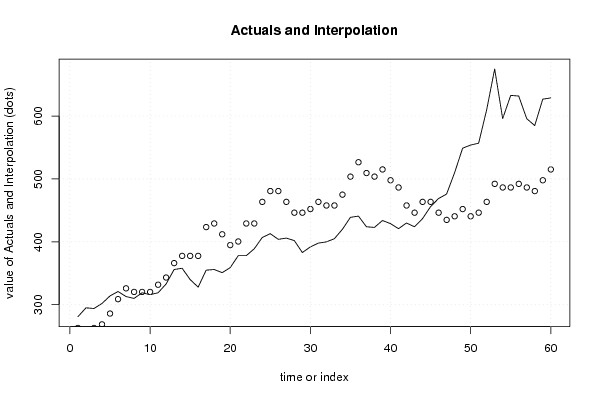
Multiple Linear Regression - Actuals, Interpolation, and Residuals
Time or IndexActualsInterpolationForecastResidualsPrediction Error
1281263.00487678563517.9951232143646
2295257.27425661387137.7257433861292
3294263.00487678563730.9951232143625
4302268.73549695740433.2645030425961
5314285.92735747270328.0726425272968
6321308.84983815976912.1501618402312
7313326.041698675068-13.0416986750681
8310320.311078503302-10.3110785033017
9319320.311078503302-1.31107850330170
10316320.311078503302-4.3110785033017
11319331.772318846835-12.7723188468346
12333343.233559190367-10.2335591903674
13356366.156039877433-10.1560398774331
14358377.617280220966-19.617280220966
15340377.617280220966-37.617280220966
16328377.617280220966-49.617280220966
17355423.462241595097-68.4622415950973
18356429.192861766864-73.1928617668637
19351412.001001251564-61.0010012515645
20359394.809140736265-35.8091407362653
21378400.539760908032-22.5397609080317
22378429.192861766864-51.1928617668637
23389429.192861766864-40.1928617668637
24407463.576582797462-56.5765827974623
25413480.768443312762-67.7684433127616
26404480.768443312762-76.7684433127616
27406463.576582797462-57.5765827974623
28402446.384722282163-44.3847222821630
29383446.384722282163-63.384722282163
30392452.11534245393-60.1153424539295
31398463.576582797462-65.5765827974623
32400457.845962625696-57.8459626256959
33405457.845962625696-52.8459626256959
34420475.037823140995-55.0378231409952
35439503.690923999827-64.6909239998273
36441526.613404686893-85.613404686893
37424509.421544171594-85.4215441715938
38423503.690923999827-80.6909239998273
39434515.15216434336-81.1521643433602
40429497.960303828061-68.9603038280609
41421486.499063484528-65.499063484528
42430457.845962625696-27.8459626256959
43424446.384722282163-22.3847222821630
44437463.576582797462-26.5765827974623
45456463.576582797462-7.57658279746233
46469446.38472228216322.6152777178370
47476434.9234819386341.0765180613698
48510440.65410211039769.3458978896034
49549452.1153424539396.8846575460705
50554440.654102110397113.345897889603
51557446.384722282163110.615277717837
52610463.576582797462146.423417202538
53675492.229683656294182.770316343706
54596486.499063484528109.500936515472
55633486.499063484528146.500936515472
56632492.229683656294139.770316343706
57596486.499063484528109.500936515472
58585480.768443312762104.231556687238
59627497.960303828061129.039696171939
60629515.15216434336113.847835656640

\begin{tabular}{lllllllll}
\hline
Multiple Linear Regression - Actuals, Interpolation, and Residuals \tabularnewline
Time or Index & Actuals & InterpolationForecast & ResidualsPrediction Error \tabularnewline
1 & 281 & 263.004876785635 & 17.9951232143646 \tabularnewline
2 & 295 & 257.274256613871 & 37.7257433861292 \tabularnewline
3 & 294 & 263.004876785637 & 30.9951232143625 \tabularnewline
4 & 302 & 268.735496957404 & 33.2645030425961 \tabularnewline
5 & 314 & 285.927357472703 & 28.0726425272968 \tabularnewline
6 & 321 & 308.849838159769 & 12.1501618402312 \tabularnewline
7 & 313 & 326.041698675068 & -13.0416986750681 \tabularnewline
8 & 310 & 320.311078503302 & -10.3110785033017 \tabularnewline
9 & 319 & 320.311078503302 & -1.31107850330170 \tabularnewline
10 & 316 & 320.311078503302 & -4.3110785033017 \tabularnewline
11 & 319 & 331.772318846835 & -12.7723188468346 \tabularnewline
12 & 333 & 343.233559190367 & -10.2335591903674 \tabularnewline
13 & 356 & 366.156039877433 & -10.1560398774331 \tabularnewline
14 & 358 & 377.617280220966 & -19.617280220966 \tabularnewline
15 & 340 & 377.617280220966 & -37.617280220966 \tabularnewline
16 & 328 & 377.617280220966 & -49.617280220966 \tabularnewline
17 & 355 & 423.462241595097 & -68.4622415950973 \tabularnewline
18 & 356 & 429.192861766864 & -73.1928617668637 \tabularnewline
19 & 351 & 412.001001251564 & -61.0010012515645 \tabularnewline
20 & 359 & 394.809140736265 & -35.8091407362653 \tabularnewline
21 & 378 & 400.539760908032 & -22.5397609080317 \tabularnewline
22 & 378 & 429.192861766864 & -51.1928617668637 \tabularnewline
23 & 389 & 429.192861766864 & -40.1928617668637 \tabularnewline
24 & 407 & 463.576582797462 & -56.5765827974623 \tabularnewline
25 & 413 & 480.768443312762 & -67.7684433127616 \tabularnewline
26 & 404 & 480.768443312762 & -76.7684433127616 \tabularnewline
27 & 406 & 463.576582797462 & -57.5765827974623 \tabularnewline
28 & 402 & 446.384722282163 & -44.3847222821630 \tabularnewline
29 & 383 & 446.384722282163 & -63.384722282163 \tabularnewline
30 & 392 & 452.11534245393 & -60.1153424539295 \tabularnewline
31 & 398 & 463.576582797462 & -65.5765827974623 \tabularnewline
32 & 400 & 457.845962625696 & -57.8459626256959 \tabularnewline
33 & 405 & 457.845962625696 & -52.8459626256959 \tabularnewline
34 & 420 & 475.037823140995 & -55.0378231409952 \tabularnewline
35 & 439 & 503.690923999827 & -64.6909239998273 \tabularnewline
36 & 441 & 526.613404686893 & -85.613404686893 \tabularnewline
37 & 424 & 509.421544171594 & -85.4215441715938 \tabularnewline
38 & 423 & 503.690923999827 & -80.6909239998273 \tabularnewline
39 & 434 & 515.15216434336 & -81.1521643433602 \tabularnewline
40 & 429 & 497.960303828061 & -68.9603038280609 \tabularnewline
41 & 421 & 486.499063484528 & -65.499063484528 \tabularnewline
42 & 430 & 457.845962625696 & -27.8459626256959 \tabularnewline
43 & 424 & 446.384722282163 & -22.3847222821630 \tabularnewline
44 & 437 & 463.576582797462 & -26.5765827974623 \tabularnewline
45 & 456 & 463.576582797462 & -7.57658279746233 \tabularnewline
46 & 469 & 446.384722282163 & 22.6152777178370 \tabularnewline
47 & 476 & 434.92348193863 & 41.0765180613698 \tabularnewline
48 & 510 & 440.654102110397 & 69.3458978896034 \tabularnewline
49 & 549 & 452.11534245393 & 96.8846575460705 \tabularnewline
50 & 554 & 440.654102110397 & 113.345897889603 \tabularnewline
51 & 557 & 446.384722282163 & 110.615277717837 \tabularnewline
52 & 610 & 463.576582797462 & 146.423417202538 \tabularnewline
53 & 675 & 492.229683656294 & 182.770316343706 \tabularnewline
54 & 596 & 486.499063484528 & 109.500936515472 \tabularnewline
55 & 633 & 486.499063484528 & 146.500936515472 \tabularnewline
56 & 632 & 492.229683656294 & 139.770316343706 \tabularnewline
57 & 596 & 486.499063484528 & 109.500936515472 \tabularnewline
58 & 585 & 480.768443312762 & 104.231556687238 \tabularnewline
59 & 627 & 497.960303828061 & 129.039696171939 \tabularnewline
60 & 629 & 515.15216434336 & 113.847835656640 \tabularnewline
\hline
\end{tabular}
%Source: https://freestatistics.org/blog/index.php?pk=8010&T=4

[TABLE]
[ROW][C]Multiple Linear Regression - Actuals, Interpolation, and Residuals[/C][/ROW]
[ROW][C]Time or Index[/C][C]Actuals[/C][C]InterpolationForecast[/C][C]ResidualsPrediction Error[/C][/ROW]
[ROW][C]1[/C][C]281[/C][C]263.004876785635[/C][C]17.9951232143646[/C][/ROW]
[ROW][C]2[/C][C]295[/C][C]257.274256613871[/C][C]37.7257433861292[/C][/ROW]
[ROW][C]3[/C][C]294[/C][C]263.004876785637[/C][C]30.9951232143625[/C][/ROW]
[ROW][C]4[/C][C]302[/C][C]268.735496957404[/C][C]33.2645030425961[/C][/ROW]
[ROW][C]5[/C][C]314[/C][C]285.927357472703[/C][C]28.0726425272968[/C][/ROW]
[ROW][C]6[/C][C]321[/C][C]308.849838159769[/C][C]12.1501618402312[/C][/ROW]
[ROW][C]7[/C][C]313[/C][C]326.041698675068[/C][C]-13.0416986750681[/C][/ROW]
[ROW][C]8[/C][C]310[/C][C]320.311078503302[/C][C]-10.3110785033017[/C][/ROW]
[ROW][C]9[/C][C]319[/C][C]320.311078503302[/C][C]-1.31107850330170[/C][/ROW]
[ROW][C]10[/C][C]316[/C][C]320.311078503302[/C][C]-4.3110785033017[/C][/ROW]
[ROW][C]11[/C][C]319[/C][C]331.772318846835[/C][C]-12.7723188468346[/C][/ROW]
[ROW][C]12[/C][C]333[/C][C]343.233559190367[/C][C]-10.2335591903674[/C][/ROW]
[ROW][C]13[/C][C]356[/C][C]366.156039877433[/C][C]-10.1560398774331[/C][/ROW]
[ROW][C]14[/C][C]358[/C][C]377.617280220966[/C][C]-19.617280220966[/C][/ROW]
[ROW][C]15[/C][C]340[/C][C]377.617280220966[/C][C]-37.617280220966[/C][/ROW]
[ROW][C]16[/C][C]328[/C][C]377.617280220966[/C][C]-49.617280220966[/C][/ROW]
[ROW][C]17[/C][C]355[/C][C]423.462241595097[/C][C]-68.4622415950973[/C][/ROW]
[ROW][C]18[/C][C]356[/C][C]429.192861766864[/C][C]-73.1928617668637[/C][/ROW]
[ROW][C]19[/C][C]351[/C][C]412.001001251564[/C][C]-61.0010012515645[/C][/ROW]
[ROW][C]20[/C][C]359[/C][C]394.809140736265[/C][C]-35.8091407362653[/C][/ROW]
[ROW][C]21[/C][C]378[/C][C]400.539760908032[/C][C]-22.5397609080317[/C][/ROW]
[ROW][C]22[/C][C]378[/C][C]429.192861766864[/C][C]-51.1928617668637[/C][/ROW]
[ROW][C]23[/C][C]389[/C][C]429.192861766864[/C][C]-40.1928617668637[/C][/ROW]
[ROW][C]24[/C][C]407[/C][C]463.576582797462[/C][C]-56.5765827974623[/C][/ROW]
[ROW][C]25[/C][C]413[/C][C]480.768443312762[/C][C]-67.7684433127616[/C][/ROW]
[ROW][C]26[/C][C]404[/C][C]480.768443312762[/C][C]-76.7684433127616[/C][/ROW]
[ROW][C]27[/C][C]406[/C][C]463.576582797462[/C][C]-57.5765827974623[/C][/ROW]
[ROW][C]28[/C][C]402[/C][C]446.384722282163[/C][C]-44.3847222821630[/C][/ROW]
[ROW][C]29[/C][C]383[/C][C]446.384722282163[/C][C]-63.384722282163[/C][/ROW]
[ROW][C]30[/C][C]392[/C][C]452.11534245393[/C][C]-60.1153424539295[/C][/ROW]
[ROW][C]31[/C][C]398[/C][C]463.576582797462[/C][C]-65.5765827974623[/C][/ROW]
[ROW][C]32[/C][C]400[/C][C]457.845962625696[/C][C]-57.8459626256959[/C][/ROW]
[ROW][C]33[/C][C]405[/C][C]457.845962625696[/C][C]-52.8459626256959[/C][/ROW]
[ROW][C]34[/C][C]420[/C][C]475.037823140995[/C][C]-55.0378231409952[/C][/ROW]
[ROW][C]35[/C][C]439[/C][C]503.690923999827[/C][C]-64.6909239998273[/C][/ROW]
[ROW][C]36[/C][C]441[/C][C]526.613404686893[/C][C]-85.613404686893[/C][/ROW]
[ROW][C]37[/C][C]424[/C][C]509.421544171594[/C][C]-85.4215441715938[/C][/ROW]
[ROW][C]38[/C][C]423[/C][C]503.690923999827[/C][C]-80.6909239998273[/C][/ROW]
[ROW][C]39[/C][C]434[/C][C]515.15216434336[/C][C]-81.1521643433602[/C][/ROW]
[ROW][C]40[/C][C]429[/C][C]497.960303828061[/C][C]-68.9603038280609[/C][/ROW]
[ROW][C]41[/C][C]421[/C][C]486.499063484528[/C][C]-65.499063484528[/C][/ROW]
[ROW][C]42[/C][C]430[/C][C]457.845962625696[/C][C]-27.8459626256959[/C][/ROW]
[ROW][C]43[/C][C]424[/C][C]446.384722282163[/C][C]-22.3847222821630[/C][/ROW]
[ROW][C]44[/C][C]437[/C][C]463.576582797462[/C][C]-26.5765827974623[/C][/ROW]
[ROW][C]45[/C][C]456[/C][C]463.576582797462[/C][C]-7.57658279746233[/C][/ROW]
[ROW][C]46[/C][C]469[/C][C]446.384722282163[/C][C]22.6152777178370[/C][/ROW]
[ROW][C]47[/C][C]476[/C][C]434.92348193863[/C][C]41.0765180613698[/C][/ROW]
[ROW][C]48[/C][C]510[/C][C]440.654102110397[/C][C]69.3458978896034[/C][/ROW]
[ROW][C]49[/C][C]549[/C][C]452.11534245393[/C][C]96.8846575460705[/C][/ROW]
[ROW][C]50[/C][C]554[/C][C]440.654102110397[/C][C]113.345897889603[/C][/ROW]
[ROW][C]51[/C][C]557[/C][C]446.384722282163[/C][C]110.615277717837[/C][/ROW]
[ROW][C]52[/C][C]610[/C][C]463.576582797462[/C][C]146.423417202538[/C][/ROW]
[ROW][C]53[/C][C]675[/C][C]492.229683656294[/C][C]182.770316343706[/C][/ROW]
[ROW][C]54[/C][C]596[/C][C]486.499063484528[/C][C]109.500936515472[/C][/ROW]
[ROW][C]55[/C][C]633[/C][C]486.499063484528[/C][C]146.500936515472[/C][/ROW]
[ROW][C]56[/C][C]632[/C][C]492.229683656294[/C][C]139.770316343706[/C][/ROW]
[ROW][C]57[/C][C]596[/C][C]486.499063484528[/C][C]109.500936515472[/C][/ROW]
[ROW][C]58[/C][C]585[/C][C]480.768443312762[/C][C]104.231556687238[/C][/ROW]
[ROW][C]59[/C][C]627[/C][C]497.960303828061[/C][C]129.039696171939[/C][/ROW]
[ROW][C]60[/C][C]629[/C][C]515.15216434336[/C][C]113.847835656640[/C][/ROW]
[/TABLE]
Source: https://freestatistics.org/blog/index.php?pk=8010&T=4

Globally Unique Identifier (entire table): ba.freestatistics.org/blog/index.php?pk=8010&T=4

As an alternative you can also use a QR Code:  

The GUIDs for individual cells are displayed in the table below:

Multiple Linear Regression - Actuals, Interpolation, and Residuals
Time or IndexActualsInterpolationForecastResidualsPrediction Error
1281263.00487678563517.9951232143646
2295257.27425661387137.7257433861292
3294263.00487678563730.9951232143625
4302268.73549695740433.2645030425961
5314285.92735747270328.0726425272968
6321308.84983815976912.1501618402312
7313326.041698675068-13.0416986750681
8310320.311078503302-10.3110785033017
9319320.311078503302-1.31107850330170
10316320.311078503302-4.3110785033017
11319331.772318846835-12.7723188468346
12333343.233559190367-10.2335591903674
13356366.156039877433-10.1560398774331
14358377.617280220966-19.617280220966
15340377.617280220966-37.617280220966
16328377.617280220966-49.617280220966
17355423.462241595097-68.4622415950973
18356429.192861766864-73.1928617668637
19351412.001001251564-61.0010012515645
20359394.809140736265-35.8091407362653
21378400.539760908032-22.5397609080317
22378429.192861766864-51.1928617668637
23389429.192861766864-40.1928617668637
24407463.576582797462-56.5765827974623
25413480.768443312762-67.7684433127616
26404480.768443312762-76.7684433127616
27406463.576582797462-57.5765827974623
28402446.384722282163-44.3847222821630
29383446.384722282163-63.384722282163
30392452.11534245393-60.1153424539295
31398463.576582797462-65.5765827974623
32400457.845962625696-57.8459626256959
33405457.845962625696-52.8459626256959
34420475.037823140995-55.0378231409952
35439503.690923999827-64.6909239998273
36441526.613404686893-85.613404686893
37424509.421544171594-85.4215441715938
38423503.690923999827-80.6909239998273
39434515.15216434336-81.1521643433602
40429497.960303828061-68.9603038280609
41421486.499063484528-65.499063484528
42430457.845962625696-27.8459626256959
43424446.384722282163-22.3847222821630
44437463.576582797462-26.5765827974623
45456463.576582797462-7.57658279746233
46469446.38472228216322.6152777178370
47476434.9234819386341.0765180613698
48510440.65410211039769.3458978896034
49549452.1153424539396.8846575460705
50554440.654102110397113.345897889603
51557446.384722282163110.615277717837
52610463.576582797462146.423417202538
53675492.229683656294182.770316343706
54596486.499063484528109.500936515472
55633486.499063484528146.500936515472
56632492.229683656294139.770316343706
57596486.499063484528109.500936515472
58585480.768443312762104.231556687238
59627497.960303828061129.039696171939
60629515.15216434336113.847835656640


Parameters (Session):
par1 = 1 ; par2 = Do not include Seasonal Dummies ; par3 = No Linear Trend ;
Parameters (R input):
par1 = 1 ; par2 = Do not include Seasonal Dummies ; par3 = No Linear Trend ;
R code (references can be found in the software module):
library(lattice)
par1 <- as.numeric(par1)
x <- t(y)
k <- length(x[1,])
n <- length(x[,1])
x1 <- cbind(x[,par1], x[,1:k!=par1])
mycolnames <- c(colnames(x)[par1], colnames(x)[1:k!=par1])
colnames(x1) <- mycolnames #colnames(x)[par1]
x <- x1
if (par3 == 'First Differences'){
x2 <- array(0, dim=c(n-1,k), dimnames=list(1:(n-1), paste('(1-B)',colnames(x),sep='')))
for (i in 1:n-1) {
for (j in 1:k) {
x2[i,j] <- x[i+1,j] - x[i,j]
}
}
x <- x2
}
if (par2 == 'Include Monthly Dummies'){
x2 <- array(0, dim=c(n,11), dimnames=list(1:n, paste('M', seq(1:11), sep ='')))
for (i in 1:11){
x2[seq(i,n,12),i] <- 1
}
x <- cbind(x, x2)
}
if (par2 == 'Include Quarterly Dummies'){
x2 <- array(0, dim=c(n,3), dimnames=list(1:n, paste('Q', seq(1:3), sep ='')))
for (i in 1:3){
x2[seq(i,n,4),i] <- 1
}
x <- cbind(x, x2)
}
k <- length(x[1,])
if (par3 == 'Linear Trend'){
x <- cbind(x, c(1:n))
colnames(x)[k+1] <- 't'
}
x
k <- length(x[1,])
df <- as.data.frame(x)
(mylm <- lm(df))
(mysum <- summary(mylm))
bitmap(file='test0.png')
plot(x[,1], type='l', main='Actuals and Interpolation', ylab='value of Actuals and Interpolation (dots)', xlab='time or index')
points(x[,1]-mysum$resid)
grid()
dev.off()
bitmap(file='test1.png')
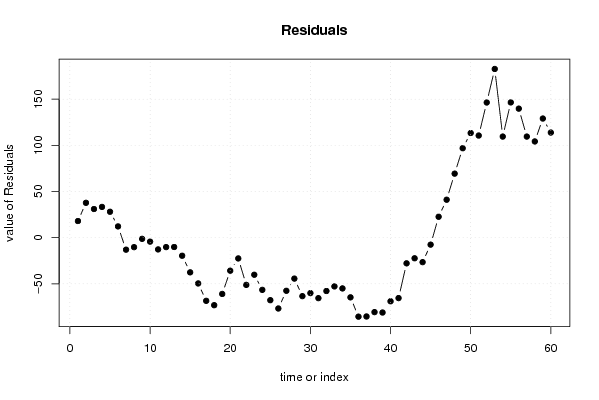
plot(mysum$resid, type='b', pch=19, main='Residuals', ylab='value of Residuals', xlab='time or index')
grid()
dev.off()
bitmap(file='test2.png')
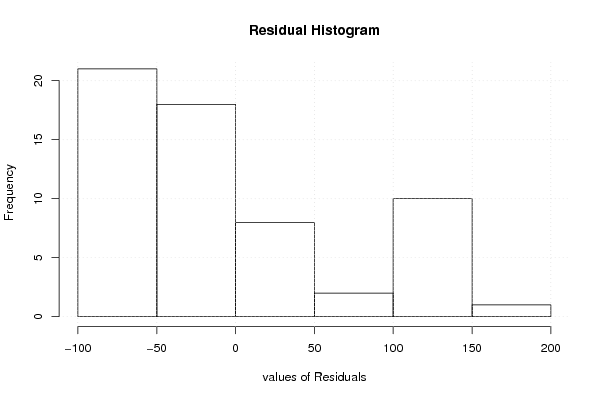
hist(mysum$resid, main='Residual Histogram', xlab='values of Residuals')
grid()
dev.off()
bitmap(file='test3.png')
densityplot(~mysum$resid,col='black',main='Residual Density Plot', xlab='values of Residuals')
dev.off()
bitmap(file='test4.png')
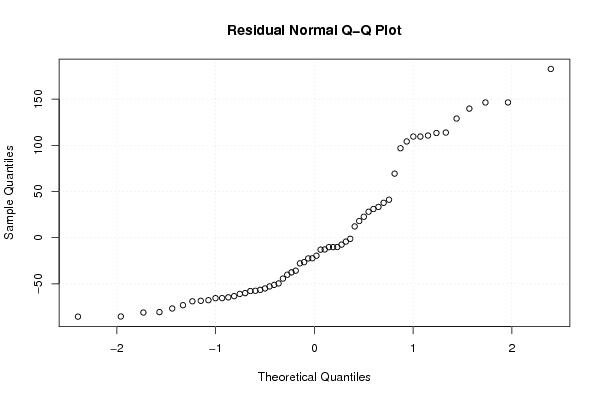
qqnorm(mysum$resid, main='Residual Normal Q-Q Plot')
grid()
dev.off()
(myerror <- as.ts(mysum$resid))
bitmap(file='test5.png')
dum <- cbind(lag(myerror,k=1),myerror)
dum
dum1 <- dum[2:length(myerror),]
dum1
z <- as.data.frame(dum1)
z
plot(z,main=paste('Residual Lag plot, lowess, and regression line'), ylab='values of Residuals', xlab='lagged values of Residuals')
lines(lowess(z))
abline(lm(z))
grid()
dev.off()
bitmap(file='test6.png')
acf(mysum$resid, lag.max=length(mysum$resid)/2, main='Residual Autocorrelation Function')
grid()
dev.off()
bitmap(file='test7.png')
pacf(mysum$resid, lag.max=length(mysum$resid)/2, main='Residual Partial Autocorrelation Function')
grid()
dev.off()
bitmap(file='test8.png')
opar <- par(mfrow = c(2,2), oma = c(0, 0, 1.1, 0))
plot(mylm, las = 1, sub='Residual Diagnostics')
par(opar)
dev.off()
load(file='createtable')
a<-table.start()
a<-table.row.start(a)
a<-table.element(a, 'Multiple Linear Regression - Estimated Regression Equation', 1, TRUE)
a<-table.row.end(a)
myeq <- colnames(x)[1]
myeq <- paste(myeq, '[t] = ', sep='')
for (i in 1:k){
if (mysum$coefficients[i,1] > 0) myeq <- paste(myeq, '+', '')
myeq <- paste(myeq, mysum$coefficients[i,1], sep=' ')
if (rownames(mysum$coefficients)[i] != '(Intercept)') {
myeq <- paste(myeq, rownames(mysum$coefficients)[i], sep='')
if (rownames(mysum$coefficients)[i] != 't') myeq <- paste(myeq, '[t]', sep='')
}
}
myeq <- paste(myeq, ' + e[t]')
a<-table.row.start(a)
a<-table.element(a, myeq)
a<-table.row.end(a)
a<-table.end(a)
table.save(a,file='mytable1.tab')
a<-table.start()
a<-table.row.start(a)
a<-table.element(a,hyperlink('ols1.htm','Multiple Linear Regression - Ordinary Least Squares',''), 6, TRUE)
a<-table.row.end(a)
a<-table.row.start(a)
a<-table.element(a,'Variable',header=TRUE)
a<-table.element(a,'Parameter',header=TRUE)
a<-table.element(a,'S.D.',header=TRUE)
a<-table.element(a,'T-STAT
H0: parameter = 0',header=TRUE)
a<-table.element(a,'2-tail p-value',header=TRUE)
a<-table.element(a,'1-tail p-value',header=TRUE)
a<-table.row.end(a)
for (i in 1:k){
a<-table.row.start(a)
a<-table.element(a,rownames(mysum$coefficients)[i],header=TRUE)
a<-table.element(a,mysum$coefficients[i,1])
a<-table.element(a, round(mysum$coefficients[i,2],6))
a<-table.element(a, round(mysum$coefficients[i,3],4))
a<-table.element(a, round(mysum$coefficients[i,4],6))
a<-table.element(a, round(mysum$coefficients[i,4]/2,6))
a<-table.row.end(a)
}
a<-table.end(a)
table.save(a,file='mytable2.tab')
a<-table.start()
a<-table.row.start(a)
a<-table.element(a, 'Multiple Linear Regression - Regression Statistics', 2, TRUE)
a<-table.row.end(a)
a<-table.row.start(a)
a<-table.element(a, 'Multiple R',1,TRUE)
a<-table.element(a, sqrt(mysum$r.squared))
a<-table.row.end(a)
a<-table.row.start(a)
a<-table.element(a, 'R-squared',1,TRUE)
a<-table.element(a, mysum$r.squared)
a<-table.row.end(a)
a<-table.row.start(a)
a<-table.element(a, 'Adjusted R-squared',1,TRUE)
a<-table.element(a, mysum$adj.r.squared)
a<-table.row.end(a)
a<-table.row.start(a)
a<-table.element(a, 'F-TEST (value)',1,TRUE)
a<-table.element(a, mysum$fstatistic[1])
a<-table.row.end(a)
a<-table.row.start(a)
a<-table.element(a, 'F-TEST (DF numerator)',1,TRUE)
a<-table.element(a, mysum$fstatistic[2])
a<-table.row.end(a)
a<-table.row.start(a)
a<-table.element(a, 'F-TEST (DF denominator)',1,TRUE)
a<-table.element(a, mysum$fstatistic[3])
a<-table.row.end(a)
a<-table.row.start(a)
a<-table.element(a, 'p-value',1,TRUE)
a<-table.element(a, 1-pf(mysum$fstatistic[1],mysum$fstatistic[2],mysum$fstatistic[3]))
a<-table.row.end(a)
a<-table.row.start(a)
a<-table.element(a, 'Multiple Linear Regression - Residual Statistics', 2, TRUE)
a<-table.row.end(a)
a<-table.row.start(a)
a<-table.element(a, 'Residual Standard Deviation',1,TRUE)
a<-table.element(a, mysum$sigma)
a<-table.row.end(a)
a<-table.row.start(a)
a<-table.element(a, 'Sum Squared Residuals',1,TRUE)
a<-table.element(a, sum(myerror*myerror))
a<-table.row.end(a)
a<-table.end(a)
table.save(a,file='mytable3.tab')
a<-table.start()
a<-table.row.start(a)
a<-table.element(a, 'Multiple Linear Regression - Actuals, Interpolation, and Residuals', 4, TRUE)
a<-table.row.end(a)
a<-table.row.start(a)
a<-table.element(a, 'Time or Index', 1, TRUE)
a<-table.element(a, 'Actuals', 1, TRUE)
a<-table.element(a, 'Interpolation
Forecast', 1, TRUE)
a<-table.element(a, 'Residuals
Prediction Error', 1, TRUE)
a<-table.row.end(a)
for (i in 1:n) {
a<-table.row.start(a)
a<-table.element(a,i, 1, TRUE)
a<-table.element(a,x[i])
a<-table.element(a,x[i]-mysum$resid[i])
a<-table.element(a,mysum$resid[i])
a<-table.row.end(a)
}
a<-table.end(a)
table.save(a,file='mytable4.tab')