\begin{tabular}{lllllllll}
\hline
Summary of compuational transaction \tabularnewline
Raw Input & view raw input (R code)  \tabularnewline
Raw Output & view raw output of R engine  \tabularnewline
Computing time & 4 seconds \tabularnewline
R Server & 'Herman Ole Andreas Wold' @ 193.190.124.10:1001 \tabularnewline
\hline
\end{tabular}
%Source: https://freestatistics.org/blog/index.php?pk=8744&T=0
[TABLE]
[ROW][C]Summary of compuational transaction[/C][/ROW]
[ROW][C]Raw Input[/C][C]view raw input (R code) [/C][/ROW]
[ROW][C]Raw Output[/C][C]view raw output of R engine [/C][/ROW]
[ROW][C]Computing time[/C][C]4 seconds[/C][/ROW]
[ROW][C]R Server[/C][C]'Herman Ole Andreas Wold' @ 193.190.124.10:1001[/C][/ROW]
[/TABLE]
Source: https://freestatistics.org/blog/index.php?pk=8744&T=0
If you paste this QR Code into your document, anyone with a smartphone or tablet will be able to scan it and view this table in a browser.
If you paste this QR Code into your document, anyone with a smartphone or tablet will be able to scan it and view this table in a browser.
If you paste this QR Code into your document, anyone with a smartphone or tablet will be able to scan it and view this table in a browser.
If you paste this QR Code into your document, anyone with a smartphone or tablet will be able to scan it and view this table in a browser.
If you paste this QR Code into your document, anyone with a smartphone or tablet will be able to scan it and view this table in a browser.
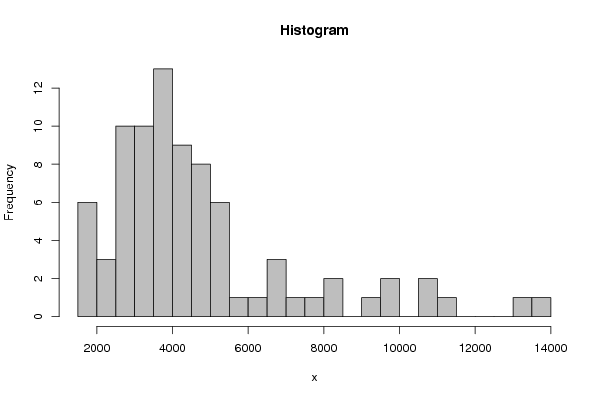
| Frequency Table (Histogram) | | Bins | Midpoint | Abs. Frequency | Rel. Frequency | Cumul. Rel. Freq. | Density | | [1500,2000[ | 1750 | 6 | 0.073171 | 0.073171 | 0.000146 | | [2000,2500[ | 2250 | 3 | 0.036585 | 0.109756 | 7.3e-05 | | [2500,3000[ | 2750 | 10 | 0.121951 | 0.231707 | 0.000244 | | [3000,3500[ | 3250 | 10 | 0.121951 | 0.353659 | 0.000244 | | [3500,4000[ | 3750 | 13 | 0.158537 | 0.512195 | 0.000317 | | [4000,4500[ | 4250 | 9 | 0.109756 | 0.621951 | 0.00022 | | [4500,5000[ | 4750 | 8 | 0.097561 | 0.719512 | 0.000195 | | [5000,5500[ | 5250 | 6 | 0.073171 | 0.792683 | 0.000146 | | [5500,6000[ | 5750 | 1 | 0.012195 | 0.804878 | 2.4e-05 | | [6000,6500[ | 6250 | 1 | 0.012195 | 0.817073 | 2.4e-05 | | [6500,7000[ | 6750 | 3 | 0.036585 | 0.853659 | 7.3e-05 | | [7000,7500[ | 7250 | 1 | 0.012195 | 0.865854 | 2.4e-05 | | [7500,8000[ | 7750 | 1 | 0.012195 | 0.878049 | 2.4e-05 | | [8000,8500[ | 8250 | 2 | 0.02439 | 0.902439 | 4.9e-05 | | [8500,9000[ | 8750 | 0 | 0 | 0.902439 | 0 | | [9000,9500[ | 9250 | 1 | 0.012195 | 0.914634 | 2.4e-05 | | [9500,10000[ | 9750 | 2 | 0.02439 | 0.939024 | 4.9e-05 | | [10000,10500[ | 10250 | 0 | 0 | 0.939024 | 0 | | [10500,11000[ | 10750 | 2 | 0.02439 | 0.963415 | 4.9e-05 | | [11000,11500[ | 11250 | 1 | 0.012195 | 0.97561 | 2.4e-05 | | [11500,12000[ | 11750 | 0 | 0 | 0.97561 | 0 | | [12000,12500[ | 12250 | 0 | 0 | 0.97561 | 0 | | [12500,13000[ | 12750 | 0 | 0 | 0.97561 | 0 | | [13000,13500[ | 13250 | 1 | 0.012195 | 0.987805 | 2.4e-05 | | [13500,14000] | 13750 | 1 | 0.012195 | 1 | 2.4e-05 |
\begin{tabular}{lllllllll}
\hline
Frequency Table (Histogram) \tabularnewline
Bins & Midpoint & Abs. Frequency & Rel. Frequency & Cumul. Rel. Freq. & Density \tabularnewline
[1500,2000[ & 1750 & 6 & 0.073171 & 0.073171 & 0.000146 \tabularnewline
[2000,2500[ & 2250 & 3 & 0.036585 & 0.109756 & 7.3e-05 \tabularnewline
[2500,3000[ & 2750 & 10 & 0.121951 & 0.231707 & 0.000244 \tabularnewline
[3000,3500[ & 3250 & 10 & 0.121951 & 0.353659 & 0.000244 \tabularnewline
[3500,4000[ & 3750 & 13 & 0.158537 & 0.512195 & 0.000317 \tabularnewline
[4000,4500[ & 4250 & 9 & 0.109756 & 0.621951 & 0.00022 \tabularnewline
[4500,5000[ & 4750 & 8 & 0.097561 & 0.719512 & 0.000195 \tabularnewline
[5000,5500[ & 5250 & 6 & 0.073171 & 0.792683 & 0.000146 \tabularnewline
[5500,6000[ & 5750 & 1 & 0.012195 & 0.804878 & 2.4e-05 \tabularnewline
[6000,6500[ & 6250 & 1 & 0.012195 & 0.817073 & 2.4e-05 \tabularnewline
[6500,7000[ & 6750 & 3 & 0.036585 & 0.853659 & 7.3e-05 \tabularnewline
[7000,7500[ & 7250 & 1 & 0.012195 & 0.865854 & 2.4e-05 \tabularnewline
[7500,8000[ & 7750 & 1 & 0.012195 & 0.878049 & 2.4e-05 \tabularnewline
[8000,8500[ & 8250 & 2 & 0.02439 & 0.902439 & 4.9e-05 \tabularnewline
[8500,9000[ & 8750 & 0 & 0 & 0.902439 & 0 \tabularnewline
[9000,9500[ & 9250 & 1 & 0.012195 & 0.914634 & 2.4e-05 \tabularnewline
[9500,10000[ & 9750 & 2 & 0.02439 & 0.939024 & 4.9e-05 \tabularnewline
[10000,10500[ & 10250 & 0 & 0 & 0.939024 & 0 \tabularnewline
[10500,11000[ & 10750 & 2 & 0.02439 & 0.963415 & 4.9e-05 \tabularnewline
[11000,11500[ & 11250 & 1 & 0.012195 & 0.97561 & 2.4e-05 \tabularnewline
[11500,12000[ & 11750 & 0 & 0 & 0.97561 & 0 \tabularnewline
[12000,12500[ & 12250 & 0 & 0 & 0.97561 & 0 \tabularnewline
[12500,13000[ & 12750 & 0 & 0 & 0.97561 & 0 \tabularnewline
[13000,13500[ & 13250 & 1 & 0.012195 & 0.987805 & 2.4e-05 \tabularnewline
[13500,14000] & 13750 & 1 & 0.012195 & 1 & 2.4e-05 \tabularnewline
\hline
\end{tabular}
%Source: https://freestatistics.org/blog/index.php?pk=8744&T=1
[TABLE]
[ROW][C]Frequency Table (Histogram)[/C][/ROW]
[ROW][C]Bins[/C][C]Midpoint[/C][C]Abs. Frequency[/C][C]Rel. Frequency[/C][C]Cumul. Rel. Freq.[/C][C]Density[/C][/ROW]
[ROW][C][1500,2000[[/C][C]1750[/C][C]6[/C][C]0.073171[/C][C]0.073171[/C][C]0.000146[/C][/ROW]
[ROW][C][2000,2500[[/C][C]2250[/C][C]3[/C][C]0.036585[/C][C]0.109756[/C][C]7.3e-05[/C][/ROW]
[ROW][C][2500,3000[[/C][C]2750[/C][C]10[/C][C]0.121951[/C][C]0.231707[/C][C]0.000244[/C][/ROW]
[ROW][C][3000,3500[[/C][C]3250[/C][C]10[/C][C]0.121951[/C][C]0.353659[/C][C]0.000244[/C][/ROW]
[ROW][C][3500,4000[[/C][C]3750[/C][C]13[/C][C]0.158537[/C][C]0.512195[/C][C]0.000317[/C][/ROW]
[ROW][C][4000,4500[[/C][C]4250[/C][C]9[/C][C]0.109756[/C][C]0.621951[/C][C]0.00022[/C][/ROW]
[ROW][C][4500,5000[[/C][C]4750[/C][C]8[/C][C]0.097561[/C][C]0.719512[/C][C]0.000195[/C][/ROW]
[ROW][C][5000,5500[[/C][C]5250[/C][C]6[/C][C]0.073171[/C][C]0.792683[/C][C]0.000146[/C][/ROW]
[ROW][C][5500,6000[[/C][C]5750[/C][C]1[/C][C]0.012195[/C][C]0.804878[/C][C]2.4e-05[/C][/ROW]
[ROW][C][6000,6500[[/C][C]6250[/C][C]1[/C][C]0.012195[/C][C]0.817073[/C][C]2.4e-05[/C][/ROW]
[ROW][C][6500,7000[[/C][C]6750[/C][C]3[/C][C]0.036585[/C][C]0.853659[/C][C]7.3e-05[/C][/ROW]
[ROW][C][7000,7500[[/C][C]7250[/C][C]1[/C][C]0.012195[/C][C]0.865854[/C][C]2.4e-05[/C][/ROW]
[ROW][C][7500,8000[[/C][C]7750[/C][C]1[/C][C]0.012195[/C][C]0.878049[/C][C]2.4e-05[/C][/ROW]
[ROW][C][8000,8500[[/C][C]8250[/C][C]2[/C][C]0.02439[/C][C]0.902439[/C][C]4.9e-05[/C][/ROW]
[ROW][C][8500,9000[[/C][C]8750[/C][C]0[/C][C]0[/C][C]0.902439[/C][C]0[/C][/ROW]
[ROW][C][9000,9500[[/C][C]9250[/C][C]1[/C][C]0.012195[/C][C]0.914634[/C][C]2.4e-05[/C][/ROW]
[ROW][C][9500,10000[[/C][C]9750[/C][C]2[/C][C]0.02439[/C][C]0.939024[/C][C]4.9e-05[/C][/ROW]
[ROW][C][10000,10500[[/C][C]10250[/C][C]0[/C][C]0[/C][C]0.939024[/C][C]0[/C][/ROW]
[ROW][C][10500,11000[[/C][C]10750[/C][C]2[/C][C]0.02439[/C][C]0.963415[/C][C]4.9e-05[/C][/ROW]
[ROW][C][11000,11500[[/C][C]11250[/C][C]1[/C][C]0.012195[/C][C]0.97561[/C][C]2.4e-05[/C][/ROW]
[ROW][C][11500,12000[[/C][C]11750[/C][C]0[/C][C]0[/C][C]0.97561[/C][C]0[/C][/ROW]
[ROW][C][12000,12500[[/C][C]12250[/C][C]0[/C][C]0[/C][C]0.97561[/C][C]0[/C][/ROW]
[ROW][C][12500,13000[[/C][C]12750[/C][C]0[/C][C]0[/C][C]0.97561[/C][C]0[/C][/ROW]
[ROW][C][13000,13500[[/C][C]13250[/C][C]1[/C][C]0.012195[/C][C]0.987805[/C][C]2.4e-05[/C][/ROW]
[ROW][C][13500,14000][/C][C]13750[/C][C]1[/C][C]0.012195[/C][C]1[/C][C]2.4e-05[/C][/ROW]
[/TABLE]
Source: https://freestatistics.org/blog/index.php?pk=8744&T=1
Globally Unique Identifier (entire table): ba.freestatistics.org/blog/index.php?pk=8744&T=1
As an alternative you can also use a QR Code:
The GUIDs for individual cells are displayed in the table below:
| Frequency Table (Histogram) | | Bins | Midpoint | Abs. Frequency | Rel. Frequency | Cumul. Rel. Freq. | Density | | [1500,2000[ | 1750 | 6 | 0.073171 | 0.073171 | 0.000146 | | [2000,2500[ | 2250 | 3 | 0.036585 | 0.109756 | 7.3e-05 | | [2500,3000[ | 2750 | 10 | 0.121951 | 0.231707 | 0.000244 | | [3000,3500[ | 3250 | 10 | 0.121951 | 0.353659 | 0.000244 | | [3500,4000[ | 3750 | 13 | 0.158537 | 0.512195 | 0.000317 | | [4000,4500[ | 4250 | 9 | 0.109756 | 0.621951 | 0.00022 | | [4500,5000[ | 4750 | 8 | 0.097561 | 0.719512 | 0.000195 | | [5000,5500[ | 5250 | 6 | 0.073171 | 0.792683 | 0.000146 | | [5500,6000[ | 5750 | 1 | 0.012195 | 0.804878 | 2.4e-05 | | [6000,6500[ | 6250 | 1 | 0.012195 | 0.817073 | 2.4e-05 | | [6500,7000[ | 6750 | 3 | 0.036585 | 0.853659 | 7.3e-05 | | [7000,7500[ | 7250 | 1 | 0.012195 | 0.865854 | 2.4e-05 | | [7500,8000[ | 7750 | 1 | 0.012195 | 0.878049 | 2.4e-05 | | [8000,8500[ | 8250 | 2 | 0.02439 | 0.902439 | 4.9e-05 | | [8500,9000[ | 8750 | 0 | 0 | 0.902439 | 0 | | [9000,9500[ | 9250 | 1 | 0.012195 | 0.914634 | 2.4e-05 | | [9500,10000[ | 9750 | 2 | 0.02439 | 0.939024 | 4.9e-05 | | [10000,10500[ | 10250 | 0 | 0 | 0.939024 | 0 | | [10500,11000[ | 10750 | 2 | 0.02439 | 0.963415 | 4.9e-05 | | [11000,11500[ | 11250 | 1 | 0.012195 | 0.97561 | 2.4e-05 | | [11500,12000[ | 11750 | 0 | 0 | 0.97561 | 0 | | [12000,12500[ | 12250 | 0 | 0 | 0.97561 | 0 | | [12500,13000[ | 12750 | 0 | 0 | 0.97561 | 0 | | [13000,13500[ | 13250 | 1 | 0.012195 | 0.987805 | 2.4e-05 | | [13500,14000] | 13750 | 1 | 0.012195 | 1 | 2.4e-05 |
If you paste this QR Code into your document, anyone with a smartphone or tablet will be able to scan it and view this table in a browser.
If you paste this QR Code into your document, anyone with a smartphone or tablet will be able to scan it and view this table in a browser.
If you paste this QR Code into your document, anyone with a smartphone or tablet will be able to scan it and view this table in a browser.
If you paste this QR Code into your document, anyone with a smartphone or tablet will be able to scan it and view this table in a browser.
If you paste this QR Code into your document, anyone with a smartphone or tablet will be able to scan it and view this table in a browser.
|