Free Statistics

of Irreproducible Research!

Author's title

Author*Unverified author*
R Software Modulerwasp_autocorrelation.wasp
Title produced by software(Partial) Autocorrelation Function
Date of computationTue, 23 Dec 2008 13:51:08 -0700
Cite this page as followsStatistical Computations at FreeStatistics.org, Office for Research Development and Education, URL https://freestatistics.org/blog/index.php?v=date/2008/Dec/23/t12300655202oblbuqaxj5ruot.htm/, Retrieved Fri, 24 May 2024 16:33:31 +0000
Statistical Computations at FreeStatistics.org, Office for Research Development and Education, URL https://freestatistics.org/blog/index.php?pk=36417, Retrieved Fri, 24 May 2024 16:33:31 +0000
QR Codes:

Original text written by user:
IsPrivate?No (this computation is public)
User-defined keywords
Estimated Impact123
Family? (F = Feedback message, R = changed R code, M = changed R Module, P = changed Parameters, D = changed Data)
-       [(Partial) Autocorrelation Function] [(P)ACF Mannen (d=...] [2008-12-23 20:51:08] [f0e1dc59aca2fa8d78080b39899f316a] [Current]
Feedback Forum

Post a new message
Dataseries X:
54156
53661
52441
50648
48141
46127
45623
56527
60205
61321
58088
54623
53495
51824
50518
49050
47111
45264
44357
54862
57871
59070
56273
52837
51702
49447
48965
46922
46256
45200
44471
53119
55016
56641
51847
47990
45744
46390
44461
41582
40813
38096
35461
44375
46255
45610
43375
40167
40628
40590
39473
36735
36634
32806
32907
41076
42254
43215
41116
40373


Summary of computational transaction
Raw Inputview raw input (R code)
Raw Outputview raw output of R engine
Computing time3 seconds
R Server'Herman Ole Andreas Wold' @ 193.190.124.10:1001

\begin{tabular}{lllllllll}
\hline
Summary of computational transaction \tabularnewline
Raw Input & view raw input (R code)  \tabularnewline
Raw Output & view raw output of R engine  \tabularnewline
Computing time & 3 seconds \tabularnewline
R Server & 'Herman Ole Andreas Wold' @ 193.190.124.10:1001 \tabularnewline
\hline
\end{tabular}
%Source: https://freestatistics.org/blog/index.php?pk=36417&T=0

[TABLE]
[ROW][C]Summary of computational transaction[/C][/ROW]
[ROW][C]Raw Input[/C][C]view raw input (R code) [/C][/ROW]
[ROW][C]Raw Output[/C][C]view raw output of R engine [/C][/ROW]
[ROW][C]Computing time[/C][C]3 seconds[/C][/ROW]
[ROW][C]R Server[/C][C]'Herman Ole Andreas Wold' @ 193.190.124.10:1001[/C][/ROW]
[/TABLE]
Source: https://freestatistics.org/blog/index.php?pk=36417&T=0

Globally Unique Identifier (entire table): ba.freestatistics.org/blog/index.php?pk=36417&T=0

As an alternative you can also use a QR Code:  

The GUIDs for individual cells are displayed in the table below:

Summary of computational transaction
Raw Inputview raw input (R code)
Raw Outputview raw output of R engine
Computing time3 seconds
R Server'Herman Ole Andreas Wold' @ 193.190.124.10:1001


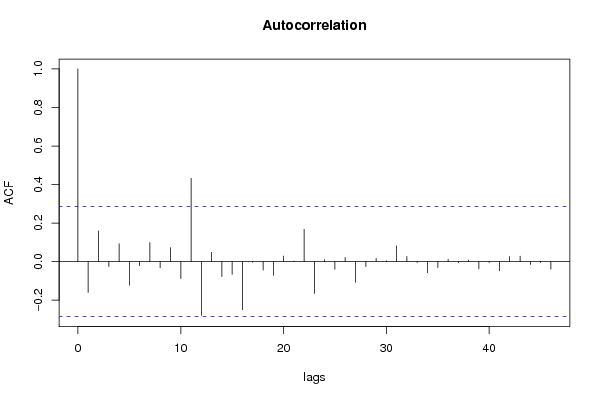
Autocorrelation Function
Time lag kACF(k)T-STATP-value
1-0.160095-1.09760.138995
20.1591271.09090.140435
3-0.025674-0.1760.430519
40.092620.6350.264263
5-0.122456-0.83950.202714
6-0.021384-0.14660.442038
70.0986660.67640.251046
8-0.032404-0.22210.41258
90.0722540.49530.311332
10-0.088187-0.60460.274184
110.4322292.96320.002383
12-0.279691-1.91750.030634
130.0482730.33090.371078
14-0.078069-0.53520.297512
15-0.066309-0.45460.325748
16-0.250069-1.71440.046523
17-0.003947-0.02710.489265
18-0.043825-0.30040.38258
19-0.071258-0.48850.313727
200.0286340.19630.422609
210.0025850.01770.492969
220.1677161.14980.128021
23-0.16542-1.13410.13126
240.0089640.06150.475629
25-0.040345-0.27660.391655
260.0212320.14560.442446
27-0.107553-0.73730.232288
28-0.025891-0.17750.429939
290.0170960.11720.453598
300.0038460.02640.489539
310.0814720.55850.289562
320.0265490.1820.42818
33-0.005173-0.03550.485929
34-0.05789-0.39690.346629
35-0.031263-0.21430.415608
360.0112230.07690.469498
37-0.005662-0.03880.484599
380.0072790.04990.480207
39-0.037252-0.25540.39977
40-0.005412-0.03710.485279
41-0.04777-0.32750.372374
420.025750.17650.430318
430.0280970.19260.424041
44-0.015686-0.10750.457411
45-0.005361-0.03680.485419
46-0.039565-0.27120.393695
47NANANA
48NANANA
49NANANA
50NANANA
51NANANA
52NANANA
53NANANA
54NANANA
55NANANA
56NANANA
57NANANA
58NANANA
59NANANA
60NANANA

\begin{tabular}{lllllllll}
\hline
Autocorrelation Function \tabularnewline
Time lag k & ACF(k) & T-STAT & P-value \tabularnewline
1 & -0.160095 & -1.0976 & 0.138995 \tabularnewline
2 & 0.159127 & 1.0909 & 0.140435 \tabularnewline
3 & -0.025674 & -0.176 & 0.430519 \tabularnewline
4 & 0.09262 & 0.635 & 0.264263 \tabularnewline
5 & -0.122456 & -0.8395 & 0.202714 \tabularnewline
6 & -0.021384 & -0.1466 & 0.442038 \tabularnewline
7 & 0.098666 & 0.6764 & 0.251046 \tabularnewline
8 & -0.032404 & -0.2221 & 0.41258 \tabularnewline
9 & 0.072254 & 0.4953 & 0.311332 \tabularnewline
10 & -0.088187 & -0.6046 & 0.274184 \tabularnewline
11 & 0.432229 & 2.9632 & 0.002383 \tabularnewline
12 & -0.279691 & -1.9175 & 0.030634 \tabularnewline
13 & 0.048273 & 0.3309 & 0.371078 \tabularnewline
14 & -0.078069 & -0.5352 & 0.297512 \tabularnewline
15 & -0.066309 & -0.4546 & 0.325748 \tabularnewline
16 & -0.250069 & -1.7144 & 0.046523 \tabularnewline
17 & -0.003947 & -0.0271 & 0.489265 \tabularnewline
18 & -0.043825 & -0.3004 & 0.38258 \tabularnewline
19 & -0.071258 & -0.4885 & 0.313727 \tabularnewline
20 & 0.028634 & 0.1963 & 0.422609 \tabularnewline
21 & 0.002585 & 0.0177 & 0.492969 \tabularnewline
22 & 0.167716 & 1.1498 & 0.128021 \tabularnewline
23 & -0.16542 & -1.1341 & 0.13126 \tabularnewline
24 & 0.008964 & 0.0615 & 0.475629 \tabularnewline
25 & -0.040345 & -0.2766 & 0.391655 \tabularnewline
26 & 0.021232 & 0.1456 & 0.442446 \tabularnewline
27 & -0.107553 & -0.7373 & 0.232288 \tabularnewline
28 & -0.025891 & -0.1775 & 0.429939 \tabularnewline
29 & 0.017096 & 0.1172 & 0.453598 \tabularnewline
30 & 0.003846 & 0.0264 & 0.489539 \tabularnewline
31 & 0.081472 & 0.5585 & 0.289562 \tabularnewline
32 & 0.026549 & 0.182 & 0.42818 \tabularnewline
33 & -0.005173 & -0.0355 & 0.485929 \tabularnewline
34 & -0.05789 & -0.3969 & 0.346629 \tabularnewline
35 & -0.031263 & -0.2143 & 0.415608 \tabularnewline
36 & 0.011223 & 0.0769 & 0.469498 \tabularnewline
37 & -0.005662 & -0.0388 & 0.484599 \tabularnewline
38 & 0.007279 & 0.0499 & 0.480207 \tabularnewline
39 & -0.037252 & -0.2554 & 0.39977 \tabularnewline
40 & -0.005412 & -0.0371 & 0.485279 \tabularnewline
41 & -0.04777 & -0.3275 & 0.372374 \tabularnewline
42 & 0.02575 & 0.1765 & 0.430318 \tabularnewline
43 & 0.028097 & 0.1926 & 0.424041 \tabularnewline
44 & -0.015686 & -0.1075 & 0.457411 \tabularnewline
45 & -0.005361 & -0.0368 & 0.485419 \tabularnewline
46 & -0.039565 & -0.2712 & 0.393695 \tabularnewline
47 & NA & NA & NA \tabularnewline
48 & NA & NA & NA \tabularnewline
49 & NA & NA & NA \tabularnewline
50 & NA & NA & NA \tabularnewline
51 & NA & NA & NA \tabularnewline
52 & NA & NA & NA \tabularnewline
53 & NA & NA & NA \tabularnewline
54 & NA & NA & NA \tabularnewline
55 & NA & NA & NA \tabularnewline
56 & NA & NA & NA \tabularnewline
57 & NA & NA & NA \tabularnewline
58 & NA & NA & NA \tabularnewline
59 & NA & NA & NA \tabularnewline
60 & NA & NA & NA \tabularnewline
\hline
\end{tabular}
%Source: https://freestatistics.org/blog/index.php?pk=36417&T=1

[TABLE]
[ROW][C]Autocorrelation Function[/C][/ROW]
[ROW][C]Time lag k[/C][C]ACF(k)[/C][C]T-STAT[/C][C]P-value[/C][/ROW]
[ROW][C]1[/C][C]-0.160095[/C][C]-1.0976[/C][C]0.138995[/C][/ROW]
[ROW][C]2[/C][C]0.159127[/C][C]1.0909[/C][C]0.140435[/C][/ROW]
[ROW][C]3[/C][C]-0.025674[/C][C]-0.176[/C][C]0.430519[/C][/ROW]
[ROW][C]4[/C][C]0.09262[/C][C]0.635[/C][C]0.264263[/C][/ROW]
[ROW][C]5[/C][C]-0.122456[/C][C]-0.8395[/C][C]0.202714[/C][/ROW]
[ROW][C]6[/C][C]-0.021384[/C][C]-0.1466[/C][C]0.442038[/C][/ROW]
[ROW][C]7[/C][C]0.098666[/C][C]0.6764[/C][C]0.251046[/C][/ROW]
[ROW][C]8[/C][C]-0.032404[/C][C]-0.2221[/C][C]0.41258[/C][/ROW]
[ROW][C]9[/C][C]0.072254[/C][C]0.4953[/C][C]0.311332[/C][/ROW]
[ROW][C]10[/C][C]-0.088187[/C][C]-0.6046[/C][C]0.274184[/C][/ROW]
[ROW][C]11[/C][C]0.432229[/C][C]2.9632[/C][C]0.002383[/C][/ROW]
[ROW][C]12[/C][C]-0.279691[/C][C]-1.9175[/C][C]0.030634[/C][/ROW]
[ROW][C]13[/C][C]0.048273[/C][C]0.3309[/C][C]0.371078[/C][/ROW]
[ROW][C]14[/C][C]-0.078069[/C][C]-0.5352[/C][C]0.297512[/C][/ROW]
[ROW][C]15[/C][C]-0.066309[/C][C]-0.4546[/C][C]0.325748[/C][/ROW]
[ROW][C]16[/C][C]-0.250069[/C][C]-1.7144[/C][C]0.046523[/C][/ROW]
[ROW][C]17[/C][C]-0.003947[/C][C]-0.0271[/C][C]0.489265[/C][/ROW]
[ROW][C]18[/C][C]-0.043825[/C][C]-0.3004[/C][C]0.38258[/C][/ROW]
[ROW][C]19[/C][C]-0.071258[/C][C]-0.4885[/C][C]0.313727[/C][/ROW]
[ROW][C]20[/C][C]0.028634[/C][C]0.1963[/C][C]0.422609[/C][/ROW]
[ROW][C]21[/C][C]0.002585[/C][C]0.0177[/C][C]0.492969[/C][/ROW]
[ROW][C]22[/C][C]0.167716[/C][C]1.1498[/C][C]0.128021[/C][/ROW]
[ROW][C]23[/C][C]-0.16542[/C][C]-1.1341[/C][C]0.13126[/C][/ROW]
[ROW][C]24[/C][C]0.008964[/C][C]0.0615[/C][C]0.475629[/C][/ROW]
[ROW][C]25[/C][C]-0.040345[/C][C]-0.2766[/C][C]0.391655[/C][/ROW]
[ROW][C]26[/C][C]0.021232[/C][C]0.1456[/C][C]0.442446[/C][/ROW]
[ROW][C]27[/C][C]-0.107553[/C][C]-0.7373[/C][C]0.232288[/C][/ROW]
[ROW][C]28[/C][C]-0.025891[/C][C]-0.1775[/C][C]0.429939[/C][/ROW]
[ROW][C]29[/C][C]0.017096[/C][C]0.1172[/C][C]0.453598[/C][/ROW]
[ROW][C]30[/C][C]0.003846[/C][C]0.0264[/C][C]0.489539[/C][/ROW]
[ROW][C]31[/C][C]0.081472[/C][C]0.5585[/C][C]0.289562[/C][/ROW]
[ROW][C]32[/C][C]0.026549[/C][C]0.182[/C][C]0.42818[/C][/ROW]
[ROW][C]33[/C][C]-0.005173[/C][C]-0.0355[/C][C]0.485929[/C][/ROW]
[ROW][C]34[/C][C]-0.05789[/C][C]-0.3969[/C][C]0.346629[/C][/ROW]
[ROW][C]35[/C][C]-0.031263[/C][C]-0.2143[/C][C]0.415608[/C][/ROW]
[ROW][C]36[/C][C]0.011223[/C][C]0.0769[/C][C]0.469498[/C][/ROW]
[ROW][C]37[/C][C]-0.005662[/C][C]-0.0388[/C][C]0.484599[/C][/ROW]
[ROW][C]38[/C][C]0.007279[/C][C]0.0499[/C][C]0.480207[/C][/ROW]
[ROW][C]39[/C][C]-0.037252[/C][C]-0.2554[/C][C]0.39977[/C][/ROW]
[ROW][C]40[/C][C]-0.005412[/C][C]-0.0371[/C][C]0.485279[/C][/ROW]
[ROW][C]41[/C][C]-0.04777[/C][C]-0.3275[/C][C]0.372374[/C][/ROW]
[ROW][C]42[/C][C]0.02575[/C][C]0.1765[/C][C]0.430318[/C][/ROW]
[ROW][C]43[/C][C]0.028097[/C][C]0.1926[/C][C]0.424041[/C][/ROW]
[ROW][C]44[/C][C]-0.015686[/C][C]-0.1075[/C][C]0.457411[/C][/ROW]
[ROW][C]45[/C][C]-0.005361[/C][C]-0.0368[/C][C]0.485419[/C][/ROW]
[ROW][C]46[/C][C]-0.039565[/C][C]-0.2712[/C][C]0.393695[/C][/ROW]
[ROW][C]47[/C][C]NA[/C][C]NA[/C][C]NA[/C][/ROW]
[ROW][C]48[/C][C]NA[/C][C]NA[/C][C]NA[/C][/ROW]
[ROW][C]49[/C][C]NA[/C][C]NA[/C][C]NA[/C][/ROW]
[ROW][C]50[/C][C]NA[/C][C]NA[/C][C]NA[/C][/ROW]
[ROW][C]51[/C][C]NA[/C][C]NA[/C][C]NA[/C][/ROW]
[ROW][C]52[/C][C]NA[/C][C]NA[/C][C]NA[/C][/ROW]
[ROW][C]53[/C][C]NA[/C][C]NA[/C][C]NA[/C][/ROW]
[ROW][C]54[/C][C]NA[/C][C]NA[/C][C]NA[/C][/ROW]
[ROW][C]55[/C][C]NA[/C][C]NA[/C][C]NA[/C][/ROW]
[ROW][C]56[/C][C]NA[/C][C]NA[/C][C]NA[/C][/ROW]
[ROW][C]57[/C][C]NA[/C][C]NA[/C][C]NA[/C][/ROW]
[ROW][C]58[/C][C]NA[/C][C]NA[/C][C]NA[/C][/ROW]
[ROW][C]59[/C][C]NA[/C][C]NA[/C][C]NA[/C][/ROW]
[ROW][C]60[/C][C]NA[/C][C]NA[/C][C]NA[/C][/ROW]
[/TABLE]
Source: https://freestatistics.org/blog/index.php?pk=36417&T=1

Globally Unique Identifier (entire table): ba.freestatistics.org/blog/index.php?pk=36417&T=1

As an alternative you can also use a QR Code:  

The GUIDs for individual cells are displayed in the table below:

Autocorrelation Function
Time lag kACF(k)T-STATP-value
1-0.160095-1.09760.138995
20.1591271.09090.140435
3-0.025674-0.1760.430519
40.092620.6350.264263
5-0.122456-0.83950.202714
6-0.021384-0.14660.442038
70.0986660.67640.251046
8-0.032404-0.22210.41258
90.0722540.49530.311332
10-0.088187-0.60460.274184
110.4322292.96320.002383
12-0.279691-1.91750.030634
130.0482730.33090.371078
14-0.078069-0.53520.297512
15-0.066309-0.45460.325748
16-0.250069-1.71440.046523
17-0.003947-0.02710.489265
18-0.043825-0.30040.38258
19-0.071258-0.48850.313727
200.0286340.19630.422609
210.0025850.01770.492969
220.1677161.14980.128021
23-0.16542-1.13410.13126
240.0089640.06150.475629
25-0.040345-0.27660.391655
260.0212320.14560.442446
27-0.107553-0.73730.232288
28-0.025891-0.17750.429939
290.0170960.11720.453598
300.0038460.02640.489539
310.0814720.55850.289562
320.0265490.1820.42818
33-0.005173-0.03550.485929
34-0.05789-0.39690.346629
35-0.031263-0.21430.415608
360.0112230.07690.469498
37-0.005662-0.03880.484599
380.0072790.04990.480207
39-0.037252-0.25540.39977
40-0.005412-0.03710.485279
41-0.04777-0.32750.372374
420.025750.17650.430318
430.0280970.19260.424041
44-0.015686-0.10750.457411
45-0.005361-0.03680.485419
46-0.039565-0.27120.393695
47NANANA
48NANANA
49NANANA
50NANANA
51NANANA
52NANANA
53NANANA
54NANANA
55NANANA
56NANANA
57NANANA
58NANANA
59NANANA
60NANANA


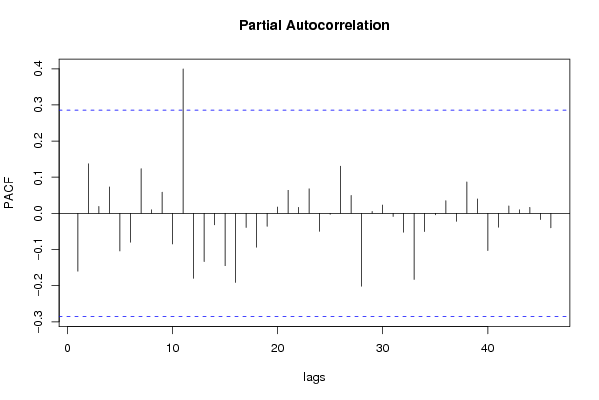
Partial Autocorrelation Function
Time lag kPACF(k)T-STATP-value
1-0.160095-1.09760.138995
20.1370080.93930.176195
30.0190830.13080.448235
40.0730750.5010.309364
5-0.104079-0.71350.239524
6-0.079727-0.54660.293626
70.12350.84670.200734
80.0097830.06710.473407
90.0583850.40030.345386
10-0.084508-0.57940.282557
110.3995732.73930.004336
12-0.179934-1.23360.111749
13-0.133453-0.91490.182456
14-0.031687-0.21720.414483
15-0.14485-0.9930.162888
16-0.191128-1.31030.09823
17-0.039147-0.26840.394792
18-0.093687-0.64230.261903
19-0.03588-0.2460.403384
200.0175170.12010.452463
210.0636390.43630.332314
220.0165240.11330.455145
230.0677390.46440.322255
24-0.0497-0.34070.367415
25-0.002705-0.01850.49264
260.1305830.89520.187613
270.0496830.34060.367458
28-0.201769-1.38330.086561
290.0051320.03520.486042
300.022940.15730.437853
31-0.00854-0.05850.476781
32-0.051994-0.35650.361549
33-0.183001-1.25460.107915
34-0.050515-0.34630.365326
35-0.003984-0.02730.489162
360.0349730.23980.405778
37-0.022066-0.15130.440203
380.0868480.59540.277217
390.0397710.27270.393155
40-0.103037-0.70640.241717
41-0.038335-0.26280.396923
420.0204260.140.444615
430.0098670.06760.473177
440.0165330.11330.455119
45-0.017104-0.11730.453577
46-0.039995-0.27420.392571
47NANANA
48NANANA
49NANANA
50NANANA
51NANANA
52NANANA
53NANANA
54NANANA
55NANANA
56NANANA
57NANANA
58NANANA
59NANANA
60NANANA

\begin{tabular}{lllllllll}
\hline
Partial Autocorrelation Function \tabularnewline
Time lag k & PACF(k) & T-STAT & P-value \tabularnewline
1 & -0.160095 & -1.0976 & 0.138995 \tabularnewline
2 & 0.137008 & 0.9393 & 0.176195 \tabularnewline
3 & 0.019083 & 0.1308 & 0.448235 \tabularnewline
4 & 0.073075 & 0.501 & 0.309364 \tabularnewline
5 & -0.104079 & -0.7135 & 0.239524 \tabularnewline
6 & -0.079727 & -0.5466 & 0.293626 \tabularnewline
7 & 0.1235 & 0.8467 & 0.200734 \tabularnewline
8 & 0.009783 & 0.0671 & 0.473407 \tabularnewline
9 & 0.058385 & 0.4003 & 0.345386 \tabularnewline
10 & -0.084508 & -0.5794 & 0.282557 \tabularnewline
11 & 0.399573 & 2.7393 & 0.004336 \tabularnewline
12 & -0.179934 & -1.2336 & 0.111749 \tabularnewline
13 & -0.133453 & -0.9149 & 0.182456 \tabularnewline
14 & -0.031687 & -0.2172 & 0.414483 \tabularnewline
15 & -0.14485 & -0.993 & 0.162888 \tabularnewline
16 & -0.191128 & -1.3103 & 0.09823 \tabularnewline
17 & -0.039147 & -0.2684 & 0.394792 \tabularnewline
18 & -0.093687 & -0.6423 & 0.261903 \tabularnewline
19 & -0.03588 & -0.246 & 0.403384 \tabularnewline
20 & 0.017517 & 0.1201 & 0.452463 \tabularnewline
21 & 0.063639 & 0.4363 & 0.332314 \tabularnewline
22 & 0.016524 & 0.1133 & 0.455145 \tabularnewline
23 & 0.067739 & 0.4644 & 0.322255 \tabularnewline
24 & -0.0497 & -0.3407 & 0.367415 \tabularnewline
25 & -0.002705 & -0.0185 & 0.49264 \tabularnewline
26 & 0.130583 & 0.8952 & 0.187613 \tabularnewline
27 & 0.049683 & 0.3406 & 0.367458 \tabularnewline
28 & -0.201769 & -1.3833 & 0.086561 \tabularnewline
29 & 0.005132 & 0.0352 & 0.486042 \tabularnewline
30 & 0.02294 & 0.1573 & 0.437853 \tabularnewline
31 & -0.00854 & -0.0585 & 0.476781 \tabularnewline
32 & -0.051994 & -0.3565 & 0.361549 \tabularnewline
33 & -0.183001 & -1.2546 & 0.107915 \tabularnewline
34 & -0.050515 & -0.3463 & 0.365326 \tabularnewline
35 & -0.003984 & -0.0273 & 0.489162 \tabularnewline
36 & 0.034973 & 0.2398 & 0.405778 \tabularnewline
37 & -0.022066 & -0.1513 & 0.440203 \tabularnewline
38 & 0.086848 & 0.5954 & 0.277217 \tabularnewline
39 & 0.039771 & 0.2727 & 0.393155 \tabularnewline
40 & -0.103037 & -0.7064 & 0.241717 \tabularnewline
41 & -0.038335 & -0.2628 & 0.396923 \tabularnewline
42 & 0.020426 & 0.14 & 0.444615 \tabularnewline
43 & 0.009867 & 0.0676 & 0.473177 \tabularnewline
44 & 0.016533 & 0.1133 & 0.455119 \tabularnewline
45 & -0.017104 & -0.1173 & 0.453577 \tabularnewline
46 & -0.039995 & -0.2742 & 0.392571 \tabularnewline
47 & NA & NA & NA \tabularnewline
48 & NA & NA & NA \tabularnewline
49 & NA & NA & NA \tabularnewline
50 & NA & NA & NA \tabularnewline
51 & NA & NA & NA \tabularnewline
52 & NA & NA & NA \tabularnewline
53 & NA & NA & NA \tabularnewline
54 & NA & NA & NA \tabularnewline
55 & NA & NA & NA \tabularnewline
56 & NA & NA & NA \tabularnewline
57 & NA & NA & NA \tabularnewline
58 & NA & NA & NA \tabularnewline
59 & NA & NA & NA \tabularnewline
60 & NA & NA & NA \tabularnewline
\hline
\end{tabular}
%Source: https://freestatistics.org/blog/index.php?pk=36417&T=2

[TABLE]
[ROW][C]Partial Autocorrelation Function[/C][/ROW]
[ROW][C]Time lag k[/C][C]PACF(k)[/C][C]T-STAT[/C][C]P-value[/C][/ROW]
[ROW][C]1[/C][C]-0.160095[/C][C]-1.0976[/C][C]0.138995[/C][/ROW]
[ROW][C]2[/C][C]0.137008[/C][C]0.9393[/C][C]0.176195[/C][/ROW]
[ROW][C]3[/C][C]0.019083[/C][C]0.1308[/C][C]0.448235[/C][/ROW]
[ROW][C]4[/C][C]0.073075[/C][C]0.501[/C][C]0.309364[/C][/ROW]
[ROW][C]5[/C][C]-0.104079[/C][C]-0.7135[/C][C]0.239524[/C][/ROW]
[ROW][C]6[/C][C]-0.079727[/C][C]-0.5466[/C][C]0.293626[/C][/ROW]
[ROW][C]7[/C][C]0.1235[/C][C]0.8467[/C][C]0.200734[/C][/ROW]
[ROW][C]8[/C][C]0.009783[/C][C]0.0671[/C][C]0.473407[/C][/ROW]
[ROW][C]9[/C][C]0.058385[/C][C]0.4003[/C][C]0.345386[/C][/ROW]
[ROW][C]10[/C][C]-0.084508[/C][C]-0.5794[/C][C]0.282557[/C][/ROW]
[ROW][C]11[/C][C]0.399573[/C][C]2.7393[/C][C]0.004336[/C][/ROW]
[ROW][C]12[/C][C]-0.179934[/C][C]-1.2336[/C][C]0.111749[/C][/ROW]
[ROW][C]13[/C][C]-0.133453[/C][C]-0.9149[/C][C]0.182456[/C][/ROW]
[ROW][C]14[/C][C]-0.031687[/C][C]-0.2172[/C][C]0.414483[/C][/ROW]
[ROW][C]15[/C][C]-0.14485[/C][C]-0.993[/C][C]0.162888[/C][/ROW]
[ROW][C]16[/C][C]-0.191128[/C][C]-1.3103[/C][C]0.09823[/C][/ROW]
[ROW][C]17[/C][C]-0.039147[/C][C]-0.2684[/C][C]0.394792[/C][/ROW]
[ROW][C]18[/C][C]-0.093687[/C][C]-0.6423[/C][C]0.261903[/C][/ROW]
[ROW][C]19[/C][C]-0.03588[/C][C]-0.246[/C][C]0.403384[/C][/ROW]
[ROW][C]20[/C][C]0.017517[/C][C]0.1201[/C][C]0.452463[/C][/ROW]
[ROW][C]21[/C][C]0.063639[/C][C]0.4363[/C][C]0.332314[/C][/ROW]
[ROW][C]22[/C][C]0.016524[/C][C]0.1133[/C][C]0.455145[/C][/ROW]
[ROW][C]23[/C][C]0.067739[/C][C]0.4644[/C][C]0.322255[/C][/ROW]
[ROW][C]24[/C][C]-0.0497[/C][C]-0.3407[/C][C]0.367415[/C][/ROW]
[ROW][C]25[/C][C]-0.002705[/C][C]-0.0185[/C][C]0.49264[/C][/ROW]
[ROW][C]26[/C][C]0.130583[/C][C]0.8952[/C][C]0.187613[/C][/ROW]
[ROW][C]27[/C][C]0.049683[/C][C]0.3406[/C][C]0.367458[/C][/ROW]
[ROW][C]28[/C][C]-0.201769[/C][C]-1.3833[/C][C]0.086561[/C][/ROW]
[ROW][C]29[/C][C]0.005132[/C][C]0.0352[/C][C]0.486042[/C][/ROW]
[ROW][C]30[/C][C]0.02294[/C][C]0.1573[/C][C]0.437853[/C][/ROW]
[ROW][C]31[/C][C]-0.00854[/C][C]-0.0585[/C][C]0.476781[/C][/ROW]
[ROW][C]32[/C][C]-0.051994[/C][C]-0.3565[/C][C]0.361549[/C][/ROW]
[ROW][C]33[/C][C]-0.183001[/C][C]-1.2546[/C][C]0.107915[/C][/ROW]
[ROW][C]34[/C][C]-0.050515[/C][C]-0.3463[/C][C]0.365326[/C][/ROW]
[ROW][C]35[/C][C]-0.003984[/C][C]-0.0273[/C][C]0.489162[/C][/ROW]
[ROW][C]36[/C][C]0.034973[/C][C]0.2398[/C][C]0.405778[/C][/ROW]
[ROW][C]37[/C][C]-0.022066[/C][C]-0.1513[/C][C]0.440203[/C][/ROW]
[ROW][C]38[/C][C]0.086848[/C][C]0.5954[/C][C]0.277217[/C][/ROW]
[ROW][C]39[/C][C]0.039771[/C][C]0.2727[/C][C]0.393155[/C][/ROW]
[ROW][C]40[/C][C]-0.103037[/C][C]-0.7064[/C][C]0.241717[/C][/ROW]
[ROW][C]41[/C][C]-0.038335[/C][C]-0.2628[/C][C]0.396923[/C][/ROW]
[ROW][C]42[/C][C]0.020426[/C][C]0.14[/C][C]0.444615[/C][/ROW]
[ROW][C]43[/C][C]0.009867[/C][C]0.0676[/C][C]0.473177[/C][/ROW]
[ROW][C]44[/C][C]0.016533[/C][C]0.1133[/C][C]0.455119[/C][/ROW]
[ROW][C]45[/C][C]-0.017104[/C][C]-0.1173[/C][C]0.453577[/C][/ROW]
[ROW][C]46[/C][C]-0.039995[/C][C]-0.2742[/C][C]0.392571[/C][/ROW]
[ROW][C]47[/C][C]NA[/C][C]NA[/C][C]NA[/C][/ROW]
[ROW][C]48[/C][C]NA[/C][C]NA[/C][C]NA[/C][/ROW]
[ROW][C]49[/C][C]NA[/C][C]NA[/C][C]NA[/C][/ROW]
[ROW][C]50[/C][C]NA[/C][C]NA[/C][C]NA[/C][/ROW]
[ROW][C]51[/C][C]NA[/C][C]NA[/C][C]NA[/C][/ROW]
[ROW][C]52[/C][C]NA[/C][C]NA[/C][C]NA[/C][/ROW]
[ROW][C]53[/C][C]NA[/C][C]NA[/C][C]NA[/C][/ROW]
[ROW][C]54[/C][C]NA[/C][C]NA[/C][C]NA[/C][/ROW]
[ROW][C]55[/C][C]NA[/C][C]NA[/C][C]NA[/C][/ROW]
[ROW][C]56[/C][C]NA[/C][C]NA[/C][C]NA[/C][/ROW]
[ROW][C]57[/C][C]NA[/C][C]NA[/C][C]NA[/C][/ROW]
[ROW][C]58[/C][C]NA[/C][C]NA[/C][C]NA[/C][/ROW]
[ROW][C]59[/C][C]NA[/C][C]NA[/C][C]NA[/C][/ROW]
[ROW][C]60[/C][C]NA[/C][C]NA[/C][C]NA[/C][/ROW]
[/TABLE]
Source: https://freestatistics.org/blog/index.php?pk=36417&T=2

Globally Unique Identifier (entire table): ba.freestatistics.org/blog/index.php?pk=36417&T=2

As an alternative you can also use a QR Code:  

The GUIDs for individual cells are displayed in the table below:

Partial Autocorrelation Function
Time lag kPACF(k)T-STATP-value
1-0.160095-1.09760.138995
20.1370080.93930.176195
30.0190830.13080.448235
40.0730750.5010.309364
5-0.104079-0.71350.239524
6-0.079727-0.54660.293626
70.12350.84670.200734
80.0097830.06710.473407
90.0583850.40030.345386
10-0.084508-0.57940.282557
110.3995732.73930.004336
12-0.179934-1.23360.111749
13-0.133453-0.91490.182456
14-0.031687-0.21720.414483
15-0.14485-0.9930.162888
16-0.191128-1.31030.09823
17-0.039147-0.26840.394792
18-0.093687-0.64230.261903
19-0.03588-0.2460.403384
200.0175170.12010.452463
210.0636390.43630.332314
220.0165240.11330.455145
230.0677390.46440.322255
24-0.0497-0.34070.367415
25-0.002705-0.01850.49264
260.1305830.89520.187613
270.0496830.34060.367458
28-0.201769-1.38330.086561
290.0051320.03520.486042
300.022940.15730.437853
31-0.00854-0.05850.476781
32-0.051994-0.35650.361549
33-0.183001-1.25460.107915
34-0.050515-0.34630.365326
35-0.003984-0.02730.489162
360.0349730.23980.405778
37-0.022066-0.15130.440203
380.0868480.59540.277217
390.0397710.27270.393155
40-0.103037-0.70640.241717
41-0.038335-0.26280.396923
420.0204260.140.444615
430.0098670.06760.473177
440.0165330.11330.455119
45-0.017104-0.11730.453577
46-0.039995-0.27420.392571
47NANANA
48NANANA
49NANANA
50NANANA
51NANANA
52NANANA
53NANANA
54NANANA
55NANANA
56NANANA
57NANANA
58NANANA
59NANANA
60NANANA


Parameters (Session):
par1 = 60 ; par2 = 1 ; par3 = 1 ; par4 = 1 ; par5 = 12 ;
Parameters (R input):
par1 = 60 ; par2 = 1 ; par3 = 1 ; par4 = 1 ; par5 = 12 ;
R code (references can be found in the software module):
if (par1 == 'Default') {
par1 = 10*log10(length(x))
} else {
par1 <- as.numeric(par1)
}
par2 <- as.numeric(par2)
par3 <- as.numeric(par3)
par4 <- as.numeric(par4)
par5 <- as.numeric(par5)
if (par2 == 0) {
x <- log(x)
} else {
x <- (x ^ par2 - 1) / par2
}
if (par3 > 0) x <- diff(x,lag=1,difference=par3)
if (par4 > 0) x <- diff(x,lag=par5,difference=par4)
bitmap(file='pic1.png')
racf <- acf(x,par1,main='Autocorrelation',xlab='lags',ylab='ACF')
dev.off()
bitmap(file='pic2.png')
rpacf <- pacf(x,par1,main='Partial Autocorrelation',xlab='lags',ylab='PACF')
dev.off()
(myacf <- c(racf$acf))
(mypacf <- c(rpacf$acf))
lengthx <- length(x)
sqrtn <- sqrt(lengthx)
load(file='createtable')
a<-table.start()
a<-table.row.start(a)
a<-table.element(a,'Autocorrelation Function',4,TRUE)
a<-table.row.end(a)
a<-table.row.start(a)
a<-table.element(a,'Time lag k',header=TRUE)
a<-table.element(a,hyperlink('basics.htm','ACF(k)','click here for more information about the Autocorrelation Function'),header=TRUE)
a<-table.element(a,'T-STAT',header=TRUE)
a<-table.element(a,'P-value',header=TRUE)
a<-table.row.end(a)
for (i in 2:(par1+1)) {
a<-table.row.start(a)
a<-table.element(a,i-1,header=TRUE)
a<-table.element(a,round(myacf[i],6))
mytstat <- myacf[i]*sqrtn
a<-table.element(a,round(mytstat,4))
a<-table.element(a,round(1-pt(abs(mytstat),lengthx),6))
a<-table.row.end(a)
}
a<-table.end(a)
table.save(a,file='mytable.tab')
a<-table.start()
a<-table.row.start(a)
a<-table.element(a,'Partial Autocorrelation Function',4,TRUE)
a<-table.row.end(a)
a<-table.row.start(a)
a<-table.element(a,'Time lag k',header=TRUE)
a<-table.element(a,hyperlink('basics.htm','PACF(k)','click here for more information about the Partial Autocorrelation Function'),header=TRUE)
a<-table.element(a,'T-STAT',header=TRUE)
a<-table.element(a,'P-value',header=TRUE)
a<-table.row.end(a)
for (i in 1:par1) {
a<-table.row.start(a)
a<-table.element(a,i,header=TRUE)
a<-table.element(a,round(mypacf[i],6))
mytstat <- mypacf[i]*sqrtn
a<-table.element(a,round(mytstat,4))
a<-table.element(a,round(1-pt(abs(mytstat),lengthx),6))
a<-table.row.end(a)
}
a<-table.end(a)
table.save(a,file='mytable1.tab')