Free Statistics

of Irreproducible Research!

Author's title

Author*Unverified author*
R Software Modulerwasp_smp.wasp
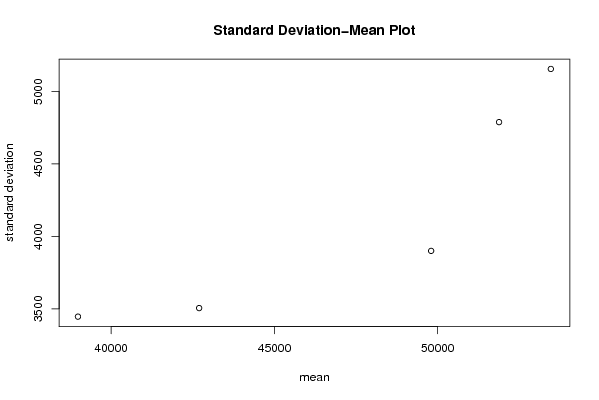
Title produced by softwareStandard Deviation-Mean Plot
Date of computationTue, 23 Dec 2008 12:26:32 -0700
Cite this page as followsStatistical Computations at FreeStatistics.org, Office for Research Development and Education, URL https://freestatistics.org/blog/index.php?v=date/2008/Dec/23/t12300604945ov3y0vqzu9zklg.htm/, Retrieved Sat, 04 May 2024 10:19:07 +0000
Statistical Computations at FreeStatistics.org, Office for Research Development and Education, URL https://freestatistics.org/blog/index.php?pk=36376, Retrieved Sat, 04 May 2024 10:19:07 +0000
QR Codes:

Original text written by user:
IsPrivate?No (this computation is public)
User-defined keywords
Estimated Impact159
Family? (F = Feedback message, R = changed R code, M = changed R Module, P = changed Parameters, D = changed Data)
-       [Standard Deviation-Mean Plot] [SMP Mannen] [2008-12-23 19:26:32] [f0e1dc59aca2fa8d78080b39899f316a] [Current]
-  M D    [Standard Deviation-Mean Plot] [Paper 1] [2009-12-10 14:45:59] [33b67a4fef396e07351e7d265eba4806]
-  M D    [Standard Deviation-Mean Plot] [Paper - 2] [2009-12-10 14:55:39] [33b67a4fef396e07351e7d265eba4806]
Feedback Forum

Post a new message
Dataseries X:
54156
53661
52441
50648
48141
46127
45623
56527
60205
61321
58088
54623
53495
51824
50518
49050
47111
45264
44357
54862
57871
59070
56273
52837
51702
49447
48965
46922
46256
45200
44471
53119
55016
56641
51847
47990
45744
46390
44461
41582
40813
38096
35461
44375
46255
45610
43375
40167
40628
40590
39473
36735
36634
32806
32907
41076
42254
43215
41116
40373


Summary of computational transaction
Raw Inputview raw input (R code)
Raw Outputview raw output of R engine
Computing time0 seconds
R Server'George Udny Yule' @ 72.249.76.132

\begin{tabular}{lllllllll}
\hline
Summary of computational transaction \tabularnewline
Raw Input & view raw input (R code)  \tabularnewline
Raw Output & view raw output of R engine  \tabularnewline
Computing time & 0 seconds \tabularnewline
R Server & 'George Udny Yule' @ 72.249.76.132 \tabularnewline
\hline
\end{tabular}
%Source: https://freestatistics.org/blog/index.php?pk=36376&T=0

[TABLE]
[ROW][C]Summary of computational transaction[/C][/ROW]
[ROW][C]Raw Input[/C][C]view raw input (R code) [/C][/ROW]
[ROW][C]Raw Output[/C][C]view raw output of R engine [/C][/ROW]
[ROW][C]Computing time[/C][C]0 seconds[/C][/ROW]
[ROW][C]R Server[/C][C]'George Udny Yule' @ 72.249.76.132[/C][/ROW]
[/TABLE]
Source: https://freestatistics.org/blog/index.php?pk=36376&T=0

Globally Unique Identifier (entire table): ba.freestatistics.org/blog/index.php?pk=36376&T=0

As an alternative you can also use a QR Code:  

The GUIDs for individual cells are displayed in the table below:

Summary of computational transaction
Raw Inputview raw input (R code)
Raw Outputview raw output of R engine
Computing time0 seconds
R Server'George Udny Yule' @ 72.249.76.132


Standard Deviation-Mean Plot
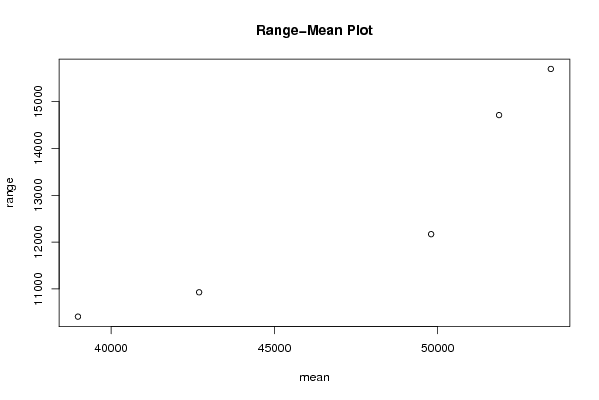
SectionMeanStandard DeviationRange
153463.41666666675155.9443973716315698
251877.66666666674789.0062422050414713
3497983900.2151222721012170
442694.08333333333505.538875922810929
538983.91666666673446.2717261710610409

\begin{tabular}{lllllllll}
\hline
Standard Deviation-Mean Plot \tabularnewline
Section & Mean & Standard Deviation & Range \tabularnewline
1 & 53463.4166666667 & 5155.94439737163 & 15698 \tabularnewline
2 & 51877.6666666667 & 4789.00624220504 & 14713 \tabularnewline
3 & 49798 & 3900.21512227210 & 12170 \tabularnewline
4 & 42694.0833333333 & 3505.5388759228 & 10929 \tabularnewline
5 & 38983.9166666667 & 3446.27172617106 & 10409 \tabularnewline
\hline
\end{tabular}
%Source: https://freestatistics.org/blog/index.php?pk=36376&T=1

[TABLE]
[ROW][C]Standard Deviation-Mean Plot[/C][/ROW]
[ROW][C]Section[/C][C]Mean[/C][C]Standard Deviation[/C][C]Range[/C][/ROW]
[ROW][C]1[/C][C]53463.4166666667[/C][C]5155.94439737163[/C][C]15698[/C][/ROW]
[ROW][C]2[/C][C]51877.6666666667[/C][C]4789.00624220504[/C][C]14713[/C][/ROW]
[ROW][C]3[/C][C]49798[/C][C]3900.21512227210[/C][C]12170[/C][/ROW]
[ROW][C]4[/C][C]42694.0833333333[/C][C]3505.5388759228[/C][C]10929[/C][/ROW]
[ROW][C]5[/C][C]38983.9166666667[/C][C]3446.27172617106[/C][C]10409[/C][/ROW]
[/TABLE]
Source: https://freestatistics.org/blog/index.php?pk=36376&T=1

Globally Unique Identifier (entire table): ba.freestatistics.org/blog/index.php?pk=36376&T=1

As an alternative you can also use a QR Code:  

The GUIDs for individual cells are displayed in the table below:

Standard Deviation-Mean Plot
SectionMeanStandard DeviationRange
153463.41666666675155.9443973716315698
251877.66666666674789.0062422050414713
3497983900.2151222721012170
442694.08333333333505.538875922810929
538983.91666666673446.2717261710610409


Regression: S.E.(k) = alpha + beta * Mean(k)
alpha-1114.55723680555
beta0.111350761426503
S.D.0.0315445976061523
T-STAT3.52994711857685
p-value0.0386406853630511

\begin{tabular}{lllllllll}
\hline
Regression: S.E.(k) = alpha + beta * Mean(k) \tabularnewline
alpha & -1114.55723680555 \tabularnewline
beta & 0.111350761426503 \tabularnewline
S.D. & 0.0315445976061523 \tabularnewline
T-STAT & 3.52994711857685 \tabularnewline
p-value & 0.0386406853630511 \tabularnewline
\hline
\end{tabular}
%Source: https://freestatistics.org/blog/index.php?pk=36376&T=2

[TABLE]
[ROW][C]Regression: S.E.(k) = alpha + beta * Mean(k)[/C][/ROW]
[ROW][C]alpha[/C][C]-1114.55723680555[/C][/ROW]
[ROW][C]beta[/C][C]0.111350761426503[/C][/ROW]
[ROW][C]S.D.[/C][C]0.0315445976061523[/C][/ROW]
[ROW][C]T-STAT[/C][C]3.52994711857685[/C][/ROW]
[ROW][C]p-value[/C][C]0.0386406853630511[/C][/ROW]
[/TABLE]
Source: https://freestatistics.org/blog/index.php?pk=36376&T=2

Globally Unique Identifier (entire table): ba.freestatistics.org/blog/index.php?pk=36376&T=2

As an alternative you can also use a QR Code:  

The GUIDs for individual cells are displayed in the table below:

Regression: S.E.(k) = alpha + beta * Mean(k)
alpha-1114.55723680555
beta0.111350761426503
S.D.0.0315445976061523
T-STAT3.52994711857685
p-value0.0386406853630511


Regression: ln S.E.(k) = alpha + beta * ln Mean(k)
alpha-4.71150923992636
beta1.21125168083739
S.D.0.338678282914523
T-STAT3.57640788306197
p-value0.0373815487049422
Lambda-0.211251680837393

\begin{tabular}{lllllllll}
\hline
Regression: ln S.E.(k) = alpha + beta * ln Mean(k) \tabularnewline
alpha & -4.71150923992636 \tabularnewline
beta & 1.21125168083739 \tabularnewline
S.D. & 0.338678282914523 \tabularnewline
T-STAT & 3.57640788306197 \tabularnewline
p-value & 0.0373815487049422 \tabularnewline
Lambda & -0.211251680837393 \tabularnewline
\hline
\end{tabular}
%Source: https://freestatistics.org/blog/index.php?pk=36376&T=3

[TABLE]
[ROW][C]Regression: ln S.E.(k) = alpha + beta * ln Mean(k)[/C][/ROW]
[ROW][C]alpha[/C][C]-4.71150923992636[/C][/ROW]
[ROW][C]beta[/C][C]1.21125168083739[/C][/ROW]
[ROW][C]S.D.[/C][C]0.338678282914523[/C][/ROW]
[ROW][C]T-STAT[/C][C]3.57640788306197[/C][/ROW]
[ROW][C]p-value[/C][C]0.0373815487049422[/C][/ROW]
[ROW][C]Lambda[/C][C]-0.211251680837393[/C][/ROW]
[/TABLE]
Source: https://freestatistics.org/blog/index.php?pk=36376&T=3

Globally Unique Identifier (entire table): ba.freestatistics.org/blog/index.php?pk=36376&T=3

As an alternative you can also use a QR Code:  

The GUIDs for individual cells are displayed in the table below:

Regression: ln S.E.(k) = alpha + beta * ln Mean(k)
alpha-4.71150923992636
beta1.21125168083739
S.D.0.338678282914523
T-STAT3.57640788306197
p-value0.0373815487049422
Lambda-0.211251680837393


Parameters (Session):
par1 = 12 ;
Parameters (R input):
par1 = 12 ;
R code (references can be found in the software module):
par1 <- as.numeric(par1)
(n <- length(x))
(np <- floor(n / par1))
arr <- array(NA,dim=c(par1,np))
j <- 0
k <- 1
for (i in 1:(np*par1))
{
j = j + 1
arr[j,k] <- x[i]
if (j == par1) {
j = 0
k=k+1
}
}
arr
arr.mean <- array(NA,dim=np)
arr.sd <- array(NA,dim=np)
arr.range <- array(NA,dim=np)
for (j in 1:np)
{
arr.mean[j] <- mean(arr[,j],na.rm=TRUE)
arr.sd[j] <- sd(arr[,j],na.rm=TRUE)
arr.range[j] <- max(arr[,j],na.rm=TRUE) - min(arr[,j],na.rm=TRUE)
}
arr.mean
arr.sd
arr.range
(lm1 <- lm(arr.sd~arr.mean))
(lnlm1 <- lm(log(arr.sd)~log(arr.mean)))
(lm2 <- lm(arr.range~arr.mean))
bitmap(file='test1.png')
plot(arr.mean,arr.sd,main='Standard Deviation-Mean Plot',xlab='mean',ylab='standard deviation')
dev.off()
bitmap(file='test2.png')
plot(arr.mean,arr.range,main='Range-Mean Plot',xlab='mean',ylab='range')
dev.off()
load(file='createtable')
a<-table.start()
a<-table.row.start(a)
a<-table.element(a,'Standard Deviation-Mean Plot',4,TRUE)
a<-table.row.end(a)
a<-table.row.start(a)
a<-table.element(a,'Section',header=TRUE)
a<-table.element(a,'Mean',header=TRUE)
a<-table.element(a,'Standard Deviation',header=TRUE)
a<-table.element(a,'Range',header=TRUE)
a<-table.row.end(a)
for (j in 1:np) {
a<-table.row.start(a)
a<-table.element(a,j,header=TRUE)
a<-table.element(a,arr.mean[j])
a<-table.element(a,arr.sd[j] )
a<-table.element(a,arr.range[j] )
a<-table.row.end(a)
}
a<-table.end(a)
table.save(a,file='mytable.tab')
a<-table.start()
a<-table.row.start(a)
a<-table.element(a,'Regression: S.E.(k) = alpha + beta * Mean(k)',2,TRUE)
a<-table.row.end(a)
a<-table.row.start(a)
a<-table.element(a,'alpha',header=TRUE)
a<-table.element(a,lm1$coefficients[[1]])
a<-table.row.end(a)
a<-table.row.start(a)
a<-table.element(a,'beta',header=TRUE)
a<-table.element(a,lm1$coefficients[[2]])
a<-table.row.end(a)
a<-table.row.start(a)
a<-table.element(a,'S.D.',header=TRUE)
a<-table.element(a,summary(lm1)$coefficients[2,2])
a<-table.row.end(a)
a<-table.row.start(a)
a<-table.element(a,'T-STAT',header=TRUE)
a<-table.element(a,summary(lm1)$coefficients[2,3])
a<-table.row.end(a)
a<-table.row.start(a)
a<-table.element(a,'p-value',header=TRUE)
a<-table.element(a,summary(lm1)$coefficients[2,4])
a<-table.row.end(a)
a<-table.end(a)
table.save(a,file='mytable1.tab')
a<-table.start()
a<-table.row.start(a)
a<-table.element(a,'Regression: ln S.E.(k) = alpha + beta * ln Mean(k)',2,TRUE)
a<-table.row.end(a)
a<-table.row.start(a)
a<-table.element(a,'alpha',header=TRUE)
a<-table.element(a,lnlm1$coefficients[[1]])
a<-table.row.end(a)
a<-table.row.start(a)
a<-table.element(a,'beta',header=TRUE)
a<-table.element(a,lnlm1$coefficients[[2]])
a<-table.row.end(a)
a<-table.row.start(a)
a<-table.element(a,'S.D.',header=TRUE)
a<-table.element(a,summary(lnlm1)$coefficients[2,2])
a<-table.row.end(a)
a<-table.row.start(a)
a<-table.element(a,'T-STAT',header=TRUE)
a<-table.element(a,summary(lnlm1)$coefficients[2,3])
a<-table.row.end(a)
a<-table.row.start(a)
a<-table.element(a,'p-value',header=TRUE)
a<-table.element(a,summary(lnlm1)$coefficients[2,4])
a<-table.row.end(a)
a<-table.row.start(a)
a<-table.element(a,'Lambda',header=TRUE)
a<-table.element(a,1-lnlm1$coefficients[[2]])
a<-table.row.end(a)
a<-table.end(a)
table.save(a,file='mytable2.tab')