Free Statistics

of Irreproducible Research!

Author's title

Author*The author of this computation has been verified*
R Software Modulerwasp_autocorrelation.wasp
Title produced by software(Partial) Autocorrelation Function
Date of computationTue, 23 Dec 2008 10:09:26 -0700
Cite this page as followsStatistical Computations at FreeStatistics.org, Office for Research Development and Education, URL https://freestatistics.org/blog/index.php?v=date/2008/Dec/23/t1230052202kxykyryf01mcowj.htm/, Retrieved Fri, 24 May 2024 06:35:28 +0000
Statistical Computations at FreeStatistics.org, Office for Research Development and Education, URL https://freestatistics.org/blog/index.php?pk=36358, Retrieved Fri, 24 May 2024 06:35:28 +0000
QR Codes:

Original text written by user:
IsPrivate?No (this computation is public)
User-defined keywords
Estimated Impact135
Family? (F = Feedback message, R = changed R code, M = changed R Module, P = changed Parameters, D = changed Data)
-     [Variance Reduction Matrix] [] [2008-12-23 15:10:07] [74be16979710d4c4e7c6647856088456]
- RMP   [Spectral Analysis] [] [2008-12-23 16:32:35] [74be16979710d4c4e7c6647856088456]
-   P     [Spectral Analysis] [] [2008-12-23 16:40:41] [74be16979710d4c4e7c6647856088456]
- RMPD      [(Partial) Autocorrelation Function] [] [2008-12-23 17:04:06] [74be16979710d4c4e7c6647856088456]
-               [(Partial) Autocorrelation Function] [] [2008-12-23 17:09:26] [d41d8cd98f00b204e9800998ecf8427e] [Current]
Feedback Forum

Post a new message
Dataseries X:
513
503
471
471
476
475
470
461
455
456
517
525
523
519
509
512
519
517
510
509
501
507
569
580
578
565
547
555
562
561
555
544
537
543
594
611
613
611
594
595
591
589
584
573
567
569
621
629
628
612
595
597
593
590
580
574
573
573
620
626
620
588
566
557
561
549
532
526
511
499
555
565
542
527


Summary of computational transaction
Raw Inputview raw input (R code)
Raw Outputview raw output of R engine
Computing time0 seconds
R Server'George Udny Yule' @ 72.249.76.132

\begin{tabular}{lllllllll}
\hline
Summary of computational transaction \tabularnewline
Raw Input & view raw input (R code)  \tabularnewline
Raw Output & view raw output of R engine  \tabularnewline
Computing time & 0 seconds \tabularnewline
R Server & 'George Udny Yule' @ 72.249.76.132 \tabularnewline
\hline
\end{tabular}
%Source: https://freestatistics.org/blog/index.php?pk=36358&T=0

[TABLE]
[ROW][C]Summary of computational transaction[/C][/ROW]
[ROW][C]Raw Input[/C][C]view raw input (R code) [/C][/ROW]
[ROW][C]Raw Output[/C][C]view raw output of R engine [/C][/ROW]
[ROW][C]Computing time[/C][C]0 seconds[/C][/ROW]
[ROW][C]R Server[/C][C]'George Udny Yule' @ 72.249.76.132[/C][/ROW]
[/TABLE]
Source: https://freestatistics.org/blog/index.php?pk=36358&T=0

Globally Unique Identifier (entire table): ba.freestatistics.org/blog/index.php?pk=36358&T=0

As an alternative you can also use a QR Code:  

The GUIDs for individual cells are displayed in the table below:

Summary of computational transaction
Raw Inputview raw input (R code)
Raw Outputview raw output of R engine
Computing time0 seconds
R Server'George Udny Yule' @ 72.249.76.132


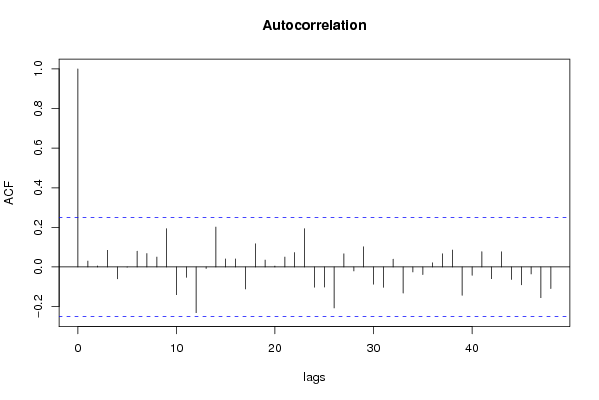
Autocorrelation Function
Time lag kACF(k)T-STATP-value
10.0296370.23150.408861
20.0053940.04210.483267
30.0840890.65680.256905
4-0.059611-0.46560.321588
5-0.00144-0.01120.49553
60.0798740.62380.267532
70.0677280.5290.299371
80.0498450.38930.349204
90.1932891.50960.06815
10-0.139958-1.09310.139323
11-0.052167-0.40740.342558
12-0.230623-1.80120.038306
13-0.007605-0.05940.476415
140.2016841.57520.060191
150.0404570.3160.376547
160.0402980.31470.377019
17-0.111177-0.86830.194312
180.1165950.91060.183036
190.0349030.27260.393042
200.0048280.03770.48502
210.0501670.39180.34828
220.0729980.57010.28534
230.1935051.51130.067935
24-0.102464-0.80030.213329
25-0.101826-0.79530.214765
26-0.207259-1.61870.055331
270.0663880.51850.30299
28-0.020137-0.15730.437775
290.1018530.79550.214705
30-0.086801-0.67790.250187
31-0.102736-0.80240.21272
320.0392190.30630.380205
33-0.13177-1.02920.153734
34-0.025066-0.19580.42272
35-0.038425-0.30010.382556
360.02070.16170.436049
370.0664350.51890.302863
380.0855460.66810.253284
39-0.143373-1.11980.133599
40-0.041995-0.3280.372019
410.077110.60230.27462
42-0.059284-0.4630.322497
430.0764430.5970.276345
44-0.062831-0.49070.312692
45-0.090364-0.70580.241511
46-0.035571-0.27780.391045
47-0.154987-1.21050.115381
48-0.10936-0.85410.198189

\begin{tabular}{lllllllll}
\hline
Autocorrelation Function \tabularnewline
Time lag k & ACF(k) & T-STAT & P-value \tabularnewline
1 & 0.029637 & 0.2315 & 0.408861 \tabularnewline
2 & 0.005394 & 0.0421 & 0.483267 \tabularnewline
3 & 0.084089 & 0.6568 & 0.256905 \tabularnewline
4 & -0.059611 & -0.4656 & 0.321588 \tabularnewline
5 & -0.00144 & -0.0112 & 0.49553 \tabularnewline
6 & 0.079874 & 0.6238 & 0.267532 \tabularnewline
7 & 0.067728 & 0.529 & 0.299371 \tabularnewline
8 & 0.049845 & 0.3893 & 0.349204 \tabularnewline
9 & 0.193289 & 1.5096 & 0.06815 \tabularnewline
10 & -0.139958 & -1.0931 & 0.139323 \tabularnewline
11 & -0.052167 & -0.4074 & 0.342558 \tabularnewline
12 & -0.230623 & -1.8012 & 0.038306 \tabularnewline
13 & -0.007605 & -0.0594 & 0.476415 \tabularnewline
14 & 0.201684 & 1.5752 & 0.060191 \tabularnewline
15 & 0.040457 & 0.316 & 0.376547 \tabularnewline
16 & 0.040298 & 0.3147 & 0.377019 \tabularnewline
17 & -0.111177 & -0.8683 & 0.194312 \tabularnewline
18 & 0.116595 & 0.9106 & 0.183036 \tabularnewline
19 & 0.034903 & 0.2726 & 0.393042 \tabularnewline
20 & 0.004828 & 0.0377 & 0.48502 \tabularnewline
21 & 0.050167 & 0.3918 & 0.34828 \tabularnewline
22 & 0.072998 & 0.5701 & 0.28534 \tabularnewline
23 & 0.193505 & 1.5113 & 0.067935 \tabularnewline
24 & -0.102464 & -0.8003 & 0.213329 \tabularnewline
25 & -0.101826 & -0.7953 & 0.214765 \tabularnewline
26 & -0.207259 & -1.6187 & 0.055331 \tabularnewline
27 & 0.066388 & 0.5185 & 0.30299 \tabularnewline
28 & -0.020137 & -0.1573 & 0.437775 \tabularnewline
29 & 0.101853 & 0.7955 & 0.214705 \tabularnewline
30 & -0.086801 & -0.6779 & 0.250187 \tabularnewline
31 & -0.102736 & -0.8024 & 0.21272 \tabularnewline
32 & 0.039219 & 0.3063 & 0.380205 \tabularnewline
33 & -0.13177 & -1.0292 & 0.153734 \tabularnewline
34 & -0.025066 & -0.1958 & 0.42272 \tabularnewline
35 & -0.038425 & -0.3001 & 0.382556 \tabularnewline
36 & 0.0207 & 0.1617 & 0.436049 \tabularnewline
37 & 0.066435 & 0.5189 & 0.302863 \tabularnewline
38 & 0.085546 & 0.6681 & 0.253284 \tabularnewline
39 & -0.143373 & -1.1198 & 0.133599 \tabularnewline
40 & -0.041995 & -0.328 & 0.372019 \tabularnewline
41 & 0.07711 & 0.6023 & 0.27462 \tabularnewline
42 & -0.059284 & -0.463 & 0.322497 \tabularnewline
43 & 0.076443 & 0.597 & 0.276345 \tabularnewline
44 & -0.062831 & -0.4907 & 0.312692 \tabularnewline
45 & -0.090364 & -0.7058 & 0.241511 \tabularnewline
46 & -0.035571 & -0.2778 & 0.391045 \tabularnewline
47 & -0.154987 & -1.2105 & 0.115381 \tabularnewline
48 & -0.10936 & -0.8541 & 0.198189 \tabularnewline
\hline
\end{tabular}
%Source: https://freestatistics.org/blog/index.php?pk=36358&T=1

[TABLE]
[ROW][C]Autocorrelation Function[/C][/ROW]
[ROW][C]Time lag k[/C][C]ACF(k)[/C][C]T-STAT[/C][C]P-value[/C][/ROW]
[ROW][C]1[/C][C]0.029637[/C][C]0.2315[/C][C]0.408861[/C][/ROW]
[ROW][C]2[/C][C]0.005394[/C][C]0.0421[/C][C]0.483267[/C][/ROW]
[ROW][C]3[/C][C]0.084089[/C][C]0.6568[/C][C]0.256905[/C][/ROW]
[ROW][C]4[/C][C]-0.059611[/C][C]-0.4656[/C][C]0.321588[/C][/ROW]
[ROW][C]5[/C][C]-0.00144[/C][C]-0.0112[/C][C]0.49553[/C][/ROW]
[ROW][C]6[/C][C]0.079874[/C][C]0.6238[/C][C]0.267532[/C][/ROW]
[ROW][C]7[/C][C]0.067728[/C][C]0.529[/C][C]0.299371[/C][/ROW]
[ROW][C]8[/C][C]0.049845[/C][C]0.3893[/C][C]0.349204[/C][/ROW]
[ROW][C]9[/C][C]0.193289[/C][C]1.5096[/C][C]0.06815[/C][/ROW]
[ROW][C]10[/C][C]-0.139958[/C][C]-1.0931[/C][C]0.139323[/C][/ROW]
[ROW][C]11[/C][C]-0.052167[/C][C]-0.4074[/C][C]0.342558[/C][/ROW]
[ROW][C]12[/C][C]-0.230623[/C][C]-1.8012[/C][C]0.038306[/C][/ROW]
[ROW][C]13[/C][C]-0.007605[/C][C]-0.0594[/C][C]0.476415[/C][/ROW]
[ROW][C]14[/C][C]0.201684[/C][C]1.5752[/C][C]0.060191[/C][/ROW]
[ROW][C]15[/C][C]0.040457[/C][C]0.316[/C][C]0.376547[/C][/ROW]
[ROW][C]16[/C][C]0.040298[/C][C]0.3147[/C][C]0.377019[/C][/ROW]
[ROW][C]17[/C][C]-0.111177[/C][C]-0.8683[/C][C]0.194312[/C][/ROW]
[ROW][C]18[/C][C]0.116595[/C][C]0.9106[/C][C]0.183036[/C][/ROW]
[ROW][C]19[/C][C]0.034903[/C][C]0.2726[/C][C]0.393042[/C][/ROW]
[ROW][C]20[/C][C]0.004828[/C][C]0.0377[/C][C]0.48502[/C][/ROW]
[ROW][C]21[/C][C]0.050167[/C][C]0.3918[/C][C]0.34828[/C][/ROW]
[ROW][C]22[/C][C]0.072998[/C][C]0.5701[/C][C]0.28534[/C][/ROW]
[ROW][C]23[/C][C]0.193505[/C][C]1.5113[/C][C]0.067935[/C][/ROW]
[ROW][C]24[/C][C]-0.102464[/C][C]-0.8003[/C][C]0.213329[/C][/ROW]
[ROW][C]25[/C][C]-0.101826[/C][C]-0.7953[/C][C]0.214765[/C][/ROW]
[ROW][C]26[/C][C]-0.207259[/C][C]-1.6187[/C][C]0.055331[/C][/ROW]
[ROW][C]27[/C][C]0.066388[/C][C]0.5185[/C][C]0.30299[/C][/ROW]
[ROW][C]28[/C][C]-0.020137[/C][C]-0.1573[/C][C]0.437775[/C][/ROW]
[ROW][C]29[/C][C]0.101853[/C][C]0.7955[/C][C]0.214705[/C][/ROW]
[ROW][C]30[/C][C]-0.086801[/C][C]-0.6779[/C][C]0.250187[/C][/ROW]
[ROW][C]31[/C][C]-0.102736[/C][C]-0.8024[/C][C]0.21272[/C][/ROW]
[ROW][C]32[/C][C]0.039219[/C][C]0.3063[/C][C]0.380205[/C][/ROW]
[ROW][C]33[/C][C]-0.13177[/C][C]-1.0292[/C][C]0.153734[/C][/ROW]
[ROW][C]34[/C][C]-0.025066[/C][C]-0.1958[/C][C]0.42272[/C][/ROW]
[ROW][C]35[/C][C]-0.038425[/C][C]-0.3001[/C][C]0.382556[/C][/ROW]
[ROW][C]36[/C][C]0.0207[/C][C]0.1617[/C][C]0.436049[/C][/ROW]
[ROW][C]37[/C][C]0.066435[/C][C]0.5189[/C][C]0.302863[/C][/ROW]
[ROW][C]38[/C][C]0.085546[/C][C]0.6681[/C][C]0.253284[/C][/ROW]
[ROW][C]39[/C][C]-0.143373[/C][C]-1.1198[/C][C]0.133599[/C][/ROW]
[ROW][C]40[/C][C]-0.041995[/C][C]-0.328[/C][C]0.372019[/C][/ROW]
[ROW][C]41[/C][C]0.07711[/C][C]0.6023[/C][C]0.27462[/C][/ROW]
[ROW][C]42[/C][C]-0.059284[/C][C]-0.463[/C][C]0.322497[/C][/ROW]
[ROW][C]43[/C][C]0.076443[/C][C]0.597[/C][C]0.276345[/C][/ROW]
[ROW][C]44[/C][C]-0.062831[/C][C]-0.4907[/C][C]0.312692[/C][/ROW]
[ROW][C]45[/C][C]-0.090364[/C][C]-0.7058[/C][C]0.241511[/C][/ROW]
[ROW][C]46[/C][C]-0.035571[/C][C]-0.2778[/C][C]0.391045[/C][/ROW]
[ROW][C]47[/C][C]-0.154987[/C][C]-1.2105[/C][C]0.115381[/C][/ROW]
[ROW][C]48[/C][C]-0.10936[/C][C]-0.8541[/C][C]0.198189[/C][/ROW]
[/TABLE]
Source: https://freestatistics.org/blog/index.php?pk=36358&T=1

Globally Unique Identifier (entire table): ba.freestatistics.org/blog/index.php?pk=36358&T=1

As an alternative you can also use a QR Code:  

The GUIDs for individual cells are displayed in the table below:

Autocorrelation Function
Time lag kACF(k)T-STATP-value
10.0296370.23150.408861
20.0053940.04210.483267
30.0840890.65680.256905
4-0.059611-0.46560.321588
5-0.00144-0.01120.49553
60.0798740.62380.267532
70.0677280.5290.299371
80.0498450.38930.349204
90.1932891.50960.06815
10-0.139958-1.09310.139323
11-0.052167-0.40740.342558
12-0.230623-1.80120.038306
13-0.007605-0.05940.476415
140.2016841.57520.060191
150.0404570.3160.376547
160.0402980.31470.377019
17-0.111177-0.86830.194312
180.1165950.91060.183036
190.0349030.27260.393042
200.0048280.03770.48502
210.0501670.39180.34828
220.0729980.57010.28534
230.1935051.51130.067935
24-0.102464-0.80030.213329
25-0.101826-0.79530.214765
26-0.207259-1.61870.055331
270.0663880.51850.30299
28-0.020137-0.15730.437775
290.1018530.79550.214705
30-0.086801-0.67790.250187
31-0.102736-0.80240.21272
320.0392190.30630.380205
33-0.13177-1.02920.153734
34-0.025066-0.19580.42272
35-0.038425-0.30010.382556
360.02070.16170.436049
370.0664350.51890.302863
380.0855460.66810.253284
39-0.143373-1.11980.133599
40-0.041995-0.3280.372019
410.077110.60230.27462
42-0.059284-0.4630.322497
430.0764430.5970.276345
44-0.062831-0.49070.312692
45-0.090364-0.70580.241511
46-0.035571-0.27780.391045
47-0.154987-1.21050.115381
48-0.10936-0.85410.198189


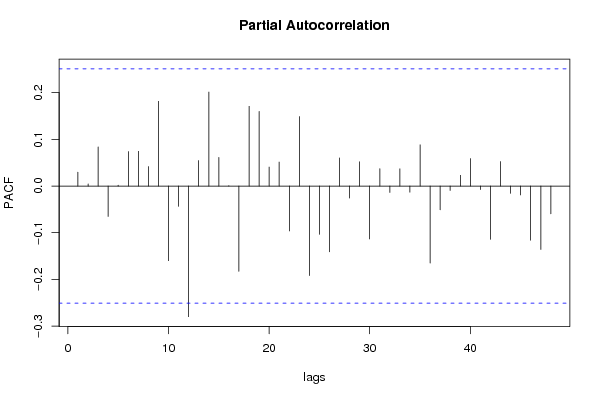
Partial Autocorrelation Function
Time lag kPACF(k)T-STATP-value
10.0296370.23150.408861
20.004520.03530.485978
30.0838710.65510.257448
4-0.065073-0.50820.306562
50.0019270.01510.49402
60.0740240.57810.282647
70.0743150.58040.281886
80.0416710.32550.372974
90.1814821.41740.080724
10-0.159908-1.24890.108233
11-0.043446-0.33930.367765
12-0.279891-2.1860.016331
130.0545150.42580.335884
140.2015181.57390.060341
150.0612160.47810.317139
160.0007010.00550.497824
17-0.182622-1.42630.079436
180.1708381.33430.093535
190.1599161.2490.108222
200.040780.31850.375596
210.0513590.40110.344865
22-0.096071-0.75030.227968
230.1487961.16210.124854
24-0.191751-1.49760.069694
25-0.103396-0.80750.211244
26-0.140936-1.10070.137667
270.0602770.47080.319738
28-0.025843-0.20180.420358
290.0518840.40520.343363
30-0.113332-0.88520.189776
310.0372090.29060.386168
32-0.013625-0.10640.457802
330.0370730.28950.386571
34-0.013155-0.10270.459251
350.0884820.69110.246072
36-0.164965-1.28840.101233
37-0.051048-0.39870.345754
38-0.009336-0.07290.471056
390.0229410.17920.429197
400.0589980.46080.323296
41-0.007482-0.05840.476795
42-0.114182-0.89180.188004
430.0524520.40970.341744
44-0.015467-0.12080.452123
45-0.019098-0.14920.44096
46-0.116093-0.90670.184063
47-0.135894-1.06140.146355
48-0.059515-0.46480.321855

\begin{tabular}{lllllllll}
\hline
Partial Autocorrelation Function \tabularnewline
Time lag k & PACF(k) & T-STAT & P-value \tabularnewline
1 & 0.029637 & 0.2315 & 0.408861 \tabularnewline
2 & 0.00452 & 0.0353 & 0.485978 \tabularnewline
3 & 0.083871 & 0.6551 & 0.257448 \tabularnewline
4 & -0.065073 & -0.5082 & 0.306562 \tabularnewline
5 & 0.001927 & 0.0151 & 0.49402 \tabularnewline
6 & 0.074024 & 0.5781 & 0.282647 \tabularnewline
7 & 0.074315 & 0.5804 & 0.281886 \tabularnewline
8 & 0.041671 & 0.3255 & 0.372974 \tabularnewline
9 & 0.181482 & 1.4174 & 0.080724 \tabularnewline
10 & -0.159908 & -1.2489 & 0.108233 \tabularnewline
11 & -0.043446 & -0.3393 & 0.367765 \tabularnewline
12 & -0.279891 & -2.186 & 0.016331 \tabularnewline
13 & 0.054515 & 0.4258 & 0.335884 \tabularnewline
14 & 0.201518 & 1.5739 & 0.060341 \tabularnewline
15 & 0.061216 & 0.4781 & 0.317139 \tabularnewline
16 & 0.000701 & 0.0055 & 0.497824 \tabularnewline
17 & -0.182622 & -1.4263 & 0.079436 \tabularnewline
18 & 0.170838 & 1.3343 & 0.093535 \tabularnewline
19 & 0.159916 & 1.249 & 0.108222 \tabularnewline
20 & 0.04078 & 0.3185 & 0.375596 \tabularnewline
21 & 0.051359 & 0.4011 & 0.344865 \tabularnewline
22 & -0.096071 & -0.7503 & 0.227968 \tabularnewline
23 & 0.148796 & 1.1621 & 0.124854 \tabularnewline
24 & -0.191751 & -1.4976 & 0.069694 \tabularnewline
25 & -0.103396 & -0.8075 & 0.211244 \tabularnewline
26 & -0.140936 & -1.1007 & 0.137667 \tabularnewline
27 & 0.060277 & 0.4708 & 0.319738 \tabularnewline
28 & -0.025843 & -0.2018 & 0.420358 \tabularnewline
29 & 0.051884 & 0.4052 & 0.343363 \tabularnewline
30 & -0.113332 & -0.8852 & 0.189776 \tabularnewline
31 & 0.037209 & 0.2906 & 0.386168 \tabularnewline
32 & -0.013625 & -0.1064 & 0.457802 \tabularnewline
33 & 0.037073 & 0.2895 & 0.386571 \tabularnewline
34 & -0.013155 & -0.1027 & 0.459251 \tabularnewline
35 & 0.088482 & 0.6911 & 0.246072 \tabularnewline
36 & -0.164965 & -1.2884 & 0.101233 \tabularnewline
37 & -0.051048 & -0.3987 & 0.345754 \tabularnewline
38 & -0.009336 & -0.0729 & 0.471056 \tabularnewline
39 & 0.022941 & 0.1792 & 0.429197 \tabularnewline
40 & 0.058998 & 0.4608 & 0.323296 \tabularnewline
41 & -0.007482 & -0.0584 & 0.476795 \tabularnewline
42 & -0.114182 & -0.8918 & 0.188004 \tabularnewline
43 & 0.052452 & 0.4097 & 0.341744 \tabularnewline
44 & -0.015467 & -0.1208 & 0.452123 \tabularnewline
45 & -0.019098 & -0.1492 & 0.44096 \tabularnewline
46 & -0.116093 & -0.9067 & 0.184063 \tabularnewline
47 & -0.135894 & -1.0614 & 0.146355 \tabularnewline
48 & -0.059515 & -0.4648 & 0.321855 \tabularnewline
\hline
\end{tabular}
%Source: https://freestatistics.org/blog/index.php?pk=36358&T=2

[TABLE]
[ROW][C]Partial Autocorrelation Function[/C][/ROW]
[ROW][C]Time lag k[/C][C]PACF(k)[/C][C]T-STAT[/C][C]P-value[/C][/ROW]
[ROW][C]1[/C][C]0.029637[/C][C]0.2315[/C][C]0.408861[/C][/ROW]
[ROW][C]2[/C][C]0.00452[/C][C]0.0353[/C][C]0.485978[/C][/ROW]
[ROW][C]3[/C][C]0.083871[/C][C]0.6551[/C][C]0.257448[/C][/ROW]
[ROW][C]4[/C][C]-0.065073[/C][C]-0.5082[/C][C]0.306562[/C][/ROW]
[ROW][C]5[/C][C]0.001927[/C][C]0.0151[/C][C]0.49402[/C][/ROW]
[ROW][C]6[/C][C]0.074024[/C][C]0.5781[/C][C]0.282647[/C][/ROW]
[ROW][C]7[/C][C]0.074315[/C][C]0.5804[/C][C]0.281886[/C][/ROW]
[ROW][C]8[/C][C]0.041671[/C][C]0.3255[/C][C]0.372974[/C][/ROW]
[ROW][C]9[/C][C]0.181482[/C][C]1.4174[/C][C]0.080724[/C][/ROW]
[ROW][C]10[/C][C]-0.159908[/C][C]-1.2489[/C][C]0.108233[/C][/ROW]
[ROW][C]11[/C][C]-0.043446[/C][C]-0.3393[/C][C]0.367765[/C][/ROW]
[ROW][C]12[/C][C]-0.279891[/C][C]-2.186[/C][C]0.016331[/C][/ROW]
[ROW][C]13[/C][C]0.054515[/C][C]0.4258[/C][C]0.335884[/C][/ROW]
[ROW][C]14[/C][C]0.201518[/C][C]1.5739[/C][C]0.060341[/C][/ROW]
[ROW][C]15[/C][C]0.061216[/C][C]0.4781[/C][C]0.317139[/C][/ROW]
[ROW][C]16[/C][C]0.000701[/C][C]0.0055[/C][C]0.497824[/C][/ROW]
[ROW][C]17[/C][C]-0.182622[/C][C]-1.4263[/C][C]0.079436[/C][/ROW]
[ROW][C]18[/C][C]0.170838[/C][C]1.3343[/C][C]0.093535[/C][/ROW]
[ROW][C]19[/C][C]0.159916[/C][C]1.249[/C][C]0.108222[/C][/ROW]
[ROW][C]20[/C][C]0.04078[/C][C]0.3185[/C][C]0.375596[/C][/ROW]
[ROW][C]21[/C][C]0.051359[/C][C]0.4011[/C][C]0.344865[/C][/ROW]
[ROW][C]22[/C][C]-0.096071[/C][C]-0.7503[/C][C]0.227968[/C][/ROW]
[ROW][C]23[/C][C]0.148796[/C][C]1.1621[/C][C]0.124854[/C][/ROW]
[ROW][C]24[/C][C]-0.191751[/C][C]-1.4976[/C][C]0.069694[/C][/ROW]
[ROW][C]25[/C][C]-0.103396[/C][C]-0.8075[/C][C]0.211244[/C][/ROW]
[ROW][C]26[/C][C]-0.140936[/C][C]-1.1007[/C][C]0.137667[/C][/ROW]
[ROW][C]27[/C][C]0.060277[/C][C]0.4708[/C][C]0.319738[/C][/ROW]
[ROW][C]28[/C][C]-0.025843[/C][C]-0.2018[/C][C]0.420358[/C][/ROW]
[ROW][C]29[/C][C]0.051884[/C][C]0.4052[/C][C]0.343363[/C][/ROW]
[ROW][C]30[/C][C]-0.113332[/C][C]-0.8852[/C][C]0.189776[/C][/ROW]
[ROW][C]31[/C][C]0.037209[/C][C]0.2906[/C][C]0.386168[/C][/ROW]
[ROW][C]32[/C][C]-0.013625[/C][C]-0.1064[/C][C]0.457802[/C][/ROW]
[ROW][C]33[/C][C]0.037073[/C][C]0.2895[/C][C]0.386571[/C][/ROW]
[ROW][C]34[/C][C]-0.013155[/C][C]-0.1027[/C][C]0.459251[/C][/ROW]
[ROW][C]35[/C][C]0.088482[/C][C]0.6911[/C][C]0.246072[/C][/ROW]
[ROW][C]36[/C][C]-0.164965[/C][C]-1.2884[/C][C]0.101233[/C][/ROW]
[ROW][C]37[/C][C]-0.051048[/C][C]-0.3987[/C][C]0.345754[/C][/ROW]
[ROW][C]38[/C][C]-0.009336[/C][C]-0.0729[/C][C]0.471056[/C][/ROW]
[ROW][C]39[/C][C]0.022941[/C][C]0.1792[/C][C]0.429197[/C][/ROW]
[ROW][C]40[/C][C]0.058998[/C][C]0.4608[/C][C]0.323296[/C][/ROW]
[ROW][C]41[/C][C]-0.007482[/C][C]-0.0584[/C][C]0.476795[/C][/ROW]
[ROW][C]42[/C][C]-0.114182[/C][C]-0.8918[/C][C]0.188004[/C][/ROW]
[ROW][C]43[/C][C]0.052452[/C][C]0.4097[/C][C]0.341744[/C][/ROW]
[ROW][C]44[/C][C]-0.015467[/C][C]-0.1208[/C][C]0.452123[/C][/ROW]
[ROW][C]45[/C][C]-0.019098[/C][C]-0.1492[/C][C]0.44096[/C][/ROW]
[ROW][C]46[/C][C]-0.116093[/C][C]-0.9067[/C][C]0.184063[/C][/ROW]
[ROW][C]47[/C][C]-0.135894[/C][C]-1.0614[/C][C]0.146355[/C][/ROW]
[ROW][C]48[/C][C]-0.059515[/C][C]-0.4648[/C][C]0.321855[/C][/ROW]
[/TABLE]
Source: https://freestatistics.org/blog/index.php?pk=36358&T=2

Globally Unique Identifier (entire table): ba.freestatistics.org/blog/index.php?pk=36358&T=2

As an alternative you can also use a QR Code:  

The GUIDs for individual cells are displayed in the table below:

Partial Autocorrelation Function
Time lag kPACF(k)T-STATP-value
10.0296370.23150.408861
20.004520.03530.485978
30.0838710.65510.257448
4-0.065073-0.50820.306562
50.0019270.01510.49402
60.0740240.57810.282647
70.0743150.58040.281886
80.0416710.32550.372974
90.1814821.41740.080724
10-0.159908-1.24890.108233
11-0.043446-0.33930.367765
12-0.279891-2.1860.016331
130.0545150.42580.335884
140.2015181.57390.060341
150.0612160.47810.317139
160.0007010.00550.497824
17-0.182622-1.42630.079436
180.1708381.33430.093535
190.1599161.2490.108222
200.040780.31850.375596
210.0513590.40110.344865
22-0.096071-0.75030.227968
230.1487961.16210.124854
24-0.191751-1.49760.069694
25-0.103396-0.80750.211244
26-0.140936-1.10070.137667
270.0602770.47080.319738
28-0.025843-0.20180.420358
290.0518840.40520.343363
30-0.113332-0.88520.189776
310.0372090.29060.386168
32-0.013625-0.10640.457802
330.0370730.28950.386571
34-0.013155-0.10270.459251
350.0884820.69110.246072
36-0.164965-1.28840.101233
37-0.051048-0.39870.345754
38-0.009336-0.07290.471056
390.0229410.17920.429197
400.0589980.46080.323296
41-0.007482-0.05840.476795
42-0.114182-0.89180.188004
430.0524520.40970.341744
44-0.015467-0.12080.452123
45-0.019098-0.14920.44096
46-0.116093-0.90670.184063
47-0.135894-1.06140.146355
48-0.059515-0.46480.321855


Parameters (Session):
par1 = 48 ; par2 = 1 ; par3 = 0 ; par4 = 0 ; par5 = 12 ;
Parameters (R input):
par1 = 48 ; par2 = 1 ; par3 = 1 ; par4 = 1 ; par5 = 12 ;
R code (references can be found in the software module):
if (par1 == 'Default') {
par1 = 10*log10(length(x))
} else {
par1 <- as.numeric(par1)
}
par2 <- as.numeric(par2)
par3 <- as.numeric(par3)
par4 <- as.numeric(par4)
par5 <- as.numeric(par5)
if (par2 == 0) {
x <- log(x)
} else {
x <- (x ^ par2 - 1) / par2
}
if (par3 > 0) x <- diff(x,lag=1,difference=par3)
if (par4 > 0) x <- diff(x,lag=par5,difference=par4)
bitmap(file='pic1.png')
racf <- acf(x,par1,main='Autocorrelation',xlab='lags',ylab='ACF')
dev.off()
bitmap(file='pic2.png')
rpacf <- pacf(x,par1,main='Partial Autocorrelation',xlab='lags',ylab='PACF')
dev.off()
(myacf <- c(racf$acf))
(mypacf <- c(rpacf$acf))
lengthx <- length(x)
sqrtn <- sqrt(lengthx)
load(file='createtable')
a<-table.start()
a<-table.row.start(a)
a<-table.element(a,'Autocorrelation Function',4,TRUE)
a<-table.row.end(a)
a<-table.row.start(a)
a<-table.element(a,'Time lag k',header=TRUE)
a<-table.element(a,hyperlink('basics.htm','ACF(k)','click here for more information about the Autocorrelation Function'),header=TRUE)
a<-table.element(a,'T-STAT',header=TRUE)
a<-table.element(a,'P-value',header=TRUE)
a<-table.row.end(a)
for (i in 2:(par1+1)) {
a<-table.row.start(a)
a<-table.element(a,i-1,header=TRUE)
a<-table.element(a,round(myacf[i],6))
mytstat <- myacf[i]*sqrtn
a<-table.element(a,round(mytstat,4))
a<-table.element(a,round(1-pt(abs(mytstat),lengthx),6))
a<-table.row.end(a)
}
a<-table.end(a)
table.save(a,file='mytable.tab')
a<-table.start()
a<-table.row.start(a)
a<-table.element(a,'Partial Autocorrelation Function',4,TRUE)
a<-table.row.end(a)
a<-table.row.start(a)
a<-table.element(a,'Time lag k',header=TRUE)
a<-table.element(a,hyperlink('basics.htm','PACF(k)','click here for more information about the Partial Autocorrelation Function'),header=TRUE)
a<-table.element(a,'T-STAT',header=TRUE)
a<-table.element(a,'P-value',header=TRUE)
a<-table.row.end(a)
for (i in 1:par1) {
a<-table.row.start(a)
a<-table.element(a,i,header=TRUE)
a<-table.element(a,round(mypacf[i],6))
mytstat <- mypacf[i]*sqrtn
a<-table.element(a,round(mytstat,4))
a<-table.element(a,round(1-pt(abs(mytstat),lengthx),6))
a<-table.row.end(a)
}
a<-table.end(a)
table.save(a,file='mytable1.tab')